Abstract
The X-ray properties of a sample of high redshift (z0.6), massive clusters observed with and are described, including two exceptional systems. One, at z=0.89, has an X-ray temperature of T=11.5 keV (the highest temperature of any cluster known at z0.6), an estimated mass of (1.40.2)x1015 , and appears relaxed. The other, at z=0.83, has at least three sub-clumps, probably in the process of merging, and may also show signs of faint filamentary structure at large radii, observed in X-rays. In general there is a mix of X-ray morphologies, from those clusters which appear relaxed and containing little substructure to some highly non-virialized and probably merging systems. The X-ray gas metallicities and gas mass fractions of the relaxed systems are similar to those of low redshift clusters of the same temperature, suggesting that the gas was in place, and containing its metals, by z0.8. The evolution of the mass-temperature relation may be consistent with no evolution or with the “late formation” assumption. The effect of point source contamination in the survey from which these clusters were selected is estimated, and the implications for the X-ray luminosity function discussed.
Chapter 0 AN XMM and Chandra view of massive clusters of galaxies to z=1
1 Introduction
Massive clusters of galaxies are rare objects, forming from the high-sigma tail of the cosmological density distribution. Their properties are powerful probes of cosmology, and give insight into the process of structure formation on large scales. For example, compared to z=0, and in a CDM Universe, the number density of virialized halos of x1014 is predicted to be a factor of 10 lower at z=0.5, or a factor of 100 lower at z=1, from both simulations and the Press-Schechter approximation (eg. Bode et al.2001). Such a large change in number density implies that a significant fraction of the progenitor systems at high redshift should be unvirialized, perhaps containing lower mass systems in the process of merging.
The number of genuinely massive clusters known at high redshifts is very small, and the number of relaxed high redshift massive clusters is even smaller. Thus the fraction which are relaxed, giving direct information on the epoch and mode of assembly of massive clusters, is poorly known. Relaxed, massive clusters at high redshifts also offer the best opportunities for deriving total masses and gas mass fractions from the X-ray data without too many uncertainties due to hydrostatic equilibrium assumptions, and also with reasonable signal-to-noise.
Detailed analyses of 3 of the clusters presented here can be found in Maughan et al.(2003a,b). We use =0.3, =0.7 and H0=70 km s-1 unless otherwise stated.
2 The cluster sample
The clusters were discovered in a serendipitous X-ray survey (WARPS - Scharf et al.1997, Jones et al.1998, Perlman et al.2002). Of 16 clusters at z0.6 which form a complete, X-ray selected sample, 10 have been observed with and/or . For 3 of these, the observations were of low quality due to periods of high background. The remaining observations, however, represent a major step forward compared to previous results from (see also Rosati et al., these proceedings and references therein).
3 Analysis of the high redshift clusters
Standard analysis techniques were applied to the and data, taking into account the ACIS contamination affecting the low energy efficiency, and using a local background subtraction method to obtain spectra. Images were exposure corrected and adaptively smoothed so that all features are significant at the 99% confidence level.
In general a single temperature was measured (but see CLJ1226.9+3332 below for a temperature profile). Two-dimensional -profiles were fit to the images, including PSF blurring, to obtain values for the core radii and . For the clusters which appeared relaxed, and assuming spherical symmetry, the gas mass was derived from an integral of the density profile given by the -profile. The total gravitating mass was derived by additionally assuming isothermality and hydrostatic equilibrium. The total mass within a radius is then given by
| (1) |
To measure the virial radius, we used eqn (1.1) to find the radius within which the total overdensity was 200 times the critical density at the redshift of each cluster. The quoted fluxes, luminosities and masses were measured via an extrapolation from the typical detection radius of 0.3-0.45 to the virial radius.
4 Descriptions of the clusters
1 A massive, relaxed cluster at z=0.89
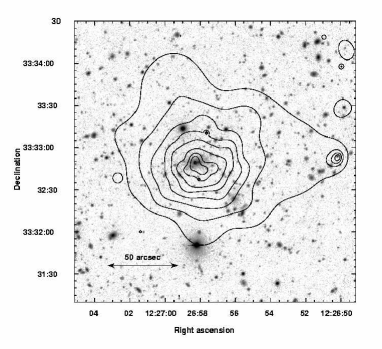
The discovery of CLJ1226.9+3332 is described by Ebeling et al.(2001). The image of CLJ1226.9+3332 is shown in Fig 1, overlaid on a deep I band image. The X-ray morphology appears generally relaxed, in contrast to cluster MS1054-0321, the other high temperature cluster known at z0.8 (Jeltema et al.2001). The temperature of 11.5 keV is consistent with the velocity dispersion of 1100 km s-1, based on 15 galaxy redshifts. The bolometric X-ray luminosity is 5.4x1045 erg s-1. We derive a mass of (1.40.2)x1015 within the virial radius. Our analysis of a short observation confirms the lack of significant point-source contamination, and the temperature and luminosity, albeit with lower precision (see also Cagnoni et al.2001).
A temperature profile (Fig 1) is consistent with the cluster being isothermal out to 45% of the virial radius. The metal abundance of =0.33 and gas mass fraction of 8.6% are consistent with those of local clusters of the same temperature (see below).
This cluster is unique in being at high redshift, yet massive and generally relaxed. It must have been assembled when the age of the Universe was significantly less than 6 Gyr. Further details of the analysis and the cosmological implications are given in Maughan et al.(2003b).

2 A massive cluster in formation at z=0.83
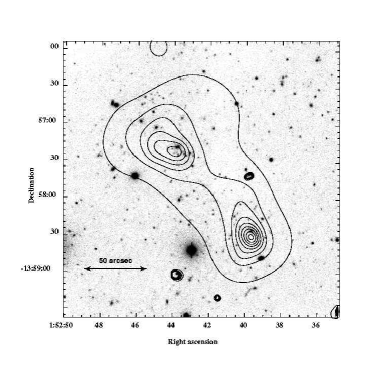
In stark contrast is the highly unrelaxed, massive cluster ClJ0152.7-1357, described in Ebeling et al.(2000), Della Ceca et al.(2000) and Maughan et al.(2003a). The image and a recently acquired deep image are shown in Fig 2. Based on the data, we find that the cluster consists of two major sub-clumps at very similar redshifts and of temperatures 5.5 keV and 5.2 keV. The total mass of each subcluster is (5-6)x1014 . A dynamical analysis of the system shows that the subclusters are likely to be gravitationally bound. When merged, the system mass will be similar to that of the Coma cluster.
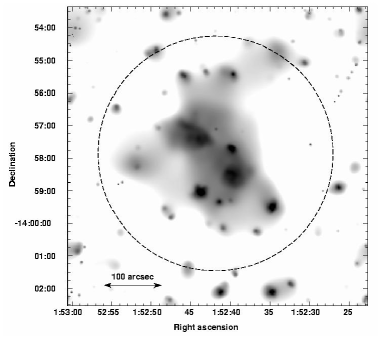
The deeper image shows lower surface brightness features. To the east is a low luminosity system also at the cluster redshift (Demarco et al.2003, in preparation). To the NW is a possible filamentary structure with a point source and one or two low luminosity extended sources, probably groups, embedded within it. This structure falls within a radius of 1.6 Mpc (the dashed circle), the estimated virial radius of the final merged system, suggesting that it is part of the same formation process. The faintest filamentary emission is significant at 5 in the soft 0.3-1 keV band and has a hardness ratio consistent with a temperature of 10.7 keV. We may be observing the warm baryons predicted to lie within filaments, based on simulations of structure formation.
3 Other clusters at z0.6
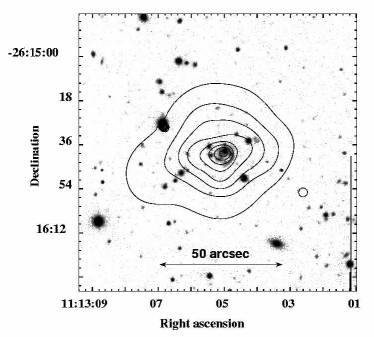
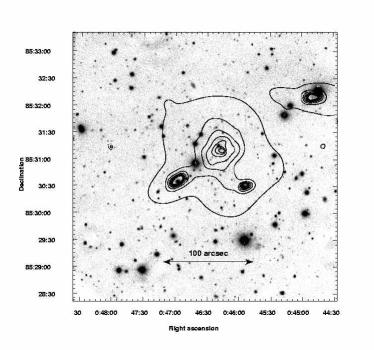
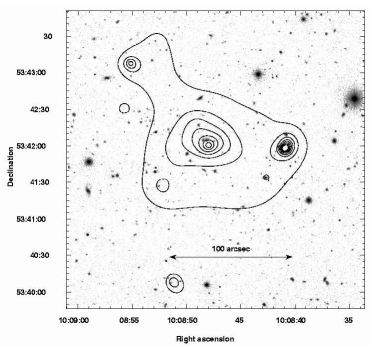
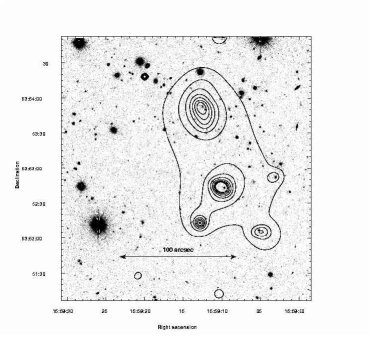
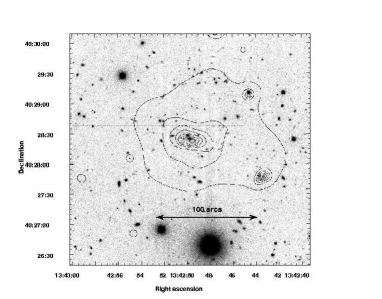
and contours of the remaining 5 clusters are shown in Figs 3, 4 and 5 in order of the most relaxed first. There is a wide range of morphologies, and some (eg ClJ1559) clearly have bright point X-ray sources nearby.
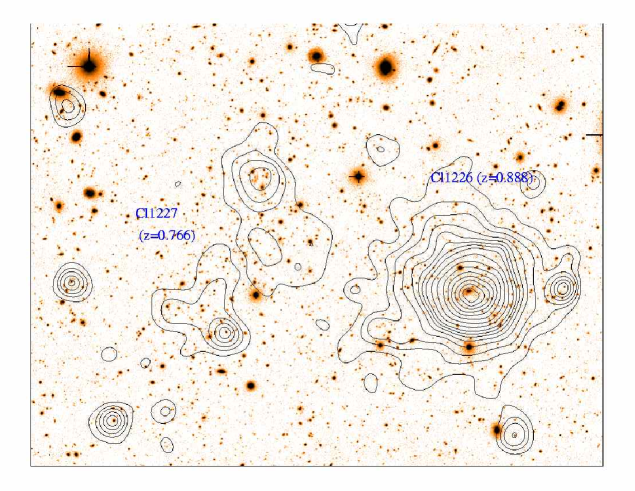
An additional cluster, ClJ1227.3+3333 (z=0.766) is shown in Fig 6. This is an extremely unrelaxed system. Although not in the original sample (it fell below a window support shadow), it is detected in an image and is a factor 12 less luminous than ClJ1226.9+3332. There is no clear optical or X-ray core, but rather a system of 4 X-ray subclumps separated by 0.5 Mpc which are at a very similar redshift. There is a red sequence in the galaxy colours. This is probably a highly non-virialized system seem in formation, yet it is detected in X-rays.
5 Metallicities and gas mass fractions
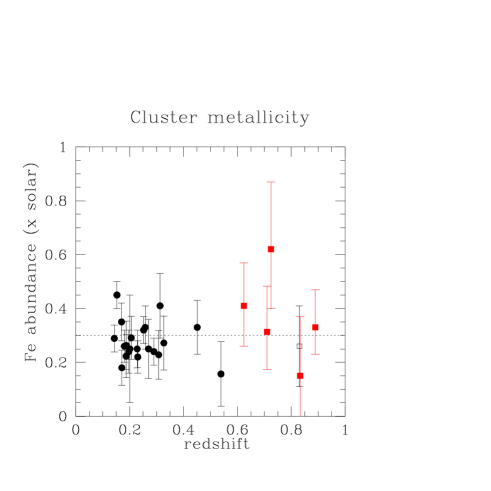
Most of the metals in a cluster are in the X-ray gas, and so the evolution of the metallicity of the gas provides important information on the chemical history of the Universe. In Fig 7 we show that our measurements, and those of others, of cluster metallicities up to z=0.9 are consistent with the canonical value of 0.3 times the solar value found at lower redshifts by Mushotzky & Loewenstein (1997).
The gas mass fractions we measure, within a radius of 0.3 (where they are the most reliable) are consistent with those found by Sanderson et al.(2002) for local clusters of the same temperature. Thus the gas, and the metals it contains, were in place by z0.8 in at least some massive clusters.
6 The evolution of the mass-temperature relation
In Fig 8 we show the mass-temperature relation for those high redshift clusters which appear reasonably relaxed (shown as red squares). The circles are the low redshift data points of Sanderson et al.(2002). In both cases the mass is that measured within the virial radius, , and in both studies is measured from the derived mass profile as the radius within which the density is 200 times the critical density at the redshift of observation. The low and high redshift samples have different treatments of the temperature profile, however. For the high redshift sample we (necessarily) assume isothermality. For the low redshift sample, the temperature profile is measured and thus a more accurate mass is derived.

The upper dashed line shows the best fit to the low redshift points. The lower (red) dashed line shows the expected change in normalisation assuming clusters observed at z=0.8 were formed at z=0.8, using the relation , where . It is interesting to note that all the high redshift clusters except the most massive one are consistent with the low redshift relation, rather than the z=0.8 prediction. It is however the most massive cluster (ClJ1226) which has evidence of isothermality and the most reliable mass. The masses of the other high redshift clusters would need to be reduced by 40% in order to be consistent with the z=0.8 prediction. Sanderson et al.have shown that an incorrect assumption of isothermality when clusters are not isothermal produces, on average, masses which are too high by 30% at . This would explain most of the offset we find. Further work is in progress, and will be reported in future papers, but more accurate masses at high redshifts, based on temperature profiles, may be required before firm conclusions can be reached.
7 Point source contamination of luminosities
The detections were obtained at off-axis angles of up to 15 arcmin, where the PSF degrades to 50 arcsec (FWHM). Thus some point-source contamination is expected in all the cluster surveys. The degree of contamination depends on the signal-to-noise ratio of the detection and the algorithm used for source detection and characterisation.
Based on a preliminary analysis, 2 or 3 out of 9 clusters at z0.6 in the WARPS survey were artificially boosted above the survey flux limit by significant point source contamination. Removing these sources from the sample, and using the updated and fluxes, we recomputed the X-ray luminosity function at 0.61.1. The resultant shifts to lower space densities were within the Poissonian error bars, suggesting that point source contamination can be an important effect for individual measurements, but the previous broad conclusions regarding cluster evolution are unaffected.
8 References
Bode, P., Bahcall, N. A., Ford, E. B., Ostriker, J. P., 2001, ApJ, 551, 15
Cagnoni, I., Elvis, M., Kim, D.-W., Mazzotta, P., Huang, J.-S., Celotti, A., 2001, ApJ, 560, 86
Della Ceca, R., Scaramella, R., Gioia, I.M., Rosati, P., Fiore, F., Squires, G., 2000, A&A, 353, 498
Ebeling, H., Jones, L. R., Perlman, E. S., Scharf, C. A., Horner, D.,
Wegner, G., Malkan, M., Mullis, C.R. 2000, ApJ, 534, 133.
Ebeling, H., Jones, L. R., Fairley, B. W., Perlman, E., Scharf, C.,
Horner, D. 2001, ApJ 548, L23.
Jeltema, T. E., Canizares, C. R., Bautz, M. W., Malm, M. R., Donahue, M., Garmire, G. P., 2001,
ApJ, 562, 124
Jones, L.R., Scharf, C.A., Ebeling, H., Perlman, E., Wegner, G., Malkan, M., Horner, D.,
1998, ApJ, 495, 100
Maughan, B.J., Jones, L.R., Ebeling, H., Perlman, E., Rosati, P., Frye, C., Mullis, C.R.,
2003a, ApJ in press (astro-ph/0301218)
Maughan, B.J., Jones, L.R., Ebeling, H., Scharf C., 2003b, in preparation
Mushotzky, R. F., Loewenstein, M., 1997, ApJ, 481, L63
Perlman, E.S., Horner, D., Jones, L.R., Scharf, C., Ebeling, H., Wegner, G.,
Malkan, M., 2002, ApJS, 140, 265
Scharf, C., Jones, L.R., Ebeling, H., Perlman, E., Wegner, G., Malkan, M., 1997, ApJ, 477, 79
9 Acknowledgements
We acknowledge useful discussions with Stefano Ettori, Gus Evrard, Monique Arnuad & Trevor Ponman.