theDOIsuffix \Volume324 \IssueS1 \CopyrightissueS1 \Month01 \Year2003 \pagespan1 \Receiveddate \Reviseddate \Accepteddate \Dateposted
Review of low-mass X-ray binaries near the Galactic center
Abstract.
Results of observations of several LMXBs in the Galactic center region carried out with the ART-P telescope on board GRANAT observatory are briefly reviewed. More than dozen sources were revealed in this region during five series of observations which were performed with the ART-P telescope in 1990-1992. The investigation of the spectral evolution of persistent emission of two X-ray bursters GX3+1 and KS1731-260, discussion of QPO and spectral variations detected from the very bright Z-source GX5-1 and studying the pulse profile changes of the pulsar GX1+4 were carried out.
keywords:
X-ray astronomy, Galactic center, neutron starspacs Mathematics Subject Classification:
04A251. Introduction
The Galactic Center is one of the most interesting and intensively observing in X-ray region populated by many sources, including dozens of low-mass X-ray binaries. The ability of the telescope ART-P on board observatory GRANAT to investigate simultaneously X-ray emission from several point like sources located within its field of view predetermined the choice of the Galactic center as a favorable target for observations. The total ART-P/GRANAT exposure time of the Galactic center field observations was 830 ks. Such a long exposure allowed to build the detailed X-ray map of this region, to investigate persistent and transient sources emission, to discover four new sources (Pavlinsky et al. 1994). Several years later this region was observed by the telescopes of the BeppoSAX and RXTE observatories (Sidoly et al. 1999, in’t Zand 2001) in approximately the same energy band. Now the INTEGRAL observatory begin to intensively investigate the Galactic center in gamma rays.
In this paper we present briefly results of observations of two X-ray bursters GX3+1 and KS1731-260 carried out with the ART-P/GRANAT telescope in 1990-1992. These objects are regular sources of type I bursts, which are thought to be resulted from thermonuclear flares on the surface of accreting neutron stars. We present here also the preliminary results of spectral and timing investigations of very bright low-mass X-ray binary GX5-1 and X-ray pulsar GX1+4.
[tb]
![[Uncaptioned image]](/html/astro-ph/0304263/assets/x1.png) Galactic center image obtained in the 3-20 keV energy band with the
telescope ART-P in 1990. Contours show the significance of source
detection at the level 3,4,5,10…. and more standard deviations.
Galactic center image obtained in the 3-20 keV energy band with the
telescope ART-P in 1990. Contours show the significance of source
detection at the level 3,4,5,10…. and more standard deviations.
2. Results
The image of the Galactic center field reconstructed on the combination of the ART-P observations carried out in the fall of 1990 is presented in Fig.1. Fifteen point sources were revealed. Most of them were studied in several previous ART-P/GRANAT papers (see for example Pavlinsky et al. 1992, 1994, Grebenev et al. 1995, 1996, Lutovinov et al. 2001, Molkov et al. 2000, 2001 and references there). Below we focus of our attention on the four least studied sources.
2.1. GX3+1
This source was observed with ART-P four times during the GRANAT Galactic center field survey in the fall of 1990 with total exposure more than 60 ksec. The analysis of the data led to one interesting finding – a strong X-ray burst was detected from GX3+1 on 14 Oct. The investigation of the source persistent emission in this day shows that its luminosity was % less than the luminosity measured in the other days and equal in the 3-20 keV energy band. Such behavior is in agreement with results of Makishima et al. (1983). It was only second case after the HAKUCHO observations when GX3+1 was found in the bursting state. Now the number of X-ray bursts detected from GX3+1 increased to 81; a part of these bursts were observed during source high state (den Hartog et al. 2003).
The spectrum of the source measured in the high state is shown in Fig.2. It can be good approximated by the model of comptonization of soft photons on hot electrons of plasma. However obtaining values of parameters indicate that the model may be not physically correct because it does not take into account effects of free-free absorption. Two more suitable models for description of emission from GX3+1 were discussed in Molkov et al. (1999). The power spectrum of GX3+1 is presented in Fig.2 and doesn’t demonstrate any peculiarities.


2.2. KS1731-260
The transient X-ray source KS1731-260 was discovered in 1989 with the telescope TTM on board ROENTGEN observatory and was recognized as a burster (Sunyaev et al. 1990). The source was observed many times with RXTE and BeppoSAX observatories and coherent X-ray oscillations with period ms were discovered during several bursts (Smith et al. 1997). Also a very powerful superburst with duration of several hours was detected from the source (Kuulkers et al. 2002).

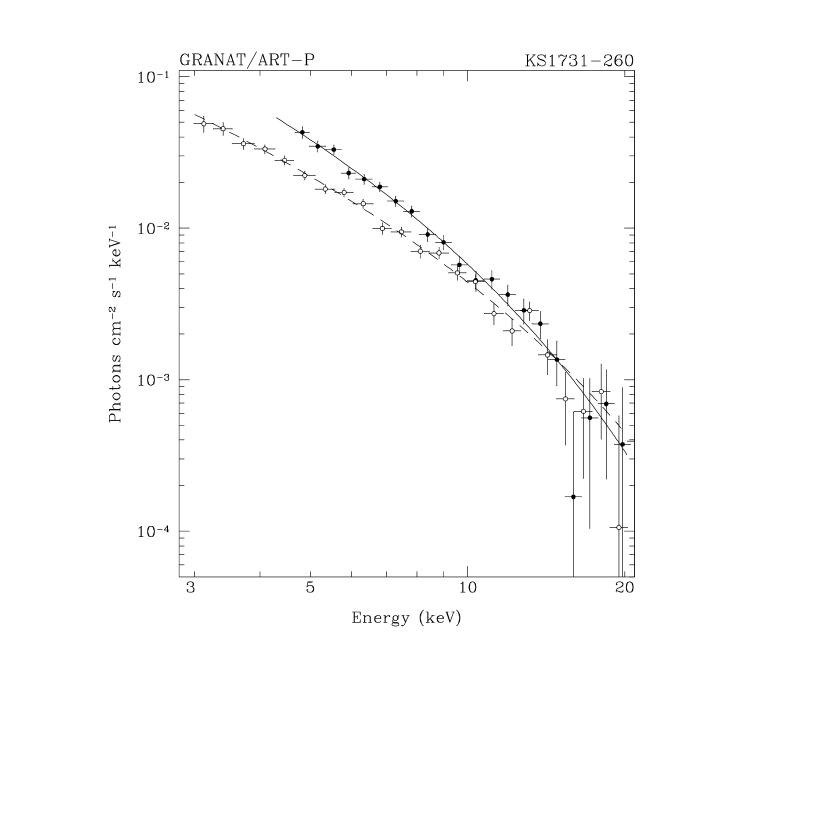
KS1731-260 was observed with the ART-P telescope four times with an interval of one year. Two X-ray bursts with approximately the same time profile were detected from the source (Fig.4). The photon spectra of the source obtained on 23 Aug and 7 Oct 1990 are shown in Fig.4. In both cases the spectra were equally well described by the Sunyaev-Titarchuk comptonization or optically thin thermal bremsstrahlung models, but the source luminosity in the 4-20 keV energy band measured on 7 Oct (when the X-ray burst was detected) was 30% lower that ones in another day. Such correlation between source low state and bursting activity was observed for several other bursters.
The detailed analysis of the KS1731-260 persistent and bursts emissions is in progress.
[t]
![[Uncaptioned image]](/html/astro-ph/0304263/assets/x6.png) a)
a)
![[Uncaptioned image]](/html/astro-ph/0304263/assets/x7.png) b)
Observations of two different types of the
sourse pulse profile (single asymmetric peak and double peak) and their
dependence on the energy.
b)
Observations of two different types of the
sourse pulse profile (single asymmetric peak and double peak) and their
dependence on the energy.
2.3. GX1+4
The hard X-ray pulsar GX1+4 in low-mass binary was observed several times during the GRANAT observatory operations in 1990-1992 (Lutovinov et al. 1994). During the observation on 23 Aug 1990 the source was detected in the soft state where the observed photon spectrum was fitted well by a simple powerlaw with a photon index . The X-ray luminosity in the 3-20 keV range was equal to erg s-1 for a distance of 8.5 kpc.
The X-ray pulsations with period of s were detected from the source with a double peak structure in different energy bands on Oct 7, 1990 (Fig.4a). During observations on Sept 7, 1991 the pulse profile of GX1+4 showed a single broad feature with period s (Fig.4b). This change in the pulse profile from a double to a single pulse structure in about one year indicates either activation of the opposite pole of the neutron star if the magnetic field is asymmetric or possibly a change in the beam pattern from a pencil beam to a fan beam.
2.4. GX5-1
GX5-1 is a second brightest source in X-rays after Sco X-1. It is called Z-source after the approximate “Z” shape describe in an X-ray colour-colour diagram and in an X-ray hardness-intensity diagram (Hasinger, van der Klis 1989). GX5-1 was observed by ART-P many times in 1990-1992 with intensity in the 3-20 keV energy band of Crab. To investigate the source spectral variations we applied to the spectra a few simple models, such as Sunayev-Titarchuk Comptonization of soft photons on hot electrons of plasma, optically thin thermal bremsstrahlung and Boltzmann law. Figure 6 illustrates this issue showing the spectra measured on the autumn of 1990.
We estimated also the power spectra of the source by calculating the Fourier amplitudes of the signal for the all sessions of observations. The QPO with centroid frequency Hz was detected on 20 Oct 1990 (Fig.6). The measured frequency correspond to the typical ’horizontal branch’ QPO (van der Klis 1985).


A.L. thanks to the Organizing Committee and the Space Research Institute of the Russian Academy of Sciences for the providing a financial support of the participation in the Conference.
References
- [1] S. Grebenev et al., Adv. Space Res. 15, (5)115 (1995).
- [2] S. Grebenev et al., in: Proceedings of the 2th INTEGRAL Workshop, ESA SP-382, p.183 (1996).
- [3] P. den Hartog et al., A&A 400, 633 (2003).
- [4] G. Hasinger, M. van der Klis, A&A 225, 79 (1989).
- [5] J. in’t Zand, in: Proceedings of the 4th INTEGRAL Workshop, ESA SP-459, p.463 (2001).
- [6] E. Kuulkers et al., A&A 382, 503 (2002).
- [7] A. Lutovinov et al., Astron. Lett. 20, 538 (1994).
- [8] A. Lutovinov et al., Astron. Lett. 27, 501 (2001).
- [9] K. Makishima et al., Astrophys. J. 267, 310 (1983).
- [10] S. Molkov et al., Astron. Lett. & Comm. 38, 141 (1999).
- [11] S. Molkov et al., A&A 357, L41 (2000).
- [12] S. Molkov et al., Astron. Lett. 27, 363 (2001).
- [13] M. Pavlinsky et al., Sov. Astron. Lett. 18, 88 (1992).
- [14] M. Pavlinsky et al., Astrophys. J. 425, 110 (1994).
- [15] M. Pavlinsky et al., Astron. Lett. 27, 297 (2001).
- [16] L. Sidoly et al., Astrophys. J. 525, 215 (1999).
- [17] D. Smith et al., Astrophys. J. 479, L137 (1997).
- [18] R. Sunyaev et al., Sov. Astron. Lett. 16, 59 (1990).
- [19] M. van der Klis et al., Nature 316, 225 (1985).