The nature and space density of fossil groups of galaxies
Abstract
We describe the properties of a sample of galaxy groups with very unusual distributions of galaxy luminosities. The most extreme example has an X-ray luminosity similar to that of the Virgo cluster but has a very low richness, with only one galaxy brighter than L*, compared with six in Virgo. That one galaxy, however, is optically more luminous than any galaxy in Virgo and has an optical luminosity as bright as many of the central cD galaxies in rich Abell clusters.
The characteristic feature of the fossil groups we study is that most of the light arises from one dominant, central galaxy. We define a fossil system and, based on this definition, construct a small X-ray selected, flux-limited sample of fossil groups with well known selection criteria. We confirm that these systems are indeed groups of galaxies, but dominated by one central luminous giant elliptical galaxy and with few, or no, L* galaxies.
We find that fossil systems represent 8%-20% of all systems of the same X-ray luminosity. Fossil groups are at least as numerous as all poor and rich clusters combined, and are thus a possible site for the formation of luminous central cluster galaxies before infall into clusters occurs. The fossil systems in our sample have significantly higher X-ray luminosities than normal groups of similar total optical luminosities (or similar X-ray temperature, where the latter can be measured). These enhanced X-ray luminosities may be due to relatively cool gas in the innermost regions or due to a low central gas entropy.
We interpret fossil groups as old, undisturbed systems which have avoided infall into clusters, but where galaxy merging of most of the L* galaxies has occurred. An early formation epoch, before that of most groups, could explain low central gas entropies and high X-ray luminosities.
keywords:
galaxies: groups: general - X-rays: galaxies - galaxies: elliptical1 INTRODUCTION
There exist concentrations of dark matter which have the gravitating mass of groups of galaxies, and which contain X-ray emitting hot gas with the extent and other properties expected for groups, but in which the optical light is completely dominated by a single luminous, giant elliptical galaxy. If systems of this type are sufficiently numerous and massive, they may be of considerable importance as the location of the formation of a significant fraction of all giant luminous elliptical galaxies. Initial indications suggest that the total mass density of fossil groups in the Universe is similar to that of rich clusters of galaxies (Vikhlinin et al. 1999).
Our interpretation of fossil groups is that they are the end result of galaxy merging within a normal group, leaving behind the X-ray halo (Ponman et al. 1994, Jones, Ponman & Forbes 2000b; hence the term ‘fossil’ groups). An alternative scenario is that they may have formed with a very unusual galaxy luminosity distribution (Mulchaey & Zabludoff 1999), although we will show that this is a less likely origin. If the merger interpretation is basically correct, the timescales for dynamical friction on L∗ galaxies suggest that fossil groups are old, undisturbed systems that have seen little infall of L∗ galaxies since their initial collapse. Fossil groups are thus an important laboratory for studying the formation and evolution of galaxies and the intra-group medium in an isolated system. They may also be the evolutionary link between compact galaxy groups and giant ellipticals (possibly via a ULIRG phase; Borne et al. 2000). In addition, these systems act as a reminder that not all mass concentrations can be found by optical means; the total mass and spatial extent of fossil groups has only been revealed via X-ray observations.
It is thus important to measure the space density of fossil systems. Several candidate systems have been reported, but the criteria used to define this class of objects vary and the two existing estimates of their space density disagree by a factor of 4 (Vikhlinin et al. 1999, Romer et al. 2000). Vikhlinin et al. (1999) found four potential fossil systems which they considered to be isolated galaxies, calling them X-ray over-luminous elliptical galaxies (OLEGs). Ponman et al. (1994) and Jones et al. (2000b) have studied one of these systems in detail and found that it is in reality a group, with a halo of dwarf galaxies, and a deficit of L∗ galaxies. Mulchaey & Zabludoff (1999) found a similar distribution of galaxy luminosities around an optically selected giant elliptical galaxy with an over-luminous X-ray halo. Matsushita et al. (1998) and Matsushita (2001) may have found similar systems which they call X-ray extended early type galaxies.
In this paper we adopt well-defined selection criteria for fossil groups and measure their space density as a function of X-ray luminosity. We also compare their X-ray luminosities and temperatures with those of other groups and clusters. We assume H0=50h50 Mpc-1 and q0=0.5 throughout.
2 Definition of a fossil system
We define a fossil system in observational terms as a spatially extended X-ray source with an X-ray luminosity from diffuse, hot gas of h50-2 . The optical counterpart is a bound system of galaxies with m122.0 mag, where m12 is the absolute total magnitude gap in R between the brightest and second brightest galaxies in the system within half the (projected) virial radius (rvir). No upper limit is placed on the X-ray luminosity or temperature.
The rationale behind this choice of definition is as follows. The lower limit in X-ray luminosity applied by us excludes normal galaxies. O’Sullivan, Forbes & Ponman (2001) find very few elliptical galaxies with higher X-ray luminosities that are not at the centres of groups, and thus may have a contribution to their measured from the hot gas of the group (see also Matsushita 2001). The limit in m12 ensures that the brightest galaxy dominates the system. We use half the virial radius because this corresponds approximately to the radius within which orbital decay by dynamical friction (Binney & Tremaine 1987) predicts that M∗ galaxies (with mass/light ratio = 10/L⊙) will fall to the centre of the system within a Hubble time. The precise value of the threshold in m12 is somewhat arbitrary, but we show in Section 5.3 that the probability of obtaining m122 by chance from a typical Schechter function is very small. Observationally, it is also unusual to find groups or clusters of galaxies with m122. For example, of the 24 optically selected poor clusters of Price et al. (1991), the highest value of m12 is 1.3. Similarly, of the 20 MKW (Morgan et al. 1975) and AWM (Albert et al. 1977) poor clusters of Beers et al. (1995), the highest value of m12 is 1.6. The MKW/AWM clusters were selected to contain a dominant giant elliptical galaxy, and thus if anything should have larger values of m12 than randomly selected clusters. The MKW/AWM clusters also cover the range of X-ray luminosity of the fossil systems studied here.
3 Initial sample selection
To search for fossil groups we used our existing X-ray selected sample of spatially extended, serendipitous X-ray sources compiled during the WARPS project (Wide Angle Pointed Survey; Scharf et al. 1997, Jones et al. 1998, Perlman et al. 2002). This flux limited survey contains 150 extended X-ray sources, from nearby individual galaxies to clusters of galaxies at high redshifts (Ebeling et al. 2000, 2001), all detected in the central regions of PSPC (Position Sensitive Proportional Counter) pointings at high Galactic latitudes (b), in the 0.5-2 keV energy band. Because of the crucial need to be able to identify sources as extended, only the inner region of 15 arcmin radius of the detector was used. The variation in the full width at half maximum (FWHM) of the instrumental point spread function (PSF) was thus restricted from values of 25′′ on-axis to a maximum of 45′′ at the largest radius. Most of the targets of these pointings were either Galactic objects or AGN. In order to maximise the available sky area, we have used all 86 fields in phase one of WARPS (as described in Jones et al. 1998 and Perlman et al. 2002), including five fields which had clusters of galaxies as targets, combined with the much larger number of 303 fields from phase two of WARPS. The total area of sky surveyed was 73 deg2.
Source detection and characterisation was based on the Voronoi Tesselation and Percolation technique (Ebeling & Wiedenmann 1993) and is described by Scharf et al. (1997). The number of counts in each detection varies between 60-160 (0.5-2 keV), except for RXJ1416.4+2315 which was detected with 800 counts. To extrapolate from the detected count rate to a total count rate, allowing for the undetected flux below the limiting X-ray isophote, we assumed a King profile with =2/3, a core radius estimated from the PSPC data, and extrapolated to infinite radius (extrapolating to the virial radius would give count rates only 10% lower). The resulting mean increase in the count rate for the confirmed fossil systems described below was 53%. If 0.5, as found for many groups (Helsdon & Ponman 2000), then the luminosities would be slightly higher (a correction factor 2, rather than 1.5). The conversion from total PSPC count rate to flux in the 0.5-2 keV band included a small correction for Galactic absorption in the direction of each source and used a temperature estimated from an empirical relation (Perlman et al. 2002). The dependence of the flux on the precise value of this temperature was small (6%; Jones et al. 1998). We employ a limit of 5.5 (0.5-2 keV) in total flux, slightly lower than in the full WARPS catalogue, to maximise the volume surveyed for the relatively rare fossil systems of galaxies.
To derive a list of candidate fossil systems, all X-ray sources flagged as extended or possibly extended (see Scharf et al. 1997) were investigated using a combination of methods. This work started whilst spectroscopic identification of extended sources in the full WARPS catalogue was not yet complete, and so an initial method was devised to help identify fossil candidates, for which spectroscopic identifications have subsequently been obtained. The virtually complete spectroscopic identification of the full WARPS sample, using methods described in Jones et al. (1998) and Perlman et al. (2002), has since been used to confirm and update the list of candidate fossil systems.
The initial method combined visual examination of X-ray/optical overlays of all the sources, guided additionally by HRI data of higher resolution where available, optical spectroscopic identifications, R-band CCD images, identifications in NED, and the ratio of X-ray to optical flux. This search used POSS I & II Digitised Sky Survey data, plus deeper R-band CCD images for the majority of the extended sources. The ratio of X-ray to optical flux helped to distinguish cases where close point X-ray sources (typically AGN) were blended together, masquerading as an extended source. Particular attention was paid to sources with log(, where is the 0.5-2 keV X-ray flux (in ) and
| (1) |
(Allen 1973), where the R magnitude is that of the counterpart of the X-ray source, or of the brightest galaxy in the system for clusters and groups of galaxies. Most AGN and normal clusters had log(, whereas fossil systems had lower values of log(). Where X-ray emission from both a hot inter-group medium (IGM) and an AGN in the group was observed, an estimate of the IGM flux alone was made. Initially APM POSS E magnitude estimates (Irwin, Maddox & McMahon 1994), accurate to 0.25 mag, were used instead of true R-band magnitudes. For very bright galaxies, the APM magnitudes were sometimes underestimated (ie brighter than in reality), but since this decreased and increased m12, it only increased the number of candidates.
We emphasise that the selection of the final list of 18 candidate fossil systems selected for further scrutiny was based on a variety of indicators: optical spectroscopy and classification of the system in the full WARPS survey, but also the visual appearance (is the system dominated by a single galaxy?) and the value. We have thus been conservative in our selection of candidate systems, and it is unlikely that we have missed a significant number, particularly at low redshifts (the completeness of our sample is discussed further in Section 4.2).
3.1 Further observations and analysis of the candidate systems
Although one to three redshifts of member galaxies were obtained as part of the WARPS survey, more redshifts were required for many systems where further galaxies within m12=2.0 mag of the brightest galaxy were located within projected radii rvir. It was necessary to know if these galaxies were group members or not, in order to determine if the systems met our definition of a fossil system. Redshifts were obtained with the RC spectrograph at the Kitt Peak 4m telescope, using a resolution of 7. Data reduction followed standard procedures using . Further details of the imaging and spectroscopic observations will be given elsewhere.
CCD imaging of the most promising candidates, to R=24, was obtained in service time with the 2.5m Isaac Newton Telescope (INT) wide-field camera to supplement existing, shallower images obtained as part of the WARPS survey. Data reduction was again performed in the standard way, including a correction for the small non-linearity of the CCDs. Unfortunately the conditions were not photometric, and so further R-band imaging was obtained, in photometric conditions, to calibrate the original images. For two systems (J1416.4+2315 and J1552.2+2013) this further imaging was obtained with the 8k mosaic camera at the University of Hawaii 2.2m telescope. For the other systems the calibration images were obtained in additional INT wide field camera service time. All photometric calibration was based on observations of 5-12 standard stars per night selected from Landolt (1992). The resultant photometric accuracy for all the systems is 0.05 mag.
Accurate m12 values for the candidate fossil systems were measured from the R-band CCD images. For each galaxy, an aperture containing of the total light, as judged from the curve of growth, was used to measure a pseudo-total magnitude. Absolute magnitudes of the central galaxies were corrected for Galactic absorption and were K-corrected. No K-corrections were applied in deriving m12, since the corrections are small (0.1 mag) at the redshifts sampled, and in any case all of the brightest galaxies, and most of the second brightest galaxies, are of an early type and would have identical K-corrections.
The virial radii were estimated using the relationship between virial radius and X-ray temperature rvir=r200=3.89 (T/10 keV)0.5(1+z)-1.5 h Mpc (Evrard et al. 1996). For most systems, there were too few PSPC counts to reliably measure a temperature, and for these a temperature estimate was made based on the luminosity-temperature (LX-T) relations of White et al. (1997) and Helsdon & Ponman (2000). The virial radii estimated in this way varied between 0.94-1.45 h Mpc. We show below that at least some fossil systems lie on the low-temperature side of the the LX-T relation, so that our estimates of both temperature and virial radius for systems without reliable temperature measurements may be overestimates. Reducing the virial radii, and thus the sky area where m12 is measured, can only increase m12 and reinforce the fossil nature of the systems. For one system (RXJ1416.4+2315) there were sufficient PSPC counts to measure a temperature, as described by Fairley et al. (2000). Absorption was fixed at the Galactic value, and abundances fixed at 0.3 x solar. The best fit MEKAL (Mewe et al. 1986) temperature was 1.53 keV (at 90% confidence).
Radial profiles of the X-ray surface brightness as observed with the PSPC (and HRI where available) were compared to the appropriate PSFs, and only genuinely extended X-ray sources were accepted as fossil systems.
After combining the new redshift information, photometry, and virial radius estimates, 5 new fossil systems were identified which meet the definition given in Section 2 (diffuse, hot gas of luminosity h50-2 , and m122.0 mag within 0.5rvir). Twelve candidates were ruled out, and one candidate remains, awaiting further spectroscopy.
4 Results
4.1 The fossil systems
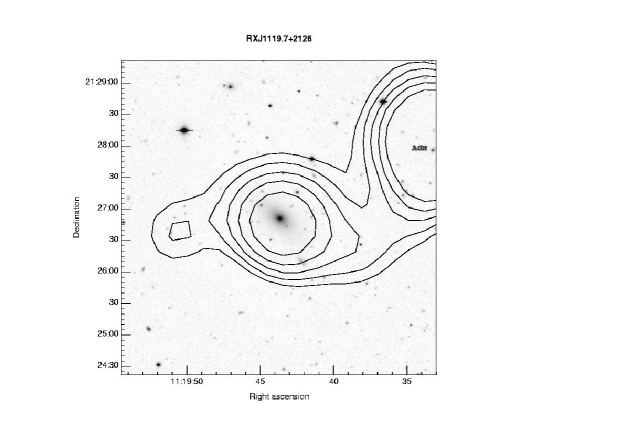
The five new fossil systems are shown in Fig 1. Their basic properties, together with those of the one remaining candidate system, are given in Table 1. Here we provide brief descriptions; the results of detailed observations will be reported elsewhere. The system RXJ1340.6+4018, described by Jones et al. (2000b), meets the fossil group definition used here, but it is not included in the present statistical sample because the exposure time of the PSPC observation in which it was discovered was below the threshold used in the WARPS survey.
![[Uncaptioned image]](/html/astro-ph/0304257/assets/x2.png)
![[Uncaptioned image]](/html/astro-ph/0304257/assets/x3.png)
![[Uncaptioned image]](/html/astro-ph/0304257/assets/x4.png)
![[Uncaptioned image]](/html/astro-ph/0304257/assets/x5.png)
RXJ1119.7+2126. This is the lowest-luminosity fossil group in the sample. Optically, the group is completely dominated by a giant elliptical galaxy at a position coincident with the peak of the X-ray emission. This galaxy has MR=-22.8 + 5logh50 and is visible to a semi-major axis distance of 70 h kpc in our deep CCD image. At least two nearby galaxies, 3.3-3.4 mag fainter, are spectroscopically confirmed group members, and there is an excess of faint galaxies visible within the X-ray contours. The PSPC data within a radius of 1 arcmin of the peak emission are clearly extended. The quoted X-ray luminosity arises only from the source centred on the bright elliptical galaxy, and excludes the nearby point X-ray sources visible in Fig 1 (one of which is labelled and is an AGN at z=0.282; Mason et al. 2000). We find that m12 is definitely greater than two and lies in the range 2.5-3.3, depending on the group membership of one particular galaxy. This source is also identified as a cluster/group of galaxies in the RIXOS (Mason et al. 2000) and Vikhlinin et al. (1998) surveys. Mason et al. (2000) and Tripp et al. (1998) confirm the redshift; Vikhlinin et al. had no spectroscopic redshift.
RXJ1256.0+2556. The emission seen in the PSPC data extends to a radius of 2 arcmin and is clearly extended. Optically this source is a rich group of galaxies, dominated by a luminous (MR=-24.8 + 5logh50) elliptical galaxy, with fainter galaxies observed in projection against it. The offset of 15′′of the peak of the X-ray emission compared to the brightest galaxy is not significant given the positional uncertainty of 10′′of the ROSAT attitude solution. The classification as a fossil system is somewhat uncertain because m12 may be either 1.6 or 2.0, depending on whether a group galaxy at a radius within, but close to, 0.5rvir is included. The value of the virial radius is uncertain since the X-ray temperature is unknown. For the purposes of this paper we include this system, but note that it contains at least 1-2 L∗ galaxies at a radius 0.5rvir. All nearby point-like X-ray sources visible in Fig 1 are excluded from the quoted luminosity. This X-ray source is also identified as a cluster/group of galaxies in the Vikhlinin et al. (1998) survey, but without a spectroscopic redshift.
RXJ1331.5+1108. The X-ray luminosity of diffuse, hot gas in this source is slightly uncertain because of the possibility of point source contamination, but it is almost certainly above 1042 . Optically it is a fossil group: we have 3 spectroscopically confirmed group members and m12=2.0 mag. The source is only marginally extended in the PSPC. However, two HRI observations, both with sufficient sensitivity to detect a point X-ray source with the PSPC flux at the position of the central galaxy, fail to do so. The required variability of more than a factor of 2 on a timescale of 1 month is not unlikely for an AGN. However, the summed HRI observations do reveal faint diffuse emission (possibly including a very faint point source) over a 1 arcmin2 region adjacent to the central galaxy. This faint HRI emission has a flux 50% of the total PSPC flux.
The central galaxy, at the X-ray peak, has narrow H and [SII] emission lines. An unresolved (r2′′) 12.60.6 mJy radio source at 1.4 GHz is coincident with the central galaxy (from the FIRST survey; White et al. 1997). This flux corresponds to a a power of erg s-1 Hz-1 at 1.4 GHz, similar to that of the first fossil system found by Ponman et al. (1994) and Jones et al. (2000b), and comparable to values found for radio-loud cD galaxies in cluster cores. These cluster radio sources are often associated with cooling flows, and the emission line spectrum may also be associated with a cooling flow. In the RIXOS survey, based only on PSPC data and one galaxy redshift, Mason et al. (2000) classify this source as a Sy2/liner. With the additional data discussed here, we classify the source as a probable combination of fossil group and AGN, with the X-ray luminosity of each component remaining uncertain.
RXJ1416.4+2315. This is the most X-ray luminous source in the sample. In a deep optical image it would be classified as a galaxy group or poor cluster centred on an extremely dominant, luminous, giant elliptical galaxy. This remarkable galaxy has MR=-25 + 5logh50 and is visible to a semi-major axis length of 160 h kpc. The very extended X-ray emission is detected to a semi-major axis length of 3.5 arcmin (650 h kpc) in the PSPC and is elongated in a direction similar to that of the central elliptical galaxy.
A radio source of flux 3.40.2 mJy at 1.4 GHz is coincident with the central galaxy. The radio source is extended on a scale of 4 arcsec (White et al. 1997).
This source appears in the bright SHARC cluster survey of Romer et al. (2000). The redshift is confirmed, but it is not identified as a fossil system by Romer et al. . There is a small (10%) amount of contamination from a background QSO (HS 1414+2330 at z=1.54, Hagen et al. 1999) in the PSPC image, which we have not removed. The target of this field was a candidate cluster of galaxies, but at a high redshift (z0.3), and unrelated to the fossil system.
RXJ1552.2+2013. The second most X-ray luminous system in the sample, this clearly extended X-ray source has the optical appearance of a galaxy group, again dominated by a giant luminous elliptical galaxy at the X-ray peak.
The bright X-ray point source 2.5 arcmin west of RXJ1552.2+2013 is a background QSO at z=0.25. The X-ray flux from this QSO does not contribute to the luminosity given in Table 1, but a small amount of contamination (%) from a probable AGN in the group approximately 1 arcmin W of the central galaxy is included in the quoted luminosity. No point-like X-ray sources are detected within the PSPC contours in an HRI exposure with sufficient sensitivity to detect any point sources with 15% of the total PSPC flux.
This source is identified as a group/cluster of galaxies in the survey of Vikhlinin et al. (1998), who confirm the redshift, and as an extended X-ray source, but below the count rate limit, in the survey of Romer et al. (2000).
The final system described here is the remaining candidate.
RXJ0116.6-0329.
Although this is a clearly extended PSPC source identified with a
group of galaxies with two spectroscopically confirmed redshifts, the
value of m12 is very uncertain. There are 3-4 bright galaxies at a
radius of approximately 0.25rvir with unknown redshifts. If any
one of these is a group member, then m122.0, and this would not be
a fossil system as defined here. Thus we exclude this source from
further discussion.
| Name | RA (J2000) | Dec | z | nz | m12 | fX(0.5-2 keV) | LX (1042 h50-2 | TX | M | |
|---|---|---|---|---|---|---|---|---|---|---|
| (mag) | (10-13 | ) | (keV) | (+5log(h50)) | ||||||
| (a) | (b) | ) | (0.5-2 keV) | (bol) | ||||||
| RXJ1119.7+2126 | 11 19 43.7 | +21 26 50 | 0.061 | 3 | 3.3c | 0.57 | 1.0 | 1.7 | - | -22.8 |
| RXJ1256.0+2556 | 12 56 03.4 | +25 56 48 | 0.232 | 3 | 2.5c | 1.06 | 26. | 61. | - | -24.8 |
| RXJ1331.5+1108 | 13 31 30.2 | +11 08 04 | 0.081 | 3 | 2.0 | 1.07 | 3.2d | 5.9d | - | -23.6 |
| RXJ1416.4+2315 | 14 16 26.9 | +23 15 32 | 0.137 | 6 | 2.4 | 12.5 | 103. | 220. | 1.53 | -25.0 |
| RXJ1552.2+2013 | 15 52 12.5 | +20 13 32 | 0.135 | 4 | 2.3 | 3.32 | 27. | 63. | - | -24.7 |
| RXJ0116.6-0329f | 01 16 40.2 | -03 29 57 | 0.081 | 2 | ? | 2.90 | 8.3 | 17. | - | -23.8 |
(a) Number of spectroscopically confirmed member galaxies
(b) Magnitude gap in R between the brightest and second brightest
galaxy members within a projected radius of 0.5rvirial.
(c) m12 uncertain. See text for details.
(d) May be an overestimate due to a contribution from an AGN.
(e) 90% confidence limits
(f) Unconfirmed, unlikely to be a fossil system; m12 unknown.
4.2 Selection effects and completeness
Although our definition of a fossil system placed no upper limit on the X-ray luminosity, and thus in principle very luminous fossil clusters of galaxies, as well as groups, were detectable, in practice some selection effects were at work. In a survey with a single flux limit, the most luminous sources are found at moderate to high redshifts, where the search volume is largest. However, at the highest redshifts the depth of some of the imaging and spectroscopic follow-up was insufficient to reject galaxies with m12=2.0 mag as non-cluster members. Combined with the increase in numbers of projected foreground and background galaxies with redshift, this meant that a reliable sample of high-redshift fossil systems, as defined here, was impractical. We set a conservative maximum redshift of z=0.25 within which this survey should be reasonably complete since the spectroscopy is deep enough to reliably identify fossil systems; indeed the highest redshift fossil system found is at z=0.232.
The survey flux limit implies that fossil candidates with L (0.5-2 keV) will be included in the sample only at low redshifts z0.06. Systems of L will be included at all redshifts up to the limit of z=0.25. Relatively few high-luminosity ( ) systems were detected in WARPS at z0.25 (because of the relatively small volume at these redshifts), so it is not surprising that no very luminous fossil clusters are in the sample, if they exist at all.
To check if any incompleteness can be found, we make a direct comparison with the two surveys in which systems similar to our fossil groups were identified, also based on serendipitous detections (Vikhlinin et al. 1999; Romer et al. 2000). Unfortunately, there is little overlap. Of the four systems indentified by Vikhlinin et al. , only one is in a field which is also contained in the WARPS survey, but it falls just outside our maximum radius of 15 arcmin and thus was not considered in the survey. Similarly, of the three fossil systems identified by Romer et al. 2000, only one is in a field which overlaps with this survey, but again it is outside our maximum radius of 15 arcmin.
Four of the fossil groups found here are in fields used in the Vikhlinin et al. (1998) survey, which was the basis of the Vikhlinin et al. (1999) overluminous elliptical galaxy (OLEG) sample, but none are included in that OLEG sample. The X-ray luminosities of two fossil groups are lower than the limit applied by Vikhlinin et al. (1999), explaining their absence. The other two missing systems may be explained by the different selection criteria applied by Vikhlinin et al. (1999). One of them (RXJ1552.2+2013) does not appear to be a fossil group until redshifts of nearby bright galaxies reveal that they are in the foreground, perhaps explaining its absence, and the other (RXJ1331.5+1108) may be contaminated by an X-ray point source, as already noted.
4.3 The space density of fossil groups
The space density was estimated using the statistic of Avni & Bahcall (1980). The survey volume within z=0.25 was calculated as a function of luminosity using the sky area available at any given total flux, including the X-ray K-corrections of Jones et al. (1998). The sky area was calculated using simulated cluster profiles and the distribution of PSPC exposure times and background levels in the survey, as described in Scharf et al. (1997). In fact three of the five fossil groups have sufficiently high fluxes to be detectable in almost all the survey fields, so that the details of the area calculation are unimportant for these three.
The integrated space densities we find at different limiting luminosities, as well as those of previous studies, are given in Table 2. Given the small number statistics, these values are in reasonable agreement with the Vikhlinin et al. (1999) space density extrapolated to lower luminosities. The Romer et al. (2000) space density is, however, noticeably higher than the other two estimates.
An estimate of the differential X-ray luminosity function is shown in Fig 2. Although the small sample size has required a large bin size in luminosity to be used (1 decade in LX), it is clear that fossil groups are more numerous than Hickson Compact Groups (HCGs) and, by definition, are less numerous than all clusters and groups at a similar LX combined.
| a (1042 h50-2 | Nfoss(b) | Reference(c) | |
| , 0.5-2 keV) | h503 Mpc-3 | ||
| 1 | 5 | 4 | this work |
| 10 | 3 | 2 | this work |
| 20 | 4 | 2.4 (d) | V99 |
| 10(e) | 4 | 4.6 (d) | V99 |
| 10 | 3 | R00 |
(a) Limiting X-ray luminosity
(b) Number of fossil systems
(c) V99: Vikhlinin et al. (1999), R00: Romer et al. (2000)
(d) 90% confidence limits quoted by Vikhlinin et al. (1999)
(e) extrapolated from to
assuming the same slope as the cluster X-ray luminosity
function.

4.4 The LX-T relation
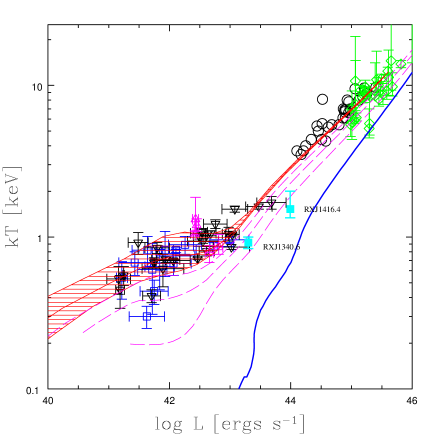
Only one of the systems described here has sufficient counts to measure a temperature. This system has an excess X-ray luminosity for its temperature, as also found for the fossil group RXJ1340.6+4018 (Jones et al. 2000b). In Fig 3 we plot both these fossil systems on the low-redshift X-ray luminosity-temperature relation for groups and clusters obtained from a variety of sources. Both fossil systems have the highest X-ray luminosity of all the systems in the plot at that temperature. Most groups are underluminous compared to an extrapolation of the cluster relation, whereas the opposite is true for these two fossil groups. The luminosities of all the low temperature systems in Fig 3 have been extrapolated to the virial radius.
It remains to be seen whether all fossil systems are overluminous. Vikhlinin et al. (1999) find that one OLEG is consistent with the group relation. It is possible that there is a selection effect in our sample in the sense that we were only able to measure temperatures for the most luminous systems, because they gave the highest-quality spectra. However, the positions of these fossil groups on the relation are clearly extreme compared to a sizeable sample of other groups.
4.5 The LX-Lopt relation
In Fig 4 we plot the bolometric X-ray luminosities of the fossil groups against the total optical luminosities of the central galaxies (filled circles). There is a strong correlation (correlation coefficient 0.978, corresponding to a probability of no correlation of 10-7). The best-fit relation for the fossils is log=(2.290.24)log + (0.550.14) + 2.58logh50, where is the bolometric X-ray luminosity in units of 1042 erg s-1, and is the R-band optical luminosity in units of 1011 L⊙. The correlation implies a link between the X-ray properties of the group and the central galaxy properties, and is discussed further in Section 5.3.
A comparison with a similar relationship found for a sample of X-ray bright groups by Helsdon & Ponman (2003), and plotted as crosses in Fig 4, is revealing. The fossil groups have much higher X-ray luminosities than the Helsdon & Ponman groups for their optical luminosities, but a consistent slope; Helsdon & Ponman find a slope of 2.70.4. A key difference between the datasets is that the Helsdon & Ponman points are for the total optical luminosity of the group, rather than of just the brightest galaxy. A second difference is that the values for the fossil groups have been extrapolated beyond the detection radius, whereas the Helsdon & Ponman values have not. The arrows on the plot indicate the likely typical corrections for these differences. Even assuming an overestimate of a factor of 2 for the average increase in the X-ray luminosities of the normal groups (Helsdon & Ponman 2000), and increasing the fossil group central galaxy optical luminosities by a factor of 1.5 to obtain total group luminosities (as found by Jones et al. 2000b), the fossil group X-ray luminosities are still significantly higher, by a factor of 5.

4.6 cD halos?
We have investigated whether the luminous central galaxies have the extended envelopes of cD galaxies. A de Vaucouleurs r1/4 profile is a good fit to the surface-brightness profiles of all of the central galaxies out to the largest radii at which they are detected (corresponding to mag arcsec-2). No excess above this profile at 25 mag arcsec-2, characteristic of cD galaxies, is observed.
Residual images, after subtraction of the best fit elliptical models, show no morphological signs of merger activity (eg. shells or tidal tails), suggesting that the last major merger probably occurred several Gyr ago.
5 Discussion
We have used well defined selection criteria to construct a sample of fossil groups of galaxies based on a flux limited, complete survey of extended X-ray sources. The presence of hot gas suggests that the systems are gravitationally bound. The constraints we have applied are that 1042 (to avoid individual galaxies) and m122.0 mag, to ensure the presence of a dominant brightest galaxy. What general properties do we observe?
Firstly, m12 is not infinite; we have spectroscopically confirmed group members at fainter magnitudes to show that these are indeed systems of galaxies. Secondly, all the brightest galaxies are giant ellipticals and are located at, or consistent with, the X-ray centroids. Thirdly, the central galaxies are all optically luminous, with total luminosities similar to the brightest galaxies in clusters. NCG1275 in the Perseus cluster has a relatively small cD envelope and has , fainter than the most luminous fossil group galaxy studied here, which has an absolute magnitude () similar to that of central cluster galaxies in rich clusters (eg. Dressler 1978). In addition, the brightest galaxies in the poor AWM & MKW clusters have a similar range of optical luminosities as the central fossil galaxies (Thuan & Romanishin 1981). A high luminosity of the brightest galaxy was not a selection criterion; only a large luminosity gap was required. Finally, we note that although (by definition) there are no L∗ galaxies at r0.5rvir, at larger radii there are L∗ confirmed group members in at least some systems.
We interpret fossil groups as old, undisturbed systems in which the L∗ galaxies within have merged to form the luminous central elliptical galaxy observed today. The age, derived from the timescale for dynamical friction to cause L∗ galaxies to spiral in toward the group centre, is 4 Gyr (Jones et al. 2000b).
5.1 How numerous are fossil groups compared to BCGs?
Fossil systems represent 8%-20% of all systems of the same X-ray luminosity (at and at ), based on a comparison with the integrated local XLF of Ebeling et al. (1997). These fractions are also consistent with the cluster numbers within the WARPS survey. Based on a comparison with the integrated XLF of HCGs of Ponman et al. (1996), fossil groups are 2-4 times more numerous than Hickson groups.
Could fossil groups be the site of formation of a large fraction of BCGs, before infall of the fossil groups into clusters? Each fossil system certainly contains a giant elliptical galaxy of an optical luminosity similar to that of BCGs. There are also easily enough fossil systems. Fossil groups are at least as numerous as all typical and rich clusters combined. Even if only the most luminous fossil systems of are considered, their space density is the same as all clusters with (0.5-2 keV) ie. 0.2, and corresponding to 3 keV or M . Including low-luminosity fossil systems (of ) gives a space density 10 times that of these clusters.
Groups were suggested as the site of galaxy merging which forms bright cluster ellipticals by Aarseth & Fall (1980). This process is also assumed to occur in the semi-analytical galaxy formation models of eg. Kauffmann, White & Guiderdoni (1993).
Is the space density of the fossil groups consistent with them being the origin of cluster BCGs? We assume that both the fossil groups and the BCGs have a common origin. In keeping with our assertion that fossil groups are old, undisturbed groups in which dynamical friction has resulted in the merging of most of the L∗ galaxies, we associate the present-day fossil groups/BGCs with 1013-1014 systems that “formed” at z and which have essentially evolved relatively quietly for most of the duration towards the present. Noting that the notion of “formation time” is ambiguous, we follow Balogh et al. (1999) and define it as the epoch at which 70-75% of the system’s final mass is assembled within a single halo. This definition ensures that post formation, the systems will typically evolve in a dynamically quiet manner. Numerical simulation studies (see, for example, Navarro, Frenk & White 1995) indicate that once 70-75% of a system’s mass is assembled, the rest of the mass generally accretes via minor merger events that have no significant impact on structure of the halo. Using the Extended Press-Schecter (EPS) formalism (Lacey & Cole 1993), we find that bulk of the systems present at z1 will have formed at 1z1.5 (ie. in the previous 1 Gyr). Not all of these systems will evolve into fossil groups/BCGs. We focus in on those systems that enjoy a quiet evolution from =1-1.5 to =0.3, that is for at least 4 Gyrs, so that dynamical friction has enough time to act. The comoving number density of such systems is n(z=0.3) 8x10⁻⁶h503Mpc-3. Of these, we identify as fossil groups those that continue their quiet existence to the epoch of observation. At z=0.1, the comoving number density of such systems is n(z=0.1)3x10⁻⁶h503Mpc-3, which is comparable to our estimate of the number density of fossil groups (4x10⁻⁶h503Mpc-3). According to the EPS formalism, 8% of the fossil groups present at z=0.3 are destined to fall into clusters (of mass 1014 ) by z=0. We identify these systems as BCGs and their corresponding predicted comoving number density is 6.4x10⁻⁷h50 3 Mpc-3. The observed number density of BCGs can be estimated from the cluster number density. The current number density of clusters of mass 1014 (or 2 keV) is 1.6x10⁻⁶h503Mpc-3 (Henry 2000), of which 35-80% have dominant central galaxies (depending on the definition used, Jones & Forman 1984). Thus the density of BCGs is (6-13)x10-7h503Mpc-3, which is in good agreement with the prediction. The concordance between the various predicted and observed number densities is tantalizing and we are preparing a much more detailed theoretical analyses of the hypothesized association between fossil groups and BCGs using both numerical simulations and the merger tree/analytic dynamical evolution formalism of Taylor & Babul (2001).
In this scenario, the cD halo often found around BCGs would be added after infall. It could arise from stars stripped from galaxies within the cluster environment (eg. Lopez-Cruz et al. 1997). Speeding cDs (eg. Zabludoff et al. 1993) could be explained by fossil group infall.
Ghigna et al. (2000) have performed a high-resolution simulation of a cluster of mass similar to that of the Virgo cluster within a cold dark matter Universe, and thus including infall from its surroundings. The core of the dark matter halo corresponding to the central galaxy is largely assembled at high redshift (z=1-3) from the merger and accretion of 12 halos with masses corresponding approximately to L* galaxies (v km s-1). The mergers of these halos occur before the formation of the cluster.
5.2 Excess X-ray luminosities
Possible explanations for the excess X-ray luminosities in Figs 3 & 4 include:
(a) Point source contamination. The PSPC resolution of 30″ is insufficient to resolve all but the brightest point sources. In the systems with the largest angular extent, the contribution from AGN (either in the central galaxy, or in the background), can be limited to 10-20%. Thus for the two systems which are measured to be overluminous for their temperatures (RXJ1416.4+2315 and RXJ1340.6+4018), point source contamination is unlikely to be responsible. For some other fossil groups, such as RXJ1331.5+1108, the point source contribution may be significant.
(b) Cooler central gas. If the groups are undisturbed and old, gas in the innermost region may be cooling, increasing the X-ray luminosity and lowering the mean temperature. Individual systems can be offset from the relation because of a large cool gas contribution. Jones et al. (2000b) found a short cooling time of 1Gyr at arcsec in RXJ1340.6+4018, and Vikhlinin et al. (1999) found evidence for cool gas in 1159+5531. The cool gas contributions to the total X-ray luminosities are unknown, but by analogy with clusters, they are unlikely to account for the factor 5 increase in seen in Fig 4.
(c) A low central entropy. The value of the gas entropy at in low temperature groups has been found to have an approximately constant value from group to group (the ‘entropy floor’ of Ponman et al. 1999 and Lloyd-Davies et al. 2000). Here the entropy is defined as . The ‘entropy floor’ can be explained by energy injection in addition to the compression and shock heating caused by the dark matter gravitational potential (eg. Kaiser 1991, Evrard & Henry 1991). The origin and epoch of the energy injection is unknown, but may be related to supernova galaxy winds or AGN jets (eg. Valageas & Silk 1999, Bower et al. 2001). A lower central entropy than normal would allow the gas to achieve higher densities, accounting for the high luminosity observed. Fossil systems may thus represent evidence for a distribution of central entropy values from group to group as opposed to a constant value.
We illustrate this point in Fig 3 using the relatively simple analytic model of Babul et al. (2002) to predict the relation for various values of the entropy of the pre-heated gas. The model uses the Lacey & Cole (1994) mass distribution function to derive the distribution of formation redshifts, assumes an isentropic core (the size of which is a function of mass), outside of which accreting gas is shock heated, and uses the Raymond & Smith (1977) emissivities to predict X-ray luminosities. The normalisation and shape of the observed group and cluster relation at z=0 are well matched for a pre-heated gas entropy of 427 keV cm2 (hatched region in Fig 3) for this particular model. The two fossil group points lie near lower values of the pre-heated gas entropy (shown by the dashed lines), but not as low as the prediction for no pre-heating (solid line), where the (isothermal) temperature is given by the virial temperature at the epoch of formation.
A lower central entropy could be due to either an early formation epoch or simply to less energy injection. If the energy injection in some fossil groups occurred at high redshifts, earlier than in most groups, and thus at higher densities, then a given injected energy would produce a lower entropy in these systems (Ponman et al. 1999). An early epoch of formation is consistent with the hypothesis that fossil groups are generally old, undisturbed systems in which the bright galaxies have merged. Alternatively, if the groups were formed with only one very luminous, massive galaxy, then the high escape velocity from that galaxy may have prevented supernova winds reaching the intra-group medium and thus reduced the specific energy injection.
(d) The offset in Fig 4 between the fossil groups and the Helsdon & Ponman groups may alternatively be due to low (by a factor 2.5) optical luminosities of the fossil groups, rather than high X-ray luminosities. This would imply abnormally high mass-to-light ratios and low star-formation efficiencies (Vikhlinin et al. 1999). Comparing optical luminosities with X-ray temperatures, the two fossil groups with measured X-ray temperatures do indeed have low optical luminosities for their temperatures when compared with the Helsdon & Ponman sample (a factor 1.5 below the mean relation), but this is well within the scatter of the Helsdon & Ponman data. More detailed X-ray and optical observations will considerably clarify the situation.
The origin of the excess X-ray luminosities will become clearer when studies using Chandra data, in progress, are complete.
5.3 The origin of fossil groups
The unusual distribution of galaxy light in fossil groups could be due to merging of L* galaxies, as we have proposed (Ponman et al. 1994, Jones et al. 2000b), or simply due to an unusual distribution of galaxy masses when the groups formed. Although there is as yet no direct evidence of merger activity in fossil groups, there are several arguments supporting the merger origin.
In one sense, the luminous galaxies in fossil groups are extreme versions of brightest cluster galaxies (BCGs), since they emit a very high fraction of the total group light (70% in RXJ1340.6+4018; Jones et al. 2000b). The optical luminosities of BCGs have been shown to be not drawn from the luminosity function of cluster ellipticals (Sandage 1976; Tremaine & Richstone 1977; Bernstein & Bhavsar 2001), suggesting a different origin for at least some of the BCG light.
To test the likelihood of m122.0 appearing by chance, we sampled a Schechter function with the parameters of the composite luminosity function of MKW/AWM clusters (Yamagata & Maehara 1986). We performed 10,000 Monte Carlo simulations with absolute magnitudes selected at random from the Schechter function distribution. The number of simulated luminosity functions with m122.0 was 0.4%0.06%, significantly lower than the 8%-20% of clusters and groups of comparable luminosity found to be fossil systems.
There are two pieces of observational evidence that support the merger origin. Firstly, the gap in the galaxy luminosity function at L∗ in the central regions of the systems matches the predicted effect of dynamical friction, since the most massive galaxies are predicted to fall into the centre earliest. The combination of the lack of L∗ galaxies and the very luminous central galaxy is very suggestive of merging. Formation of the systems with the luminosity distribution observed today would require the formation of a single luminous galaxy to be accompanied by a deficiency of less luminous galaxies.
Secondly, there is a strong correlation between the group X-ray luminosity and the central galaxy optical luminosity, when what is expected is a relation with the total group optical luminosity. Indeed, the slope is consistent with that found for normal groups when plotted against the total group optical luminosity. This suggests that, unusually, the luminosity of the brightest galaxy is strongly related to the global group properties. This would arise naturally if the central galaxies were a result of multiple merging. Galaxy merging (for the BCGs in low LX clusters) has also been suggested to explain the differences in evolution found for BCGs in host clusters of low and high LX (Burke, Collins & Mann 2000, Brough et al. 2002, Nelson et al. 2002).
5.4 An evolutionary sequence
Fossil groups are more common than HCGs of the same by a factor of 2-4. In addition, from the discussion above we find that groups in general are 8 times more numerous than fossil groups. We assume a simple evolutionary sequence. If loose groups form at an early epoch, with the L* galaxies within them evolving via HCGs into fossil groups over a Hubble time, leaving the X-ray luminosity almost unchanged, then the relative space densities of the three different types of system give information on the transformation rates. We use a very simple model in which the number of groups in any one state is proportional to the difference between the formation and destruction rates of that state. The observed relative abundances are obtained if the formation rate of HCGs is 1.3 times the formation rate of fossil groups, and the formation rate of loose groups is 6 times the formation rate of HCGs. A relatively slow rate of formation of fossil groups is consistent with the long dynamical friction timescale of L* galaxies.
5.5 The environments of luminous galaxies
In the local Universe, the majority of very luminous galaxies are not found in poor or rich cluster environments, but rather in binary systems or groups (Cappi et al. 1998, Giuricin et al. 2001). Moreover, of the 113 very luminous galaxies with -22.5 + 5log(h50) (ie. ) in the Southern Sky Redshift Survey 2, Cappi et al. (1998) estimate that 5-20% are in groups dominated by the single luminous galaxy. The optical luminosities of these luminous galaxies are similar to those of the central galaxies in our fossil groups. Most of the very luminous galaxies of Cappi et al. are spirals. However, of the very luminous early-type galaxies, 50%-60% are not in rich or poor clusters. Colbert, Mulchaey & Zabludoff (2001) have also found several isolated, luminous ( -22.5 + 5log(h50)) early-type galaxies.
Although usually no redshift information on the fainter members of the Cappi et al. groups is available, several of these systems appear to have a distribution of optical galaxy luminosities very similar to that of our fossil groups (see also Cappi et al. 2000). In addition, very luminous galaxies in general (whether in groups or not) have a clustering amplitude higher than that of less luminous galaxies, and similar to that of rich groups (Giuricin et al. 2001). Because clustering amplitude increases with system mass, from galaxies to clusters, Cappi et al. (1998) suggested that very luminous galaxies may be associated with dark halos of group mass.
However, not all very luminous elliptical galaxies are in fossil systems with extended X-ray halos of high luminosity. O’Sullivan, Forbes & Ponman (2001) have investigated LX as a function of Lopt and environment for nearby early-type galaxies. They find a few examples of optically very luminous early-type galaxies (which are not at the centres of groups or clusters) with both above and below the limit of 1042 h50-2 erg s-1, the limit we use here to define fossil groups. Here we again define very luminous as +5log(h50). Thus examples of optically very luminous galaxies with relatively low LX do exist. However, a larger sample is required to accurately measure the fraction of optically selected very luminous elliptical galaxies which are in systems similar to the fossil groups described here.
The fraction of very luminous elliptical galaxies which were formed in fossil groups is difficult to estimate. The space density of all galaxies more luminous than our faintest central galaxy (+5log(h50), or ) is h503Mpc-3, based on the 2dF galaxy redshift survey luminosity function of Norberg et al. (2002) and assuming =1.5 mag. This is 25 times the density of fossil groups, but only perhaps a quarter of these may be early-type galaxies (Giuricin et al. 2001). Evolutionary effects also complicate this comparison. For example, recent infall of L∗ galaxies into the cores of fossil groups would remove them from the fossil category. Our results do however suggest that at least a fraction of very luminous elliptical galaxies formed via mergers in galaxy groups.
6 Conclusions
We have made an observational definition of a fossil system and constructed an X-ray selected, flux-limited sample of 5 fossil groups of galaxies with well defined selection criteria. The groups are completely dominated by a central, luminous giant elliptical galaxy with no cD halo.
Evidence for the luminous central galaxies being the result of multiple mergers of L∗ galaxies includes: the gap in the galaxy luminosity function at L∗, combined with the high luminosity of the central galaxies and a low probability of obtaining m122 by chance, and a strong correlation between the X-ray luminosity of the groups and the optical luminosity of the central galaxies (with a slope consistent with that found for (group) versus (group) for normal groups, although with an offset to higher X-ray luminosities).
The X-ray luminosities of the fossil groups are well in excess of that expected for their optical luminosities, and also for their X-ray temperatures (for the two systems where can be measured). The high X-ray luminosities may be caused by relatively cool gas in the innermost regions or by a low central gas entropy. A low central entropy could be the result of an early epoch of formation, before most groups were formed, and consistent with the interpretation of fossil systems as old, undisturbed systems in which most L∗ galaxies have merged.
The fraction of all groups which are fossil systems of the same is 8%-20%. Fossil groups are at least as numerous as all poor and rich clusters combined (of 1043 erg s-1) and thus are potentially the site of formation of many brightest cluster galaxies, before infall into clusters. However, only a fraction of all optically luminous elliptical galaxies are found in X-ray bright group environments.
7 Acknowledgements
We thank Steve Helsdon and Michael Balogh for discussions and supplying data before publication, and the Isaac Newton Group staff on La Palma for making INT service time observations. The anonymous referee also made several useful suggestions. LRJ acknowledges PPARC support during part of this work, AB acknowledges research support from NSERC (Canada) and DJB acknowledges the support of NASA contract NAS8-39073 (CXC). We acknowledge use of the Digitized Sky Survey, which was produced at the Space Telescope Science Institute, the High Energy Astrophysics Science Archive Research Center (HEASARC), provided by NASA’s Goddard Space Flight Center, the Leicester Database and Archive Service at the Department of Physics and Astronomy, Leicester University, UK, and the NASA/IPAC Extragalactic Database (NED), which is operated by the Jet Propulsion Laboratory, California Institute of Technology, under contract with NASA.
8 REFERENCES
Albert C.E., White R.A., Morgan W.W., 1978, ApJ, 211, 309 (AWM)
Allen A.Q., 1973, Astrophysical Quantities. Athlone, London
Aarseth S.J., Fall S.M., 1980, ApJ, 236, 43
Avni Y., Bahcall J.N., 1980, ApJ, 235, 694
Babul A., Balogh M.L., Lewis G.F., Poole G.B., 2002, MNRAS, 330, 329
Balogh M.L., Babul A., Patton D.R., 1999, MNRAS, 307, 463
Bernstein J.P. & Bhavsar S.P., 2001, MNRAS, 322, 625
Binney K., Tremaine S., 1987, Galactic Dynamics. Princeton Univ. Press,
Princeton, NJ
Beers T.C., Kriessler J.R., Bird C.A., Huchra J.P. 1995, AJ, 109,
874
Borne K.D., Bushouse H., Lucas R.A., Colina L., 2000, ApJ, 529, L77
Bower R.G., Benson A.J., Lacey C.G., Baugh C.M., Cole S., Frenk C.S., 2001,
MNRAS, 325, 497
Brough S., Collins C.A., Burke D.J., Mann R.G., Lynam P.D., 2002, MNRAS, 329, L53
Burke D.J., Collins C.A., Mann R.G., 2000, ApJ, 532, L105
Cappi A., Da Costa L.N., Benoist C., Maurogordato S., Pellegrini P.S.,
1998, ApJ, 115, 200
Cappi A., Benoist C., Da Costa L.N., Maurogordato S., 2000, proceedings of
IAP 2000 meeting, Constructing the Universe with Clusters of Galaxies,
F. Durret & D. Gerbal eds.
Dressler A. 1978 ApJ 223, 765
Ebeling H. & Wiedenmann G., 1993, Phys. Rev., 47, 704
Ebeling H., Jones L.R., Perlman E.S., Scharf C.A., Horner D.,
Wegner G., Malkan M., Mullis C.R., 2000, ApJ, 534, 133.
Ebeling H., Jones L.R., Fairley B.W., Perlman E., Scharf C.,
Horner D., 2001, ApJ, 548, L23.
Evrard A.E., Henry J.P., 1991, ApJ, 383, 95
Evrard A.E., Metzler C.A., Navarro J.F, 1996, ApJ, 469, 494
Fairley B.W., Jones L.R., Scharf C.A., Ebeling H., Perlman E.S.,
Horner D., Wegner G., Malkan M., 2000, 315, 669
Ghigna S., Moore B., Governato F., Lake G., Quinn T., Stadel J., 2000
ApJ, 544, 616
Giuricin G., Samurovic S., Girardi M., Mezzetti M., Marinoni C., 2001,
ApJ, 554, 857
Hagen H.J., Engels D., Reimers D., 1999, A&AS, 134, 483
Helsdon S.F., Ponman, T.J., 2000, MNRAS, 315, 356
Helsdon S.F., Ponman, T.J., 2003, MNRAS, in press, astro-ph/0212046
Henry J.P. 2000, ApJ, 534, 565
Hunsberger S.D., Charlton J.C., Zaritsky D., 1998, ApJ, 505, 536
Irwin M., Maddox S., McMahon R., 1994, Spectrum, 2, 14
Jones C., Forman W., 1984, ApJ, 276,38
Jones L.R., Scharf C.A., Ebeling H., Perlman E., Wegner G.,
Malkan M., Horner, D., 1998, ApJ, 495, 100
Jones L.R., Ebeling H., Scharf C.A., Perlman E., Horner, D., Fairley B.,
Wegner G., Malkan M. 2000a, in Durret F. & Gerbal D., eds., Constructing the Universe
with clusters of galaxies. Institute
d’Astrophysique de Paris, Paris
Jones L.R., Ponman T.J., Forbes D.A., 2000b, MNRAS, 312, 139
Kaiser N., 1991, ApJ, 383, 104
Kauffmann G., White S.D.M., Guiderdoni, B., 1993, MNRAS, 264, 201
Lacey C., Cole S., 1993, MNRAS, 262, 627
Lacey C., Cole S., 1994, MNRAS, 271, 676
Landolt A.U., 1992, AJ, 104, 1
Lloyd-Davies E.J., Ponman T.J., Cannon D.B., 2000, MNRAS, 315, 689
Lopez-Cruz O., Yee H.K.C., Brown J.P,. Jones C., Forman W., 1997,
ApJ, 475, L97
Mason K., et al 2000, MNRAS, 311, 456
Matsushita K., Makishima K., Ikebe Y.,
Rokutanda E., Yamasaki N., Ohashi T., 1998, ApJ, 499, 13
Matsushita K., 2001, ApJ, 547, 693
Mewe R., Lemen J.R., van den Oord G.H.J., 1986, A&A, 65, 511
Morgan W.W., Kayser S., White R.A., 1975, ApJ, 199, 545 (MKW)
Mulchaey J.S., Zabludoff, A.I., 1999, ApJ, 514, 133
Mushotzky R.F., Scharf, C.A. 1997 ApJ, 482, L13
Navarro J.F., Frenk C.S., White S.D.M., 1995, MNRAS, 275, 56
Nelson A.E., Gonzalez A.H., Zaritsky D., Dalcanton J.J., 2002, ApJ, 566, 103
Norberg P., et al, 2002, MNRAS submitted.
O’Sullivan E., Forbes D.A., Ponman T.J., 2001, MNRAS, 328, 461
Perlman E.S., Horner D., Jones L.R., Scharf C., Ebeling H., Wegner G.,
Malkan M., 2002, ApJS, in press.
Ponman T.J., Allan D.J., Jones L.R., Merrifield M., McHardy I.M.,
Lehto H.J., Luppino G.A. 1994, Nature, 369, 462
Ponman T.J., Bourner P.D.J., Ebeling H., Bohringer H., 1996, MNRAS, 283, 690
Ponman T.J., Cannon D.B., Navarro J.F., 1999, Nat, 397, 135
Price R., Burns J.O., Duric N., Newberry M.V., 1991, AJ, 102, 14
Raymond J.C., Smith B.W., 1977, ApJS, 35, 419
Romer A.K., Nichol R.C, Holden B.P., Ulmer M.P.,
Pildis R.A., Merrelli A.J., Adami C., Burke D.J.,
Collins C.A., Metevier A.J., Kron R.G., Commons K., 2000, ApJS, 126, 209
Sandage A, 1976, ApJ, 205, 6
Scharf C.A., Jones L.R., Ebeling H., Perlman E., Malkan M.,
Wegner G. 1997, ApJ, 477, 79
Taylor J.E., Babul A., 2001, ApJ, 559, 716
Thuan T.X., Romanishin W., 1981, ApJ, 248, 439
Tremaine S.D., Richstone D.O., 1977, ApJ, 212, 311
Tripp T.M., Lu L., Savage B.D., 1998, ApJ, 508, 200
Valageas P., Silk J., 1999, A&A, 350, 725
Vikhlinin A., McNamara B.R., Forman W., Jones C., Quintana H., Hornstrup A.,
1998, ApJ, 502, 558
Vikhlinin A., McNamara B.R., Hornstrup A., Quintana H., Forman W.,
Jones C., Way C., 1999, ApJ, 520, L1
White D.A., Jones C., Forman W., 1997, MNRAS, 292, 419
White R.L., Becker R.H., Helfand D.J., Gregg M.D., 1997, ApJ 475, 479
Yamagata T., Maehara H. 1986, PASJ, 38, 661
Zabludoff A.I., Geller M.J., Huchra J.P., Vogeley M.S., 1993, AJ, 106, 1273