Relativistic and slowing down: the flow in the hotspots of powerful radio galaxies and quasars.
Abstract
Pairs of radio emitting jets with lengths up to several hundred kiloparsecs emanate from the central region (the ‘core’) of radio loud active galaxies. In the most powerful of them, these jets terminate in the ‘hotspots’, compact high brightness regions, where the jet flow collides with the intergalactic medium (IGM). Although it has long been established that in their inner (parsec) regions these jet flows are relativistic, it is still not clear if they remain so at their largest (hundreds of kiloparsec) scales. We argue that the X-ray, optical and radio data of the hotspots, despite their at-first-sight disparate properties, can be unified in a scheme involving a relativistic flow upstream of the hotspot that decelerates to the sub-relativistic speed of its inferred advance through the IGM and viewed at different angles to its direction of motion. This scheme, besides providing an account of the hotspot spectral properties with jet orientation, it also suggests that the large-scale jets remain relativistic all the way to the hotspots.
1 Introduction
Radio maps of powerful radio galaxies usually show pairs of hotspots, compact synchrotron emitting regions, on each side of the radio core, feeding the extended lobes of the system with radio emitting plasma. Cygnus-A, the prototype powerful radio galaxy, was the first such source whose hotspots were detected in X-rays too (Harris, Carilli & Perley 1994); their radio–X-ray data were modeled successfully as synchrotron self-Compton emission from relativistic electrons in pressure equipartition with the magnetic field of the source (Synchrotron Self-Compton in Equipartition, SSCE). Equipartition, as yet without a firm theoretical justification, is favored energetically as it is the most economical way for producing a given synchrotron power. None of the two Cygnus-A hotspots has been detected in the optical, suggesting that the synchrotron emission cuts-off at lower frequencies. Although Chandra observations of Cygnus-A (Wilson, Young & Shopbell 2000) confirm the SSCE models, Chandra observations of Pictor-A (Wilson, Young & Shopbell 2001), another powerful radio galaxy, present a drastically different picture: While both its hotspots are seen in the radio, X-rays reveal the presence of an one-sided jet and a single hotspot on the jet side of the source; furthermore, optical (presumably synchrotron) emission has been detected, but only from the hotspot seen in X-rays. Additionally, SSCE models strongly under-predict the X-ray flux and imply that a magnetic field times lower than the equipartition value is required to reproduce the X-ray flux.
These differences between the hotspot properties of Cygnus-A and Pictor-A are in fact not incidental but rather representative of the radio galaxy subclass to which they belong (Cygnus-A is a NLRG – Narrow Line Radio Galaxy, while Pictor-A a BLRG – Broad Line Radio Galaxy; see also §2) due, in part, to source orientation. According to the unification scheme of powerful radio galaxies and quasars (e.g. Urry & Padovani 1995), the Broad Line Region is only visible in objects with jets axes relatively close to the observer’s line of sight, while the Narrow Line Region is visible at all inclinations. Their difference in orientation is further supported by an altogether independent indicator, the ratio of the core-to-extended (lobe) radio power . This is larger for more aligned objects, because the lobe emission is isotropic, while the core emission is relativistically beamed in the direction of the plasma flow. The drastically different values of between Cygnus-A (; Zirbel & Baum 1995) and Pictor-A (; Zierbel & Baum 1995), then, argue that the jet axis of Cygnus-A is closer to the plane of the sky, whereas that of Pictor-A is pointing closer to the observer’s line of sight, a point further corroborated by the presence of the one-sided X-ray jet in the same direction with the known VLBI jet (Tingay et al. 2000) of the core of Pictor-A. The possibility of two intrinsically asymmetric jets feeding the hotspots of Pictor A is not favored, given the practically equal power radiated by the two extended radio lobes (Perley, Röser & Meisenheimer 1997).
In this note we put forward a hypothesis that provides an economical description of the multi-frequency, multi-object hotspot data, which we summarize in §2. In §3 we describe our proposal and in §4 conclusions are drawn and some of the main open issues are discussed.
2 Collective X-ray–Detected Hotspot Properties
Table 1 lists all radio galaxies and quasars with detected hotspot X-ray emission. The strong correlation of X-ray detections from a single only or both hotspots with the jet orientation indicators (values of , BLRG-NLRG classification) is unmistakable and argues, convincingly in our view, of the importance of orientation in the hotspot X-ray morphology. Also apparent in Table 1 is the correlation between jet orientation and the hotspot spectral properties and modeling: (a) In NLRG X-ray emission (generally attributed to the inverse Compton process) is observed from both hotspots [except for the peculiar NLRG 3C 123 (Hardcastle, Birkinshaw & Worall 2001) which exhibits detected X-rays from only one hotspot] and it is successfully modeled as SSCE emission. Also, NLRG show no optical hotspot emission, suggestive of a cut-off in the observed synchrotron spectrum at lower frequencies [the optical emission in the NLRG 3C 295 is modeled as self-Compton (Brunetti 2002b)]. (b) In BLRG and quasars, which generally exhibit one-sided VLBI jets (e.g. Giovannini et al. 2001), a single hotspot is detected in X-rays, always on the VLBI jet side; synchrotron optical emission is also detected consistently from the same hotspot. Models of the radio – X-ray spectra fail to produce the observed X-ray fluxes with SSCE parameters, severely under-predicting their observed X-ray fluxes. Forcing SSC models to produce X-ray fluxes in agreement with observation leads to magnetic field values several times below the inferred equipartition ones. An exception to this rule is 3C 263, for which SSC models can reproduce the observed X-ray flux with a magnetic field only half of its equipartition value (Hardcastle et al. 2002).
Closer inspection of Table 1 reveals the following correlations between source orientation and photon frequency: () X-ray hotspot emission correlates with source alignment (as measured by ): Sources closer to the plane of the sky (small ) exhibit X-ray emission of comparable flux from both hotspots. As alignment increases the X-ray hotspot emission is restricted to the near hotspot (i.e. the one on the same side as the VLBI jet); furthermore, its X-ray-to-radio ratio becomes larger than predicted by SSCE, hinting the presence of an additional component more sensitive to orientation effects than SSC. () Optical (synchrotron) emission, initially weak or absent, appears at the near hotspot as gets larger. [The only known exception to this sequence is possibly the quasar 3C 207 (Brunetti et al. 2002a), which has NLRG hotspot characteristics but exhibits broad line emission and strong core dominance (; Hough & Readhead 1989). However, VLBI observations (Hough et al. 2002) show that the parsec scale radio jet of this source is strongly bent, exhibiting large-scale properties akin to a NLRG, while at small scales appears to be a BLRG]. () Radio emission is consistently observed from both hotspots in all cases. However, while sources with jet axis close to the plane of the sky exhibit practically equal hotspot fluxes, for more aligned jets the near hotspot has a higher radio flux and a flatter radio spectrum (Dennett-Thorpe et al. 1997).
3 Frequency-dependent beaming
In this note we propose that the above properties can be accounted for by postulating relativistic beaming which becomes weaker (i.e. of lower Lorentz factor, broader beaming angle) with decreasing photon frequency. Such a frequency dependent beaming arises naturally in the decelerating flow following the shock expected in the transition of the jet velocity from relativistic to that of the hotspot advance [, (Arshakian & Longair 2000)] through the IGM. Electrons, accelerated impulsively to relativistic energies at the shock, are transported downstream with the fluid, while at the same time losing energy to synchrotron and inverse Compton radiation. The highest energy electrons are therefore located immediately downstream of the shock where the flow Lorentz factor is also higher.
This model provides a direct account of the properties of the synchrotron component: According to our proposal, beaming is highest for the X-ray synchrotron emission, consistent with its (possible) detection from a single object, namely the superluminal 3C 390.3 (Prieto 1997). The Optical synchrotron emission is still significantly beamed (but less than the synchrotron X-rays) and it is (as expected) preferentially detected in the hotspots of the approaching jet in the more aligned objects (BLRG). The synchrotron emission from the receding jet hotspot is beamed away from the observer with its flux reduced by a factor , where is the angle between the line of sight and the jet axis, is the velocity of the fluid and is the spectral index. The downstream velocity perpendicular to the shock front is in the hotspot frame, which, added to the hotspot advance-velocity of , transforms to in the lab frame (assuming a perpendicular shock). Even for this most restrictive case, the near-to-far hotspot flux ratio is for and , an angle typical (Urry & Padovani 1995) of BLRG and quasars. However, this is only a lower limit, as oblique shocks, commonly seen in numerical simulations (Komissarov & Falle 1996, Aloy et al. 1999), routinely produce hotspot flows with Lorentz factors up to that decelerate to eventually match the sub-relativistic hotspot advance speed [this has been used by Komissarov & Falle (1996) to explain the fact that the radio hotspots on the side of the jet are systematically brighter and have a flatter spectrum]. Flows with suffice to suppress the optical flux from the far hotspot of a BLRG or a quasar by more than two orders of magnitude. Finally, the effects of beaming are smallest for the Radio emission, which is observed from the hotspots of both jets in all objects, albeit with systematically higher intensities for the near jet hotspot.
The situation with the inverse Compton component, the generally accepted process responsible for the X-ray emission, is more subtle: The detection of X-rays consistent with SSCE models from the hotspots of both jets in NLRG, argues that this emission (like the radio) is not significantly beamed in these objects (beaming affects both these components identically within SSC). However, the increase of the X-ray flux relative to that of the radio with increasing , suggests contribution from a component with beaming enhancement more pronounced than that of SSC. The obvious candidate is inverse Compton scattering of photons other than those locally produced by synchrotron (the so-called External Compton, EC), whose beaming properties are more sensitive (Dermer 1995; Georganopoulos, Kirk & Mastichiadis 2001) to orientation than those of SSC. In fact, this process has been invoked (Tavecchio et al. 2000; Celotti, Ghisellini & Chiaberge 2001) to account for the X-ray emission from the knots of the PKS 0637-752 jet by considering X-ray production from the up-scattering of the Cosmic Microwave Background (CMB) photons; however, the CMB photons alone are in general inadequate to account for the X-ray emission of most hotspots.
In search of an additional photon component necessary to produce the observed enhancement in Comptonized flux with decreasing angle of observation, we have come to the realization that in a decelerating flow, synchrotron photons from its slower () parts, can serve as seed photons for scattering by the electrons of its faster, likely relativistic, section. As in EC scattering (Dermer 1995), the photon energy density in the comoving frame of the fast electrons increases by , where is the relative Lorentz factor between the downstream slow plasma emitting the synchrotron seed photons and the upstream fast plasma containing the scattering electrons. Because the density of these photons exceeds that of the CMB ones (for the parameters of most X-ray detected hotspots), they present the dominant soft photon source responsible for the X-ray emission. It is our contention that Compton scattering of these photons off the electrons of the upstream, faster flow (Upstream Compton, UC) can lead to the necessary enhancement of the X-ray-relative-to-radio flux observed in BLRG.
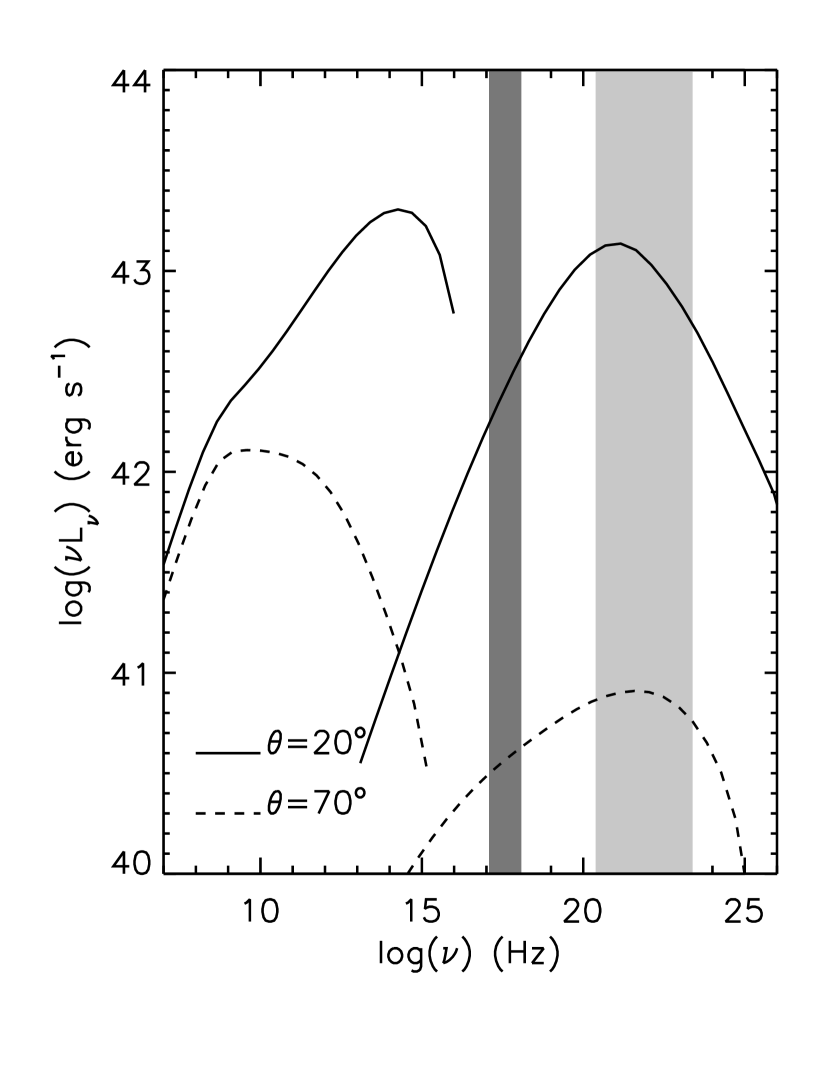
We demonstrate the above features with a kinematic, one-dimensional model which assumes the injection of an power law electron energy distribution with a high energy cut-off at the base of a relativistic, decelerating flow. In Figure 1 we exhibit the spectrum resulting from such a flow viewed at two different angles. The electron energy density is assumed to be in equipartition with a magnetic field of G, (similar to the observationally determined equipartition field of Cygnus-A), while the position dependent flow Lorentz factor to have the form with and kpc and similar transverse dimension, as determined by the Chandra observations. The observed luminosity (the angularly resolved emission allows the computation of the absolute luminosity scale) from the entire volume of the flow (taking into account the and dependent relativistic beaming) is calculated as a function of the photon energy, for two different observing angles, (solid) and (dashed).
The Spectral Energy Distribution (SED) for is very similar to those of the NLRG hotspots, in particular that of Cygnus-A. Specifically, one should note the synchrotron component cutoff below the optical band and the low X-ray-to-radio luminosity ratio. At the resulting SED is very different, resembling that of the BLRG/quasar hotspots: Its synchrotron slope is flatter and peaks at optical energies. Also, the ratio of the X-ray-to-radio luminosity is higher, consistent with the ratios observed for these more aligned sources. A noteworthy feature of the spectra of figure 1 is the distinctly different slopes of the synchrotron component at large and small values of , in agreement with observations which require harder spectra from the near compared to the far hotspots (Dennett-Thorpe et al. 1997), a systematic never convincingly explained. Furthermore, the cooling break of at radio frequencies for (similar to that observed in the hotspots of Cygnus-A) is significantly reduced at and it can, with a judicious choice of parameters, even disappear (as is the case in Pictor-A).
The harder spectra obtained for smaller and the reduction in the cooling break change in slope from its canonical value of can be easily understood if one considers that the IR-optical emission receives contribution from electrons of both higher energy and higher flow speed, i.e. of increased relativistic boosting. For small values of this amplifies the IR-optical emission relative to that of the radio, which is produced by electrons from the slower parts of the flow. This preferential relativistic boosting of the higher frequency radiation results, hence, in harder spectra and also smaller slope changes associated with the cooling break. At large , the effects of differential boosting are negligible and one obtains the standard values for the synchrotron slopes and cooling break. Similarly, the X-ray emission at small is dominated by the more beamed UC emission; this is Doppler-suppressed at larger and the dominant contribution to the observed X-ray flux is due to the semi-isotropic SSCE emission from the low speed part of the flow. We plan to discuss these issues in greater detail in an upcoming publication.
4 Discussion
We have presented above a general framework which encompasses the broad band (radio-to-X-ray) spectral properties of the X-ray detected hotspots of powerful radio galaxies. Our thesis is that the presence of a decelerating, relativistic () flow in the hotspots explains the ensemble of their multi-frequency, multi-object data as an (essentially) one-parameter family, namely the angle . The deceleration of the flow is the ingredient necessary to produce the increase of the X-ray-to-radio flux ratio in the BLRG relative to the NLRG hotspot spectra, their most prominent difference. As explained, this is due to the Upstream Compton (UC) process which enhances the Compton emission more than that of the synchotron for small values of . The precise dependence of the flow’s Lorentz factor with distance does affect the model spectra, however, it does not change their qualitative features (i.e. harder spectra, higher energy synchrotron cutoffs for sources with smaller ). As far as we know, this is the first concrete (albeit indirect) evidence that the flows in these jets remain relativistic all the way to the hotspots.
We believe that within the limited sample of objects of Table 1, our model fares quite well in providing a broad framework which can address and systematize the at-first-hand disparate multi-frequency observations of the radio galaxy hotspots. Exceptions from the expected properties, even within Table 1, could be attributed to idiosyncrasies of the specific sources. In fact, in view of the peculiarities of hotspot flows produced in simulations todate (e.g. Aloy et al. 1999; these exhibit time dependent multiple oblique shocks, while the flows turn around to flow backward in the outer layers of the jet “cocoon”), it is rather surprising that the simplified 1-D model used in our calculations can describe the collective data as well as it does. After all, the distribution of objects in angle (and by consequence their properties) is not bimodal, so objects with intermediate, or mixed properties should soon appear as the list of ojbects gets larger.
We should also stress the particular importance of deep multi-frequency observations which could detect the hotspot emission of the counterjet (preferentially in BLRG), in the determination of the flow velocity field at the hotspots. This can be achieved through measurements of the flux ratio at various frequencies and, assuming an orientation angle , invert its expression to obtain the flow velocity as a function of photon frequency. An upper limit, , to the value of the angle can be also estimated by setting : . We believe that direct comparison with detailed models will then produce in addition to other parameters, also the dependence of on the distance.
An enlargement of this list, through X-ray (Chandra), optical, and radio (VLA) observations of sub-arcsecond resolution, in combination with detailed fits of the combined radio-to-X-ray spectra will lead to a more stringent testing (and possible rejection) of this model. In this respect, future GLAST observations may be of great importance by providing additional constraints in the 10 MeV - 10 GeV band, where the IC flux peaks (see figure 1). We have estimated that in some of the nearby () sources, the hotspot high energy ray flux will be both detectable and its position sufficiently well determined to be distinguished from the (potential) emission from the AGN “core”.
References
- Aloy et al. (1999) Aloy , M. A., Ibáñez , J. M., Martí, J. M., Gómez , J. L. & Müller, E. 1999, ApJ, 523, L125
- Arshakian & Longair (2000) Arshakian, T. G. & Longair, M. S. 2000, MNRAS, 311, 846
- (3) Brunetti, G., Cappi, M., Setti, G., Feretti, L. & Harris, D. E. 2001a, A&A, 372, 777
- Brunetti et al. (2001b) Brunetti, G., Bondi, M., Comastri, A., Pedani, M., Varano, S., Setti, G. & Hardcastle, M. J. 2001b, ApJ, 561, L 157
- Brunetti et al. (2002a) Brunetti, G., Bondi, M., Comastri, A. & Setti, G. 2002a, A&A, 381, 795
- Brunetti (2002b) Brunetti, G. 2002b, preprint (astro-ph/0207671)
- Celotti, Ghisellini & Chiaberge (2001) Celotti, A., Ghisellini, G. & Chiaberge M. 2001, MNRAS, 321, L1
- Dennett-Thorpe et al. (1997) Dennett-Thorpe, J., Bridle, A. H., Scheuer, P. A. G., Laing, R. A. & Leahy, J. P. 1997, MNRAS, 289, 753
- Dermer (1995) Dermer, C. D. 1995, ApJ, 446, L63
- Georganopoulos, Kirk & Mastichiadis (2001) Georganopoulos, M., Kirk, J. G. & Mastichiadis, A. 2001, ApJ, 561, 111
- Giovannini et al. (2001) Giovannini, G., Cotton, W. D., Feretti, L., Lara, L. & Venturi, T. 2001, ApJ, 552, 508
- Hardcastle et al. (1998) Hardcastle, M. J., Alexander, P., Pooley, G. G. & Riley, J. M. 1998, MNRAS, 296, 445
- Hardcastle, Birkinshaw & Worrall (2001) Hardcastle, M. J., Birkinshaw, M. & Worrall, D. M. 2001, MNRAS, 323, L17
- Hardcastle et al. (2002) Hardcastle, M. J., Birkinshaw, M., Cameron, R. A., Harris, D. E., Looney, L. W. & Worrall, D. M. 2002, ApJ, 581, 948
- Harris, Carilli& Perley (1994) Harris, D. E., Carilli, C. L. & Perley, R. A. 1994, Nature, 367, 713
- Harris et al. (2000) Harris, D. E. et al. 2000, ApJ, 530, L81
- Hough & Readhead (1989) Hough, D. H. & Readhead, A. C. S. 1989, AJ, 98, 1208
- Hough et al. (2002) Hough, D. H., Vermeulen, R. C., Readhead, A. C. S., Cross, L. L., Barth, E. L., Yu, L. H., Beyer, P. J. & Phifer, E. M. 2002, AJ, 123, 1258
- Kataoka et al. (2003) Kataoka, J., Edwards, P., Georganopoulos, M., Takahara, F. & Wagner, S. 2003, A&A, 399, 91
- Komissarov & Falle (1996) Komissarov, S. S. & Falle, S. A. E. G. 1996 In ASP Conf. Ser. Vol. 100, Energy Transport in Radio Galaxies and Quasars, ed. P. E. Hardee, A. H. Bridle & J. A. Zensus (ASP: San Francisco), 327
- Lähteenmäki & Valtaoja, (1999) Lähteenmäki A. & Valtaoja, E. 1999, AJ, 117, 1168
- Perley, Röser & Meisenheimer (1997) Perley, R. A., Röser, H.-J., & Meisenheimer, K. 1997, A&A, 328, 12
- Prieto (1997) Prieto, M. A. 1997, MNRAS, 284, 627
- Saikia & Kulkarni (1994) Saikia D. J. & Kulkarni V. K. 1994, MNRAS, 270, 897
- Tavecchio et al. (2000) Tavecchio, F., Maraschi, L., Sambruna, R. & Urry, C. M., 2000, ApJ, 544, L23
- Tingay et al. (2000) Tingay, S. J. et al. 2000, AJ, 119, 1695
- Urry & Padovani (1995) Urry, C. M. & Padovani, P. 1995, PASP, 107, 803
- Wills & Browne (1986) Wills, B. J. & Browne, I. W. A. 1986, ApJ, 302, 56
- Wilson, Young & Shopbell (2000) Wilson, A. S., Young, A. J. & Shopbell, P. L. 2000, ApJ, 544, L27
- Wilson , Young & Shopbell (2001) Wilson, A. S., Young, A. J. & Shopbell, P. L. 2001, ApJ, 547, 740
- Zirbel & Baum (1995) Zirbel, E. L. & Baum, S. A. 1995 ApJ, 448, 521
| SOURCE | TYPE | z | OPTICAL | X-RAY | SSCE | |
|---|---|---|---|---|---|---|
| 3C 330 (catalog ) | NLRG | 0.549 | -3.5 aafootnotemark: | NO | YESbbfootnotemark: , two sides | YES |
| Cygnus A (catalog ) | NLRG | 0.057 | -3.3 ccfootnotemark: | NO | YESd,ed,efootnotemark: , two sides | YES |
| 3C 295 (catalog ) | NLRG | 0.461 | -2.7 ccfootnotemark: | YES, SSC fffootnotemark: | YESg,hg,hfootnotemark: , two sides | YES |
| 3C 123 (catalog ) | NLRG | 0.218 | -1.9 iifootnotemark: | NO | YESjjfootnotemark: , one side | YES |
| 3C 263 (catalog ) | Q | 0.656 | -1.0 kkfootnotemark: | YESbbfootnotemark: , jet side | YESbbfootnotemark: , jet side | see text |
| 3C 351 (catalog ) | Q | 0.371 | -1.9 llfootnotemark: | YESm,bm,bfootnotemark: , jet side | YESm,bm,bfootnotemark: , jet side | NO |
| Pictor A (catalog ) | BLRG | 0.035 | -1.16 ccfootnotemark: | YESnnfootnotemark: , jet side | YESnnfootnotemark: , jet side | NO |
| 3C 303 (catalog ) | Q | 0.141 | -0.73 ccfootnotemark: | YESoofootnotemark: , jet side | YESppfootnotemark: , jet side | NO |
| 3C 390.3 (catalog ) | BLRG | 0.057 | -1.06 ccfootnotemark: | YESoofootnotemark: , jet side | YESqqfootnotemark: , jet side | NO |
| 3C 207 (catalog ) | Q | 0.684 | -0.5 kkfootnotemark: | NO | YESrrfootnotemark: , jet side | YES |
References. — (a) Saikia & Kulkarni 1994, (b) Hardcastle et al. 2002, (c) Zirbel & Baum 1995, (d) Harris, Carilli & Perley 1994, (e) Wilson, Young & Shopbell 2000, (f) Brunetti 2002b, (g) Harris et al. 2000, (h)Brunetti et al. 2001a, (i) Hardcastle et al. 1998, (j) Hardcastle et al. 2001, (k) Hough & Readhead 1989, (l) Wills & Browne 1986, (m) Brunetti et al. 2001b, (n) Wilson et al. 2001, (o) Lähteenmäki & Valtaoja 1999, (p) Kataoka et al. 2003, (q) Prieto 1997, (r) Brunetti et al. 2002a.