An alternative to the cosmological ‘concordance model’
Precision measurements of the cosmic microwave background by WMAP are believed to have established a flat -dominated universe, seeded by nearly scale-invariant adiabatic primordial fluctuations. However by relaxing the hypothesis that the fluctuation spectrum can be described by a single power law, we demonstrate that an Einstein-de Sitter universe with zero cosmological constant can fit the data as well as the best concordance model. Moreover unlike a -dominated universe, such an universe has no strong integrated Sachs-Wolfe effect, so is in better agreement with the low quadrupole seen by WMAP. The main problem is that the Hubble constant is required to be rather low: km/s/Mpc; we discuss whether this can be consistent with observations. Furthermore for universes consisting only of baryons and cold dark matter, the amplitude of matter fluctuations on cluster scales is too high, a problem which seems generic. However, an additional small contribution () of matter which does not cluster on small scales, e.g. relic neutrinos with mass of order eV or a ‘quintessence’ with , can alleviate this problem. Such models provide a satisfying description of the power spectrum derived from the 2dF galaxy redshift survey and from observations of the Ly- forest. We conclude that Einstein-de Sitter models can indeed accommodate all data on the large scale structure of the Universe, hence the Hubble diagram of distant Type Ia supernovae remains the only direct evidence for a non-zero cosmological constant.
Key Words.:
Cosmology – Cosmic microwave background – Large scale structure – Cosmological parameters1 Introduction
Measurements of cosmological parameters with reasonable accuracy are essential both to establish a robust picture of the standard Big Bang cosmology, and to provide insights into the fundamental processes, far beyond the Standard Model of particle physics, which determined its initial conditions. Since the pioneering work of Hubble, it has been recognised that cosmological tests based on astrophysical arguments can suffer from large systematic biases. Clearly one should as far as possible use methods which do not depend explicitly on assumptions concerning complex astrophysical phenomena.
In this respect, measurements of anisotopies in the Cosmic Microwave Background (CMB) appear to offer the most promise for accurate determination of cosmological parameters, thanks to the high control possible on systematic errors. Since the epochal discovery of primordial fluctuations on large angular scales by COBE (Smoot et al. 1992), this field has witnessed a renaissance. The first detections of fluctuations on degree scales (Netterfield et al. 1995; Scott et al. 1996) provided tantalizing evidence for the flatness of the Universe (e.g. Lineweaver et al. 1997). The unambiguous detection of the first and second acoustic peaks in the angular power spectrum (de Bernardis et al. 2000; Hanany et al. 2000; Halverson et al. 2002) has confirmed this result. Taken together with studies of large-scale structure (LSS) in the universe, these observations have also confirmed the overall picture of structure formation through gravitational instability. The recent results obtained by WMAP represent a further major advance in the field. For the first time, measurements of cosmological parameters are being quoted with uncertainties of a few per cent, opening up the anticipated era of ‘precision cosmology’. Our intention here is to examine whether such determinations are in fact robust or depend crucially on underlying assumptions or ‘priors’. Specifically we wish to test whether a cosmological constant, , is really required by observations of the CMB and LSS, independently of the indications from the SN Ia Hubble diagram. We will do so by confronting Einstein-de Sitter (E-deS) models with the same observations. It turns out that with a different assumption concerning the spectrum of primordial fluctuations generated by inflation, such models can fit the data even better than models with non-zero .
2 What do the measurements imply?
The physics of passive linear perturbations in the early Universe is well understood and therefore their evolution can be computed accurately (see Hu & Dodelson 2002). This is the basic reason why precise measurements of the angular structure of the imprints left on the CMB by primordial fluctuations can provide accurate information on cosmological parameters. The ingredients necessary to compute the amplitudes of the multipole moments () specifying the angular power spectrum are both the nature and spectrum of the primordial fluctuations (presumably arising from inflation), as well as specification of the various contents of the universe which contribute to its density and pressure. The imprint of a specific parameter can be direct, through the influence on the dynamics of acoustic oscillations before the epoch of last scattering (as for the baryonic content for instance), as well as indirect, through the effect on the angular distance to the last scattering surface. A non-zero affects the s primarily through the distance effect (Blanchard 1984). There are also more subtle effects, such as the integrated Sachs-Wolfe (ISW) effect which contributes at a much weaker level. However such effects are harder to identify, as they can easily be mimicked by a non-trivial primordial fluctuation spectrum.
The first studies of the generation of density perturbations during inflation established (see Linde 1990) that for the simplest models involving a single ‘inflaton’ field, the spectrum is close to the Harrison-Zel’dovich (H-Z) scale-invariant form, with , which had been proposed earlier on grounds of simplicity. Thus the H-Z spectrum became a standard input for calculations of CMB anisotropies and the growth of LSS, e.g. in the standard cold dark matter (SCDM) model (Davis et al. 1985). In fact there are significant corrections to a H-Z spectrum even in single-field models, in particular the spectrum steepens logarithmically with increasing (decreasing scale) as the end of inflation is approached. This is usually accomodated by considering a ‘tilted’ spectrum with , although it should be noted that the index is scale-dependent for any polynomial potential for the inflaton, and is constant only for an exponential potential (power-law inflation). Moreover can be close to, and even exceed, unity if inflation ends not through the steepening of the inflaton potential but, for example, due to the dynamics of a second scalar field (hybrid inflation). In such multi-field models, the spectrum may not even be scale-free since features can be imprinted onto the spectrum, e.g. when the slow-roll evolution of the inflaton is interrupted by other background fields undergoing symmetry-breaking phase transitions (Adams, Ross & Sarkar 1997b).
The expectations for the spectral index in various inflationary models has been reviewed by Lyth & Riotto (1999). Even small departures from scale-invariance can be quite significant for LSS formation. For example after the SCDM model was found by Efstathiou et al. (1992) to be in conflict with the observed power spectrum of galaxy clustering (in being unable to simultaneously reproduce the abundance of rich clusters (quantified by the variance in a top-hat sphere of radius Mpc) and the COBE measurement of fluctuations on the scale of Mpc), it was noted by White et al. (1995) that invoking a tilted spectrum with could save the model. Interestingly enough, such a spectrum arises from natural supergravity inflation,111Technically ‘natural’ means that the flatness of the potential is protected by a symmetry — here the shift symmetry of a Nambu-Goldstone mode (Freese, Freiman & Olinto 1990). where the leading term in the potential is cubic in the field (Ross & Sarkar 1996; Adams, Ross & Sarkar 1997a). This yields , where is the number of e-folds of expansion from the end of inflation, taking the inflationary energy scale to be GeV as required by the normalization to COBE, and the reheat temperature to be GeV to avoid the thermal gravitino problem (see Sarkar 1996). If the inflationary scale is significantly lower (German, Ross & Sarkar 2001) and/or if there was a late epoch of thermal inflation (Lyth & Stewart 1996), then our present Hubble radius may have exited the horizon only e-folds from the end of inflation. This yields a spectral index as low as on cosmologically observable scales since in this model.
It is thus clear that the primordial spectrum may not have a trivial form and lacking a ‘standard model’ of inflation, it is necessary to consider a wide range of possibilities. Furthermore such complex spectra could potentially confuse cosmological parameter estimation from CMB data (e.g. Kinney 2001). This was explicitly demonstrated by Barriga et al. (2001) using the COBE and BOOMERanG data (de Bernardis et al. 2000) for the case of a primordial spectrum with a step-like feature at a scale Mpc, as in double inflation (Silk & Turner 1987). In this paper we investigate the flexibility in the determination of cosmological parameters using the much more precise WMAP data, when the usual hypothesis of a single power law spectrum is relaxed. Since the power-law index is related to the slope and curvature of the inflaton potential, it can change suddenly e.g. if the mass of the inflaton changes through its coupling to a background field which undergoes spontaneous symmetry breaking during inflation (Adams et al. 1997b)
The possible detection of a non-zero through measurements of the Hubble diagram of distant Type Ia supernovae (Riess et al. 1998; Perlmutter et al. 1999) is among the most significant developments in modern cosmology (see Peebles and Ratra, 2003), and has led to the establishment of the ‘concordance model’ with and (Bahcall et al. 1999). This is quite consistent with the WMAP data for an assumed power-law primordial spectrum; for a spatially flat universe the cosmological parameters are determined to be: , , , , and (Spergel et al. 2003). This agreement has led to to the widespread belief that the CDM concordance model is now established to high accuracy through CMB measurements. However we wish to illustrate that this agreement is crucially dependent on the underlying assumptions concerning the primordial power spectrum and that CMB data do not yet independently require a non-zero . Before addressing this issue, let us first assess the status of the concordance model.
3 Is the concordance model actually concordant?
3.1 Concordance with WMAP data
As mentioned already, SCDM with , and was found to disagree with the shape of the APM galaxy correlation function (Maddox et al. 1990), as well as the high baryon fraction measured in clusters, which together with the baryon fraction inferred from primordial nucleosynthesis arguments, implied a lower matter density of in agreement with local dynamical estimates (White et al. 1993). The subsequent measurements of CMB fluctuations on degree scales however required the universe to be spatially flat and ruled out such a low density matter-dominated universe (Lineweaver & Barbosa 1998). Thus the possible detection of cosmic acceleration in the Hubble expansion of distant supernovae, implying a cosmological constant with , was eagerly seized on as a mean of reconciling the CMB and LSS data. However although this concordance model is consistent with most cosmological observations, its first precision test has come with the WMAP data. The agreement of the concordance model with data as summarised by the WMAP team appears impressive (Spergel et al. 2003). However, there are two facts to keep in mind. First the global on the temperature autocorrelation (TT) power spectrum is rather poor — the probability that the model fits the data is only 3%, so strictly speaking the model is rejected at the confidence level! However given possible remaining systematics effects not yet accounted for, the WMAP team concluded that this should not be considered as a serious problem for the concordance model. Allowing for ‘running’ of the spectral index with scale improves the fit somewhat; the data suggest that on the largest scales and on small scales.
There is another aspect of the WMAP data that is even more puzzling, viz. the amplitudes of the low s, particularly the quadrupole, is rather small compared to the expectation in the concordance model where the large cosmological constant should boost the anisotropy on large angles. It is well known that the cosmic variance is high on such large angular scales and that Galactic foreground subtraction introduces further uncertainties. Spergel et al. (2003) concluded, from Monte Carlo realisations following two different methods, that the low signal on large scales cannot be obtained in over 99% of the cases.
However, statistical inferences from the quadrupole amplitude have to be handled with caution. The measured value of corresponds to a variance () of (Bennett et al. 2003), so one might conclude that e.g. an expected is discrepant by about , which would be at the 95% c.l. for a gaussian distribution. In properly evaluating this probability however one should take into account the foreground removal technique and its uncertainty, in order to determine the likelihood distribution. Such a distribution is likely to be non-Gaussian and it is therefore possible that the estimation of the goodness-of-fit for the concordance model might be significantly improved in this outlying region. If one instead considers the best-fit concordance model derived by Spergel et al. (2003) to be the true description of the CMB sky, the probability of observing a low quadrupole can be directly estimated. The log–likelihood of can be well approximated by (Bartlett et al. 2000):
where the noise is ( for as quoted in the WMAP data release222http://lambda.gsfc.nasa.gov), the sky coverage is , is the measured amplitude and is the value of the best-fit CDM model ( for ). Given this approximation, one can retrieve the probability distribution of and thus estimate the chance of observing a low value, following Douspis et al. (2003). For this is 4.6%, in agreement with the estimate of Tegmark, de Oliveira-Costa & Hamilton (2003) by a different method (varying the cut CMB sky and considering the best running spectral index model). This indicates that the quadrupole is an outlier at most at the 2 level (see also Gaztañaga et al. 2003, Efstathiou 2003b).
3.2 Concordance with astronomical data
As discussed already, the concordance model has been built up over time in order to match observations, thus its a posteriori agreement with much of the LSS data is not a test. Of course as the quality of data improves the model will be further tested, although the number of free parameters provides some room for adjustment.
Interestingly enough, WMAP has thrown new light on the masses of galaxy clusters and therefore on the inferred baryon fraction which, it had been argued (White et al. 1993), indicates a low matter density universe. There has been some controversy in recent years concerning the actual masses of X-ray emitting clusters, which are determined by two different methods. One is the application of hydrostatic equilibrium, while the second uses mass-temperature relationships derived from numerical simulations. Systematic differences between the two methods are significant (Markevitch 1998; Roussel, Sadat & Blanchard 2000) and this translates into an appreciable difference in the derived value of (Reiprich & Böhringer 2002; Seljak 2002). Furthermore similar differences arise from the use of different theoretical mass functions. The Sheth & Tormen (1999) expression is recognised as providing a satisfactory fit to the mass function obtained from numerical simulations. Using this for an universe, one finds corresponding to the high mass estimates from numerical simulations, and for the low mass estimates from hydrostatic equilibrium (Vauclair et al. 2003). Clearly the WMAP measurement of (Spergel et al. 2003) favours the high mass estimates. The implied baryon fraction (including stars) in clusters is then rather low, slightly below 9% (for ). This conflicts with the universal baryon fraction of 15% required for the best concordance model fit to the acoustic peaks! We note that this discrepancy disappears for , which is about a deviation from the WMAP determination.
4 Acceptable Einstein-de Sitter models
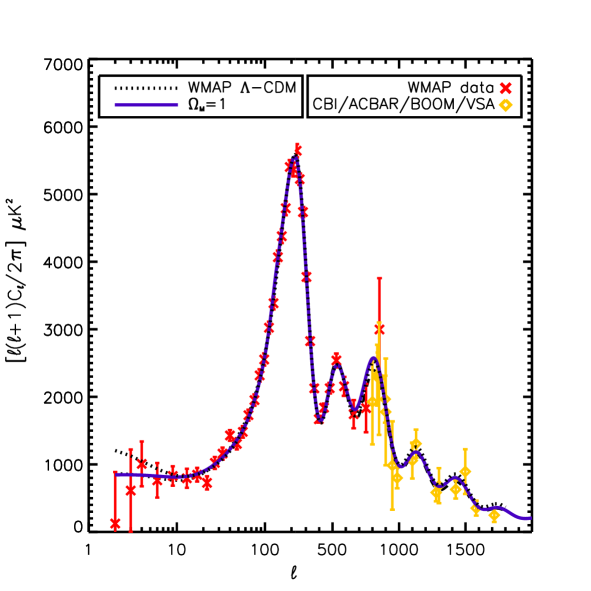
Let us now examine whether it is possible to obtain an acceptable CMB power spectrum in an E-deS universe. Clearly to do this we have to deviate from the assumptions of the CDM concordance model regarding the primordial power spectrum. Indeed the WMAP team (Peiris et al. 2003) have already noted that the model fit can be significantly improved (particularly to the outliers at 22, 40 and 200) by allowing for oscillations in the primordial spectrum (Adams, Cresswell & Easther 2001) such as might be induced by phase transitions occuring during inflation (Adams, Ross & Sarkar 1987b). However if we are not to introduce too many new parameters, the simplest modification that can be introduced is perhaps to consider a change in the slope of the spectrum at a particular scale. It is important in this respect to notice that the first and second acoustic peaks span a rather limited range of scales, , while the rising part of the first peak covers a much bigger range, . Without advocating any specific scenario, it is interesting to examine how a model with different power law indices for the primordial fluctuations in these two regions compares to the observational data. We therefore focus on models with
with a continuity condition (). We calculate the CMB power spectrum using the CAMB code (Lewis et al. 2000) and use the WMAP likelihood code (Verde et al. 2003) to determine the quality of the fit.
As we are primarily interested in examining the possible constraints on the cosmological constant, we have restricted our search to models with but allow a reasonable range for other cosmological parameters (including the optical depth to last scattering). The best model we find has , , , Mpc-1, , . As seen in Fig. 1 the calculated power spectrum does very well in fitting the WMAP data and other observations at high . Interestingly enough a preferred scale of Mpc-1 was also found by Mukherjee & Wang (2003) in attempting to reconstruct the primordial spectrum in the context of a CDM model (although Bridle et al. (2003) did not detect this using a different method). We wish to emphasise that inspite of having one additional parameter, our model has a better (on the scalar ) than the best concordance model, because of its lower amplitude at low (the of the TE spectrum being identical). In particular, the mean quadrupole has an amplitude of , which has a 13% probability of yielding . The reason of course is that E-deS models do not produce ISW effects as high as in flat models with low matter density and a large cosmological constant. This is arguably a simpler way to accomodate the observed low signal at , than to invoke new physics (e.g. Spergel et al. 2003; Uzan, Kirchner & Ellis 2003a; Efstathiou 2003a, Contaldi et al. 2003, Cline, Crotty & Lesgourgues 2003).
4.1 Why this E-deS model is in difficulty
It might appear that our E-deS model with , and must be in conflict with a number of astronomical observations. However, several of these observations which in fact support the CDM concordance model have been questioned. For example, the observed mass-to-light function from galaxies to superclusters yields (Bahcall et al. 2000) but such observations are mostly local and possibly untypical. The abundance of high redshift X-ray selected clusters, a global test rather than a local one, systematically leads to high values of , well above the best WMAP value (Henry 1997; Sadat, Blanchard & Oukbir 1998; Viana & Liddle 1999; Borgani et al. 1999; Reichart et al. 1999; Blanchard et al. 2000). This points in the same direction as the observed absence of any large-scale correlations between the COBE map of the CMB and the HEAO-1 map of the 2–8 keV X-ray background which provides an interesting upper limit of at 95% c.l. (Boughn, Crittenden & Koehrsen 2002).333Very recently, Boughn & Crittenden (2003) claim to have detected a large-scale correlation between the WMAP and HEAO-1 maps at the level, which is surprising since the WMAP and COBE maps are quite consistent. They also find a correlation between WMAP and the NVSS survey of radio galaxies at the level. Nolta et al. (2003) confirm the latter finding and reject a universe at 95% c.l. However Myers et al. (2003) have found significant contamination of the WMAP data by NVSS sources which can account for the observed correlation. Fosalba & Gaztañaga (2003) also find a correlation, twice as strong as the expected signal, between WMAP and the APM galaxy survey.
The only direct evidence so far for a cosmological constant comes from the Hubble diagram of distant Type Ia supernovae, a method which relies on the standard candle hypothesis and on empirical corrections to the observed peak magnitudes on the basis of the observed decay times. Such corrections are essential for reducing the scatter in the data sufficiently so as to allow significant cosmological deductions. However there are systematic differences in the corrections made for the same objects by the two groups (Leibundgut 2000) which raises legitimate concerns about their validity. Moreover, the distant SN Ia appear to be significantly bluer than the nearby sample, suggesting that the derived reddening may have been underestimated (Leibundgut 2001). Rowan-Robinson (2002) has argued that when extinction and the luminosity–decay time relation are treated in a self-consistent way, the significance of the evidence for positive is much reduced.

A Hubble constant of km/s/Mpc would seem to be completely inconsistent with the Hubble Key Project (HKP) determination of km/s/Mpc (Freedman et al. 2001). However there are some details of this work which might merit reexamination:
-
1.
Rowan-Robinson (2003) finds that if a more sophisticated local flow model is used than that of Mould et al. (2000), there is a reduction of about 2 km/s/Mpc in .
-
2.
The method of combining the data used by Freedman et al. (2001), viz. estimating by different methods and then combining the results, does make the outcome somewhat vulnerable to Malmquist bias. Rowan-Robinson (2003) finds that this can also result in overestimation of by about 2 km/s/Mpc.
-
3.
Between the summary paper of Mould et al. (2000) and that of Freedman et al. (2001), a change in the assumed I-band period-luminosity relation resulted in an increase of the extinction values in the Cepheid program galaxies, and hence in an average reduction in the distance scale of 4%. This was almost exactly cancelled out by correction for the effects of metallicity on Cepheid distances, of about the same magnitude in the opposite direction. However it is possible that these effects do not quite cancel, e.g. if the extinction in the program galaxies has been overestimated and/or the correction for the effects of metallicity have been underestimated. It would be highly desirable to extend observations of the Key Project Cepheids into the infrared to assess these effects.
-
4.
The assumed extinction in the LMC may be slightly on the low side compared with estimates for hot stars in the LMC by Zaritsky (1999).
-
5.
Finally, it would be highly desirable to confirm the assumed distance to the LMC, preferably by direct geometric methods.
All these effects are likely to be small, but it is possible that they may combine in the same direction to significantly reduce .
It is interesting that methods which are largely independent of the LMC and Cepheid distance scales, do tend to give significantly lower values for . For instance, Sunyaev-Zeldovitch (S-Z) distances to 41 clusters give a value of km/s/Mpc in an E-deS universe (Reese et al. 2002); furthermore any clumping of the X-ray emitting gas would lower the actual value by up to . The 4 simple gravitational lens systems (PG1115+080, SBS1520+530, B1600+434, HE2149-2745) for which time delays have been reliably measured yield km/s/Mpc if the lenses are assumed to have isothermal halos of dark matter, while it would be km/s/Mpc if the lenses instead had constant (Kochanek & Schechter (2003). However Koopmans et al. (2003) have recently obtained km/s/Mpc from a detailed reanalysis of the system B1608+656, significantly higher than their previous estimate of km/s/Mpc for this system (Fassnacht et al. 2002). We note that Parodi et al. (2000) find km/s/Mpc using SN Ia (see also Branch 2000).
Fig 2 shows a compilation of distances to Type Ia supernovae, S-Z clusters and gravitationally lensed systems with . The best-fit flat model (not shown) has and km/s/Mpc. Models with , km/s/Mpc and , , km/s/Mpc are shown (solid lines); both fit the data well. The model with , km/s/Mpc (broken line) is clearly a less good fit to the data.
In conclusion a Hubble constant in the range 55-65 km/s/Mpc seems entirely plausible at the present time. The value we require, 46 km/s/Mpc, is still below this range, but perhaps only by . We believe the present paper provides a powerful stimulus for further work on the cosmological distance scale.
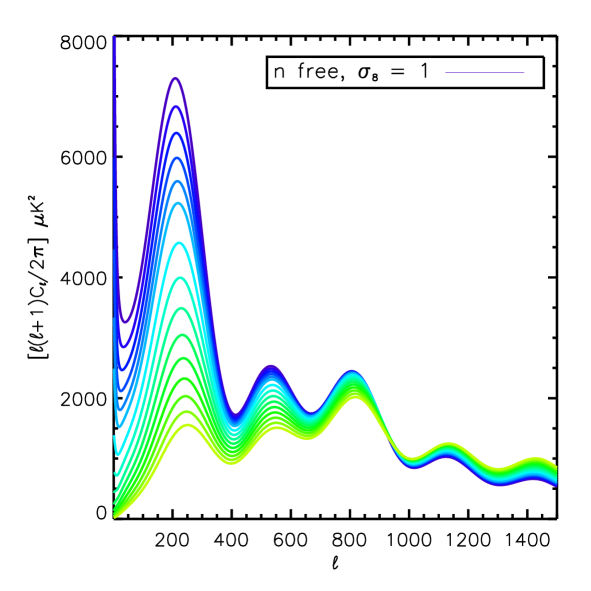
There is however one observational constraint that our E-deS model fails to reproduce quite badly, viz. the amplitude of matter fluctuations on cluster scales ( Mpc). This model has an amplitude of , which is much higher than required to match the local abundance of clusters and weak lensing measurements. The discrepancy is at least at the 5 level, even taking into account the scatter in the determinations from different analyses: current estimates for from clusters and from weak lensing range from to (for ). This is consistent with measurements of peculiar velocity fields, e.g. the redshift-space distortion seen in 2dFGRS on scales Mpc yields for an E-deS universe, where is the linear bias parameter (Hawkins et al. 2002). 444Their best-fit is at the mean redshift of the survey: . Combined with the estimate of from analysis of the bispectrum of 2dFGRS on scales Mpc (Verde et al. 2002), this yields . However, this constraint on the bias, obtained by an elaborate statistical analysis, may not be reliable if the biasing process is more complicated than envisaged in this work. As WMAP cannot probe very small scales, one might imagine that further modification of the primordial spectrum could remove this discrepancy. For example Barriga et al. (2001) invoked a ‘step’ in the spectrum at /h Mpc to decrease significantly below the corresponding value for a H-Z spectrum, and thus accounted for the observed slow evolution of the number density of rich clusters with redshift. However, an examination of the CMB power spectrum normalized to for various power law indices (see Fig. 3) reveals that the implied amplitude on the scale is essentially constant. Thus the recent measurements on this scale by ground-based CMB experiments (Pearson et al. (2002); Kuo et al. (2002); Ruhl et al. (2002); Grainge et al. (2003)), if taken to be reliable, cannot be matched if is made significantly smaller than unity by modifying the primordial spectrum. We conclude therefore that an E-deS model with CDM alone cannot accommodate both data sets, independently of the shape of the primordial spectrum.
4.2 Modifying the matter content
In this last section, we examine whether the above discrepancy can be avoided if we do not restrict ourselves to pure CDM models but modify the matter content. Specifically, we now have evidence that all the known neutrinos have masses which are rather close to each other, with for the electron and muon neutrinos and for the muon and tau neutrinos, indicated respectively by the oscillation interpretation of the Solar and atmospheric neutrino anomalies (see Gonzalez-Garcia & Nir 2003). Moreover the direct kinematic limit on the neutrino mass from the Mainz and Troitsk tritium -decay experiments is 2.2 eV (see Weinheimer 2002). The addition of massive neutrinos is known to damp the power spectrum on scales smaller than their free-streaming length Mpc, and thus to lower (see Primack & Gross 2000). We have therefore introduced 3 quasi-degenerate neutrinos of mass 0.8 eV each and find the following model provides an acceptable fit: , , , Mpc-1, , , . The amplitude on clusters scales is perhaps still too high at , but it is certainly premature to rule out this model for this reason alone.
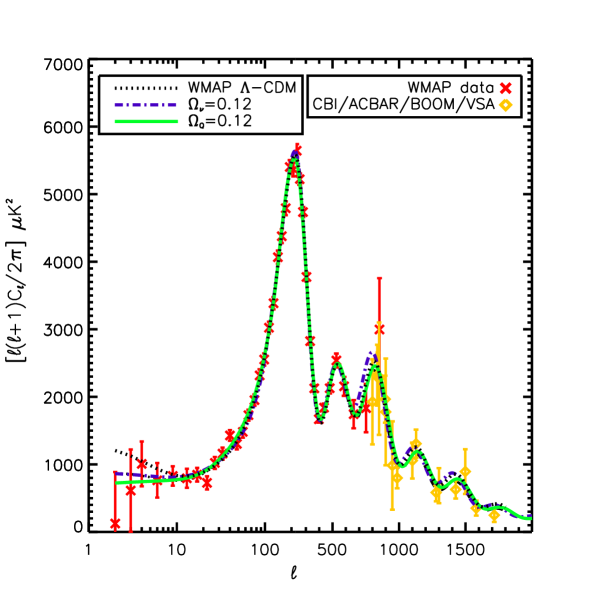
In a second model we introduce a small amount of ‘quintessence’ with . Such possibility arises naturally as an attractor solution of a simple exponential potential: which is well motivated theoretically (Ratra & Peebles 1988; Wetterich 1988) and has been argued to give good agreement with observations with (Ferreira & Joyce 1997; 1998). Indeed, we find that the power at small scales is suppressed in this model compared to pure cold dark matter, yielding an acceptable fit to the CMB and LSS data (with ) for the following parameters: , , , Mpc-1, , , .
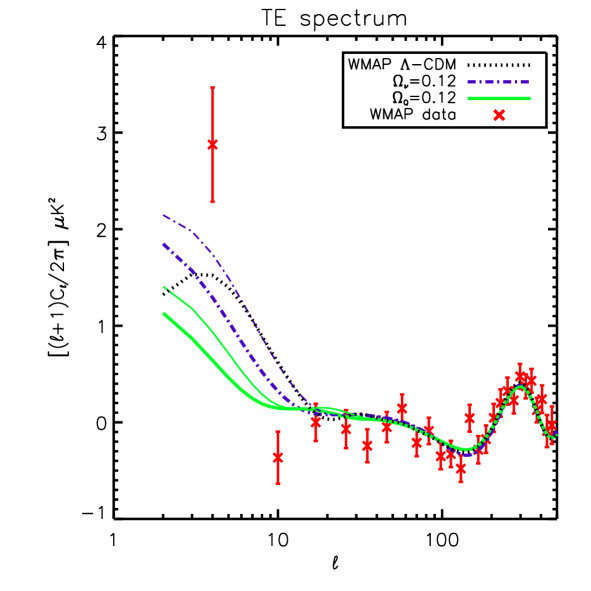
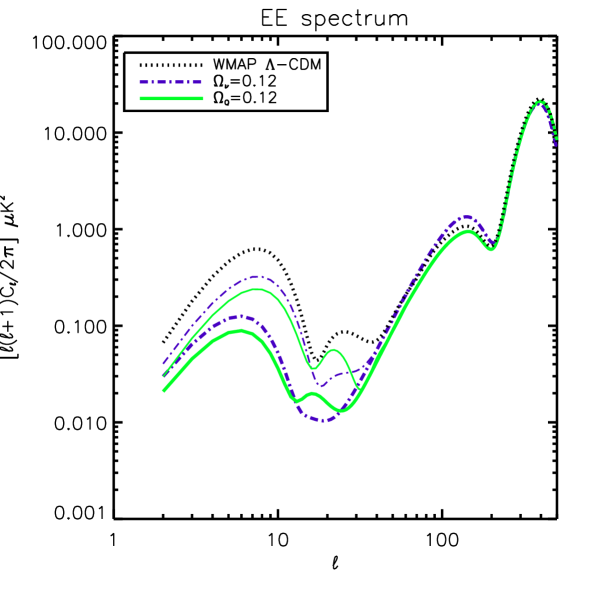
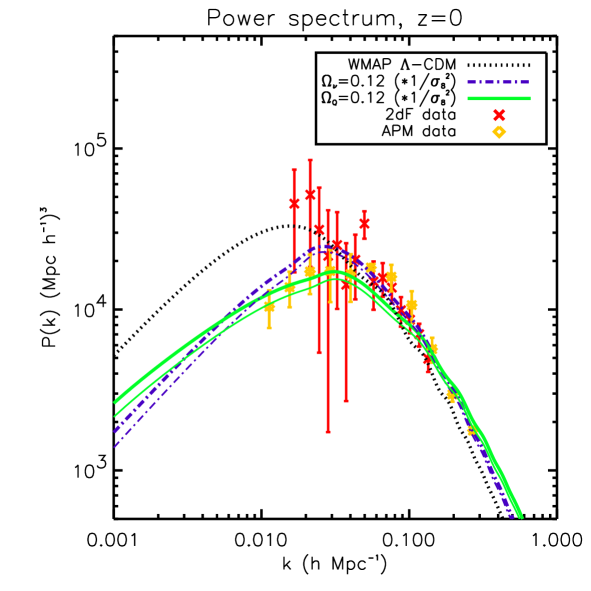
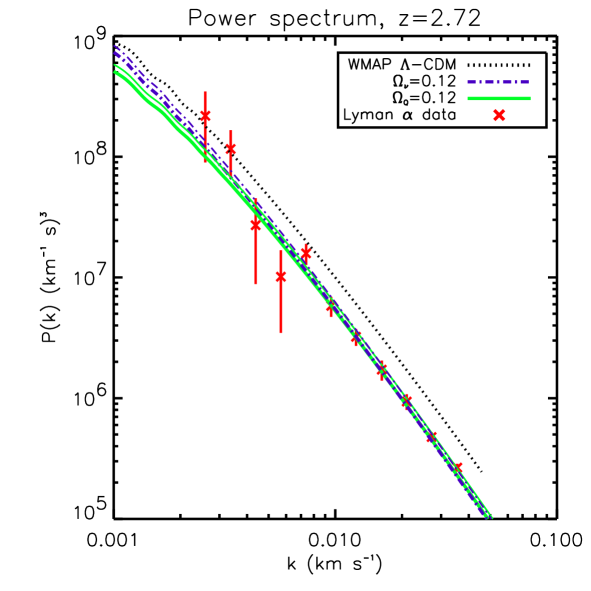
For both cases, the best-fit optical depth to last scattering is significantly smaller than the value of obtained in the WMAP team’s fit to the temperature-polarization cross-correlation (TE) spectrum (Kogut et al. 2003). Nevertheless the predicted TE spectra for our E-deS models are in reasonable agreement with the WMAP data, although the predicted polarization autocorrelation (EE) spectra differ (see Fig. 5). The baryonic content is at the upper end of the range suggested by considerations of primordial nucleosynthesis (Fields & Sarkar 2002). The cluster baryon fraction expected in these two models is (keeping in mind that the ‘dark energy’ component does not cluster on these scales); although low this is consistent with recent estimates (Sadat & Blanchard 2001). It is also necessary to examine the agreement of these models with LSS data, in particular the power spectrum obtained from studies of galaxy clustering and the Lyman- forest. For this purpose we adopt a bias parameter given by . As seen in Fig. 6, both models are then in agreement with the APM power spectrum (Baugh & Efstathiou 1993; Peacock 1997), the 2dFGRS power spectrum (Percival et al. 2001; Tegmark, Hamilton & Xu 2002) and the Ly forest (matter) power spectrum (Croft et al. 2002) which has been used recently to set interesting constraints on models of large scale structure (Douspis, Blanchard & Silk 2001). The model with massive neutrinos provides a particularly good description of LSS data. Such a model has already been considered by Elgarøy & Lahav (2003) as providing a good fit to the 2dFGRS data, but maintaining a constant power law index on large scales as they do, then gives a very poor fit to the WMAP data. We emphasise that although our model is apparently in conflict with the upper bound of quoted by Spergel et al. (2003), this latter bound was obtained under more restrictive asumptions (in particular adopting ‘priors’ on the bias parameter, matter density and Hubble parameter), hence is not sufficiently conservative.
5 Further tests
It is important to devise means of breaking the ‘ degeneracy’ and establish reliably whether we do live in an low matter density universe, and also to devise further tests for independently of the SN Ia Hubble diagram.
Attempts to determine from measurements of peculiar velocity fields have relied on constraining the bias parameter by examination of the statistical properties of the galaxy distribution (e.g. Verde et al. 2002). More detailed examination of the clustering properties of different galaxy populations in the ongoing Sloan digital sky survey will sharpen this test further (Szapudi et al. 2002).
Another approach is based on measurement of the mean relative peculiar velocity of galaxy pairs as a function of their separation (Juskiewicz et al. 2000); a recent application of this method yields , without any prior assumptions concerning the primordial fluctuations or cosmological parameters (Feldman et al. 2003). However the inclusion of a component of hot dark matter, as in our model, will affect peculiar velocities on the relevant small scales, so simulations incorporating non-linear effects are necessary to assess the robustness of this test (J. Silk, private communication).
Measurements of ‘cosmic shear’ induced through gravitational lensing offer yet another possible way to determine the matter density and bias separately (see Van Waerbeke et al. 2002). Again several ongoing and proposed large area surveys should allow adequate control of systematic uncertainties and enable cosmological parameters to be obtained without prior assumptions.
A complementary approach is to seek direct evidence in the CMB for the presence of a cosmological constant. As mentioned earlier, the absence of the expected ISW effect at large angular scales in the WMAP data has been disappointing in this respect, but might be regarded as a statistical fluctuation. The expected ISW correlations with other tracers of large-scale structure are being sought but results are not definitive as yet. The power spectrum of the E-mode polarization offers an additional way to distinguish among models. As seen in Fig. 5, the nominal EE spectra for our E-deS models differ significantly from that of the concordance model since the best-fit value of is smaller. However the value of for our E-deS models can be raised to be closer to the WMAP value of 0.17 (thin lines in Fig. 5) without significantly affecting the or fits. Hopefully analysis of further data from WMAP, as well as other CMB experiments, can distinguish between these possibilities. The most stable difference between our E-deS models and the CDM concordance model is in fact the matter power spectrum shape in the range /Mpc, which galaxy surveys may be able to investigate, provided the possible biasing is reliably understood on these scales (Durrer et al. 2003).
6 Discussion
We have shown that when the assumption of a single power law for the primordial fluctuation spectrum is relaxed, an Einstein-de Sitter model with zero can fit the CMB data as well as if not better than the best CDM concordance model. This is a clear and direct indication that the CMB data alone does not require the introduction of a non-zero cosmological constant. However a model with only cold dark matter cannot simultaneously match both the CMB data and the amplitude of matter fluctuations as indicated by clusters, peculiar velocity fields and weak lensing measurements. We have shown further that acceptable Einstein-de Sitter models are indeed possible provided they comprise a small amount of a ‘dark energy’ component which does not cluster on small scales, such as relic neutrinos with masses of order eV or a pressureless quintessence field. These models have a low, but as we have argued, not unimaginable, Hubble constant. Moreover this provides further motivation for laboratory experiments sensitive to eV-scale neutrino masses, since a detection would provide crucial input for cosmology.
Given the need to suppress the amplitude of fluctuations on cluster scales in any model, we conclude that extant CMB and LSS data actually imply the existence of a dark component beyond cold dark matter, with a density contribution of about 10% of the critical density and an equation of state corresponding to conventional pressureless matter. Such models reproduce quite well the observed properties of the large scale structure of of universe without further adjustment.
The essential conclusion is that an Einstein-de Sitter universe is not yet ruled out, as seems to be generally believed. Although there is indeed conflict with some astronomical observations, we have argued that these data are not established beyond reasonable doubt. Given the severe coincidence problem associated with a classical cosmological constant as well as the profound implications of de Sitter space-time for fundamental physics (e.g. Witten 2001, Banks & Dine 2001, Dyson, Kleban & Susskind 2002), it is surely worth investigating these issues further.
Acknowledgements.
We thank the Referee for her critical and helpful comments. We also acknowledge useful discussions with David Spergel, Alain Riazuelo, Joe Silk and Ludovic Van Waerbeke. M.D. is supported by a CMBNet fellowship.References
- (1) Adams, J. A., Cresswell, B., & Easther, R. 2001, Phys. Rev. D, 64, 123514
- (2) Adams, J. A., Ross, G. G., & Sarkar, S. 1997a, Phys. Lett. B, 391, 271
- (3) Adams, J. A., Ross, G. G., & Sarkar, S. 1997b, Nucl. Phys. B, 503, 405
- Bahcall et al. (2000) Bahcall, N. A., Cen, R., Davé, R., Ostriker, J. P., & Yu, Q. 2000, ApJ, 541, 1
- Bahcall et al. (1999) Bahcall, N. A., Ostriker, J. P., Perlmutter, S., & Steinhardt, P. J. 1999, Science, 284, 1481
- (6) Banks, T., & Dine, M. 2001, J. High. Ener. Phys., 0110, 012
- Barriga et al. (2001) Barriga, J., Gaztañaga, E., Santos, M. G., & Sarkar, S. 2001, MNRAS, 324, 977
- Bartlett et al. (2000) Bartlett, J. G., Douspis, M., Blanchard, A., & Le Dour, M. 2000, A&AS, 146, 507
- Baugh & Efstathiou (1993) Baugh, C. M., & Efstathiou, G. 1993, MNRAS, 265, 145
- Bennett et al. (2003) Bennet C.L. et al. (WMAP collab.) 2003, ApJ, submitted [astro-ph/0302207]
- (11) Blanchard, A. 1984, A&A, 132, 359
- Blanchard et al. (2000) Blanchard, A., Sadat, R., Bartlett, J. G., & Le Dour, M. 2000, A&A, 362, 809
- Borgani et al. (1999) Borgani, S., Rosati, P., Tozzi, P., & Norman, C. 1999, ApJ, 517, 40
- (14) Boughn, S. P., & Crittenden, R. 2003, Nature, submitted [astro-ph/0305001]
- Boughn, Crittenden & Koehrsen (2002) Boughn, S. P., Crittenden, R. G., & Koehrsen, G. P. 2002, ApJ, 580, 672
- (16) Branch, D. 1998 ARA&A, 36, 17
- (17) Bridle, S., Lewis, A.M., Weller, J., & Efstathiou, G. 2003, MNRAS, submitted [astro-ph/0302306]
- (18) Cline, J.M., Crotty, P., & Lesgourgues, J. 2003, J. High. Ener. Phys., submitted [astro-ph/0304558]
- (19) Contaldi, C., Peloso, M., Kofman, L., & Linde, A. 2003, Phys. Rev. D, submitted [astro-ph/0303636]
- Croft et al. (2002) Croft, R. A. C., Weinberg, D. H., Bolte, M., Burles, S., Hernquist, L., Katz, N., Kirkman, D., & Tytler, D. 2002, ApJ, 581, 20
- (21) Davis, M., Efstathiou, G., Frenk, C. S., & White, S. D. M. 1985 ApJ, 292, 371
- (22) de Bernardis, P. et al. (BOOMERanG collab.) 2000, Nature, 404, 955
- Douspis et al. (2003) Douspis, M., Bartlett, J. G., & Blanchard, A. 2003, A&A, submitted
- Douspis, Blanchard & Silk (2001) Douspis, M., Blanchard, A., & Silk, J. 2001, A&A, 380, 1
- Durrer, Gabrielli, Joyce, & Sylos Labini (2003) Durrer, R., Gabrielli, A., Joyce, M., & Sylos Labini, F. 2003, ApJ, 585, L1
- (26) Dyson, L., Kleban, M., & Susskind, L. 2002 J. High. Ener. Phys., 0210, 011
- (27) Efstathiou G. 2003a, MNRAS, in press [astro-ph/0303127]
- (28) Efstathiou G. 2003b, MNRAS, submitted [astro-ph/0306431]
- Efstathiou, Bond & White (1992) Efstathiou, G., Bond, J. R., & White, S. D. M. 1992, MNRAS, 258, 1P
- Elgaroy & Lahav (2003) Elgarøy O., & Lahav O. 2003, J. Cosm. Astropart. Phys., 0304, 004
- (31) Fassnacht, C. D., Xanthopoulos, E., Koopmans, L. V. E., & Rusin, D. 2002, ApJ, 581, 823
- (32) Feldman, H. A. et al. 2003, [astro-ph/0305078]
- (33) Fields, B., & Sarkar, S. 2002, Phys. Rev. D, D66, 010001-162
- (34) Ferreira, P. G. & Joyce, M. 1997, Phys. Rev. Lett.79, 4740
- (35) Ferreira, P. G. & Joyce, M. 1998, Phys. Rev. D68, 3503
- (36) Fosalba, P., & Gaztañaga, E. 2003, Phys. Rev. Lett., submitted [astro-ph/0305468]
- Freedman et al. (2001) Freedman, W. L. et al. (HST Key Project collab.) 2001, ApJ, 553, 47
- Freese, Frieman, & Olinto (1990) Freese, K., Frieman, J. A., & Olinto, A. V. 1990, Phys. Rev. Lett.65, 3233
- (39) Gaztañaga, E., Wagg, J., Multamäki, T., Montaña, A., & Hughes, D.H. 2003, MNRAS, submitted [astro-ph/0304178]
- (40) German, G., Ross, G. G., & Sarkar, S. 2001, Nucl. Phys. B, 608, 423
- (41) Gonzalez-Garcia, M. C., & Nir, Y. 2003, Rev. Mod. Phys., 75, 345
- Grainge et al. (2003) Grainge, K. et al. (VSA collab.) 2003, MNRAS, submitted [astro-ph/0212495]
- Halverson, N. W. et al. (2002) Halverson, N. W. et al. (DASI collab.) 2002, ApJ, 568, 38
- (44) Hanany, S. et al. (MAXIMA collab.) 2000, ApJ, 545, L5
- (45) Hawkins, E. et al. (2dFGRS collab.) 2002, MNRAS, submitted [astro-ph/0212375]
- Henry (1997) Henry, J. P. 1997, ApJ, 489, L1
- (47) Hu, W., & Dodelson, S. 2002, ARA&A, 40, 171
- (48) Juszkiewicz, R., Ferreira, P. G., Feldman, H. A., Jaffe, A. H., & Davis, M. 2000, Science, 287, 109
- Kinney (2001) Kinney, W. H. 2001, Phys. Rev. D, 63, 043001
- (50) Kochanek, C. S., & Schechter, P. L. 2003, [astro-ph/0306040]
- (51) Kogut, A. et al. (WMAP collab.) 2003 ApJ, submitted [astro-ph/0302213]
- (52) Koopmans, L. V. E., Fassnacht, C. D., Blandford, R. D., & Surpi, G. 2003 ApJ, submitted [astro-ph/0306216]
- Kuo et al. (2002) Kuo, C. L. et al. (ACBAR collab.) 2002, [astro-ph/0212289]
- Leibundgut (2000) Leibundgut, B. 2000, A&A Rev., 10, 179
- Leibundgut (2001) Leibundgut, B. 2001, ARA&A, 39, 67
- Lewis et al. (2000) Lewis, A., Challinor, A., & Lasenby, A. 2000, ApJ, 538, 473
- (57) Linde, A.D. 1990, “Particle Physics & Inflationary Cosmology” (Chur: Harwood Academic)
- Lineweaver et al. (1997) Lineweaver, C., Barbosa, D., Blanchard, A., & Bartlett, J. 1997, A&A, 322, 365
- Lineweaver & Barbosa (1998) Lineweaver, C. H. & Barbosa, D. 1998, ApJ, 496, 624
- Lyth & Riotto (1999) Lyth, D. H., & Riotto, A 1999, Phys. Rep., 314, 1
- (61) Lyth, D. H., & Stewart, E. D. 1996, Phys. Rev. D, 53, 1784
- Maddox et al. (1990) Maddox, S. J., Efstathiou, G., Sutherland, W. J., & Loveday, J. 1990, MNRAS, 242, 43P
- Markevitch (1998) Markevitch, M. 1998, ApJ, 504, 27
- (64) Mould, J. R. et al. (HST Key Project collab.) 2000, ApJ, 529, 786
- Mukherjee & Wang (2003) Mukherjee, P., & Wang, Y. 2003, ApJ, submitted [astro-ph/0303211]
- Myers et al. (2003) Myers, A. D., Shanks, T., Outram, P. J., & Wolfendale, A. W. 2003, MNRAS, submitted [astro-ph/0306180]
- Netterfield et al. (1995) Netterfield, C. B., Jarosik, N., Page, L., Wilkinson, D., & Wollack E. 1995, ApJ, 445, L69
- (68) Nolta, M. et al. 2003, ApJ, submitted [astro-ph/0305097]
- (69) Parodi, B. R., Saha, A., Sandage, A., & Tammann, G. A. 2000, ApJ, 540, 634
- Peacock (1997) Peacock, J. A. 1997, MNRAS, 284, 885
- Pearson et al. (2002) Pearson, T.J. et al. (CBI collab.) 2002, ApJ, submitted [astro-ph/0205388]
- (72) Peebles, P. J. E., & Ratra, B. 2002, Rev. Mod. Phys., 75, 599
- (73) Peiris, H. V. et al. (WMAP collab.) 2003 ApJ, submitted [astro-ph/0302225]
- Percival et al. (2001) Percival, W. J. et al. (2dFGRS collab.) 2001, MNRAS, 327, 1297
- (75) Perlmutter, S. et al. (SCP collab.) 1999, ApJ, 517, 565
- (76) Primack, J., & Gross, M. 2000, in “Current Aspects of Neutrino Physics”, Caldwell, D.O. (ed.), Springer (2000) p.287.
- (77) Ratra, B. & Peebles, P. 1988, Phys. Rev. D37, 3406
- (78) Reese, E. D., Carlstrom, J. E., Joy, M., Mohr, J. J., Grego, L., & Holzapfel, W.L. 2002, ApJ, 81, 53
- Reichart et al. (1999) Reichart, D. E. et al. 1999, ApJ, 518, 521
- Reiprich, & Böhringer (2002) Reiprich, T. H., & Böhringer, H. 2002, ApJ, 567, 716
- (81) Riess, A. G. et al. (High-z Supernova Search Team) 2000, AJ, 116, 1009
- (82) Ross, G. G., & Sarkar, S. 1996, Nucl. Phys. B, 461, 597
- Roussel, Sadat & Blanchard (2000) Roussel, H., Sadat, R., & Blanchard, A. 2000, A&A, 361, 429
- Rowan-Robinson (2002) Rowan-Robinson, M. 2002, MNRAS, 332, 352
- (85) Rowan-Robinson, M. 2003, in preparation
- Ruhl et al. (2002) Ruhl, J. E. et al. (BOOMERanG collab.) 2002, [astro-ph/0212229]
- Sadat & Blanchard (2001) Sadat, R., & Blanchard, A. 2001, A&A, 371, 19
- Sadat, Blanchard & Oukbir (1998) Sadat, R., Blanchard, A., & Oukbir, J. 1998, A&A, 329, 21
- (89) Sarkar, S. 1996, Rep. Prog. Phys., 59, 1493
- Scott et al. (1996) Scott, P. F. et al. (VSA collab.) 1996, ApJ, 461, L1
- Seljak (2002) Seljak, U. 2002, MNRAS, 337, 769
- Sheth, & Tormen (1999) Sheth, R. K. & Tormen, G. 1999, MNRAS, 308, 119
- (93) Silk, J., & Turner, M. S. 1987, Phys. Rev. D, 35, 419
- (94) Smoot G. F. et al. (COBE collab.) 1992, ApJ396, L1
- Spergel et al. (2003) Spergel D. N., et al. (WMAP collab.) 2003, ApJ, submitted [astro-ph/0302209]
- (96) Szapudi, I. et al. (SDSS collab.) 2002, ApJ, 570, 75
- Tegmark et al. (2003) Tegmark, M., de Oliveira-Costa, A., & Hamilton A. 2003, [astro-ph/0302496]
- Tegmark, Hamilton & Xu (2002) Tegmark, M., Hamilton, A. J. S., & Xu, Y. 2002, MNRAS, 335, 887
- Uzan (2003) Uzan J.-P., Kirchner, U., & Ellis, G. F. R. 2003, [astro-ph/0302597]
- (100) Van Waerbeke, L., Tereno, I., Mellier, Y., & Bernardeau, F. 2002, [astro-ph/0212150]
- Vauclair et al. (2003) Vauclair S., et al. 2003, in preparation
- (102) Verde, L. et al. (2dFGRS collab.) 2002, MNRAS, 335, 432
- Verde et al. (2003) Verde, L. et al. (WMAP collab.) 2003, ApJ, submitted [astro-ph/0302218]
- Viana, & Liddle (1999) Viana, P. T. P. & Liddle, A. R. 1999, MNRAS, 303, 535
- (105) Weinheimer, C. 2002, [hep-ex/0210050]
- (106) Wetterich, C. 1988, Nucl. Phys. B, 302, 668
- (107) White, M. J., Scott, D., Silk, J., & Davis, M. 1995, MNRAS, 276, L69
- White et al. (1993) White, S. D. M., Navarro, J. F., Evrard, A. E., & Frenk, C. S. 1993, Nature, 366, 429
- (109) Witten, E. 2001, [hep-th/0106109]
- (110) Zaritsky, D. 1999, AJ, 118, 2824