Abundant in the pre–stellar core L1544
We have detected the 372 GHz line of ortho– towards the pre–stellar core L1544. The strongest emission ( 1 K) occurs at the peak of the millimeter continuum emission, while measurements at offset positions indicate that is confined within 20″, where CO is highly depleted. The derived abundance of 10-9 is comparable with previous estimates of the electron abundance in the core, which suggests that is the main molecular ion in the central 20″ (2800 AU) of L1544. This confirms the expectations that is dramatically enhanced in gas depleted of molecules other than . The measured abundance even exceeds the present model predictions by about a factor ten. One possibility is that all CNO–bearing neutral species, including atomic oxygen, are almost completely ( 98%) frozen within a radius of 2800 AU.
Key Words.:
ISM: individual(L1544), molecules – radio lines: ISM1 Introduction
The last few years have seen a boom of the studies of molecular deuteration in star forming regions, triggered by the discovery of a large fraction of doubly deuterated formaldehyde in the low mass protostar IRAS16293-2422 (Ceccarelli et al. (1998); Loinard et al. (2000)), where the measured D2CO/H2CO ratio is 25 times larger than in Orion (Turner (1990)). It is now clear that IRAS16293-2422 is not unusual, for all Class 0 protostars show similar or larger D2CO/H2CO ratios (Loinard et al. (2002)). Formaldehyde is not unusual either, as other molecules present astonishing deuteration degrees. Notable examples are methanol, whose deuterated forms are as abundant as the main isotopomer (Parise et al. (2002)), or ammonia, where not only the doubly deuterated form (Roueff et al. (2000); Loinard et al. (2001)), but also the triply deuterated form (van der Tak et al. (2002); Lis et al. (2002)) has been detected.
The picture emerging from those studies is that this extreme molecular deuteration starts during the pre-collapse phase, when the gas is cold and dense (Ceccarelli et al. (2001)). Whether formed in the gas phase (e.g. Roberts & Millar (2000)) or on the grain surfaces (Tielens (1983); Caselli et al. 2002a ), deuterated isotopomers of neutral species are stored into the grain mantles, and released back into the gas phase during the collapse phase, as the dust is heated by the new born star. This picture has been substantially confirmed by the recent observations of Bacmann et al. (2003), who measured D2CO/H2CO% in a sample of pre-stellar cores presenting large degrees of CO depletion (Bacmann et al. (2002)). A decisive factor for the large observed deuteration seems in fact to be the CO depletion: the larger the CO depletion, the larger the molecular deuteration. This suggests that the enhanced molecular deuteration is the product of gas phase chemistry, given that CO depletion leads to an increase of the / abundance ratio (Dalgarno & Lepp (1984)) and thus stimulates the formation of deuterated molecules, mainly produced in ion–neutral reactions with .
Evidently, the key molecule for fully understanding the molecular deuteration process is indeed H2D+. Unfortunately, the only H2D+ transition observable from ground based telescopes, the ortho-H2D+ transition, lies at 372 GHz, next to an atmospheric band which makes the observation rather difficult. As a result, the search of H2D+ has been a very frustrating business for about two decades (e.g. Phillips et al. (1985); Pagani et al. (1992); van Dishoeck et al. (1992); Boreiko & Betz (1993)), and although several massive protostars have been targetted, H2D+ has been so far detected, with a relatively low signal (main beam temperature, T K), in only two low mass protostars: NGC1333–IRAS4 (Stark et al. (1999)) and IRAS16293-2422 (Stark et al., in preparation). We decided to re-start the H2D+ search in sources with the largest expected H2D+/H ratio, even where the excitation conditions of the 372 GHz line may not be the most favorable. And, since molecular deuteration is indeed dramatically enhanced during the pre-collapse phase of low mass protostars, we decided to search for H2D+ in the best studied pre-stellar core.
L1544 consists of a dense core surrounded by a low density envelope which is undergoing extended infall (Tafalla et al. (1998); Williams et al. (1999)). From dust emission and absorption observations, we know that the core has a central density of about 106 inside a radius = 2500 AU (the “flattened” region), followed by density fall–off until a radius of about 10000 AU (Ward–Thompson et al. (1999); Bacmann et al. (2000)). Molecular species such as CO, CS, and CCS are highly depleted at densities above 105 , or inside radii of 6000 AU (Caselli et al. (1999); Ohashi et al. (1999); Tafalla et al. 2002). On the other hand, molecules such as , and do not show signs of depletion, probably because of the volatility of their precursor (Bergin & Langer (1997); Caselli et al. 2002b , hereafter CWZ). Indeed, and have been used to study gas kinematics (Caselli et al. 2002c ) and the ionization degree (CWZ) of the high density core nucleus. The column density ratio toward the dust peak was determined to be 0.2, in agreement with chemical models which take into account differential depletion of molecular species in centrally concentrated clouds (Aikawa et al. 2001; CWZ). These models predict fractional abundances of to be 10-10, a value which can be tested by the present observations.
2 Observations and Results
During two nights in October 2002, we observed the dense core L1544 in the transition of ( GHz), using the Caltech Submillimeter Observatory on Mauna Kea. The spectra were taken in wobbler switching mode, with a chop throw of 300. The central position (the peak of the 1.3 mm continuum dust emission map of Ward–Thompson et al. (1999)), as well as the 4 positions offset by in Right Ascension and Declination were observed. The rms reached were of the order of 110 mK for the central position and 60-90 mK for the others. We used as backend an acousto-optical spectrometer with 50 MHz bandwidth. The velocity resolution, as measured from a frequency comb scan, is 0.101 km s-1. The beam efficiency at GHz was measured on Saturn during the observations, and found to be 0.65 for a FWHM beam size. Pointing was monitored every couple of hours and found to be better than 3.
In Table LABEL:tgauss we report the integrated intensity, velocity, and line width of the five observed spectra. In Fig. 1 the peak spectrum is shown together with the average spectrum obtained by summing the four off-peak spectra.
| Offset | |||
|---|---|---|---|
| (″, ″) | (K ) | () | () |
| (0,0) | 0.460.04 | 7.230.02 | 0.470.04 |
| (0,20) | 0.220.03 | 7.170.04 | 0.490.08 |
| (-20,0) | 0.260.04 | 7.110.06 | 0.690.15 |
| (20,0) | 0.250.03 | 7.220.03 | 0.590.08 |
| (0,-20) | 0.260.04 | 7.260.05 | 0.680.11 |
First, the most striking feature of the (110–) line at the dust peak is its intensity (1 K), which is at least ten times stronger than any other previously detected line (Stark et al. (1999)), suggesting that pre–stellar core conditions favour the production of . The second important result is the detection of a strong signal (0.4 K) about 20″ from the center. Assuming that the emission is constant within a certain radius and then drops to zero, one can estimate by convolving the predicted integrated intensity profile with the CSO beam and comparing it with the data. This comparison, shown in Fig. 2 (thin and dashed curves), gives 15″– 20 ″, consistent with = 17″, the size of the “flattened” region observed in the millimeter continuum emission. In the case of a power law distribution of the integrated intensity (; dotted curve in Fig. 2), the estimated (convolved) size is = 17″. This result suggests that the bulk of the emission is concentrated within the highly depleted high density core nucleus.
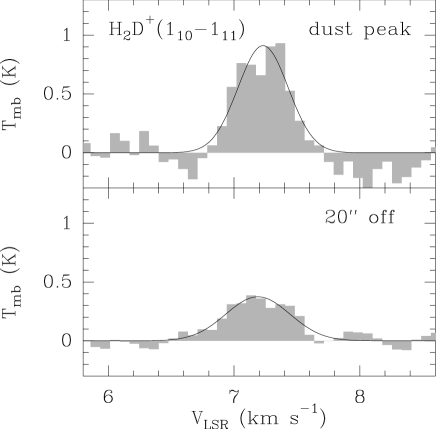

The central line profile shows a dip at the rest velocity which may be due to the kinematics of the emitting gas (in analogy with other molecular ion profiles; see Caselli et al. 2002c ) or it may indicate that the line is optically thick. We will get back on this issue in a future paper where the velocity structure of the L1544 core will be included in a detailed radiative transfer code (van der Tak et al., in preparation).
3 Column density and abundance
As shown in Fig. 2, the emission appears to be concentrated within a radius of 2800 AU. In this region, the gas temperature is predicted to be 7 K (Evans et al. (2001); Galli et al. 2002), although molecular data suggest larger temperatures ( 9–10 K; Tafalla et al. 2002, Bacmann et al. (2002)). However, because of the large amount of gas phase depletion (see Sect. 4), it is likely that molecular tracers do not provide information on the gas temperature in the central 2800 AU. Assuming LTE conditions ( = 7 K), we can immediately determine the optical depth () of the (110–) line:
| (1) |
where =0.910.11 K at the peak, = 2.7 K is the cosmic background temperature, and = with = = 17.9 K. Assuming a spontaneous transition coefficient = 1.0810-4 s-1, the total column density of ortho– is:
| (2) |
so that at the dust peak, where 1 and the linewidth is 0.47 (Table LABEL:tgauss), we obtain = 2.41013 . At the low assumed temperatures, where the ortho to para ratio is close to 1 (Gerlich et al. 2002), we deduce a total column density of 4.81013 , about three times larger than (see CWZ).
To gauge the abundance, the above estimate of the total column density has been divided by the molecular hydrogen column density derived from the 1.3 mm continuum emission of Ward–Thompson et al. (1999), smoothed at a resolution of 22″ (=1.11023 ): . This value is only four times lower than the estimated electron abundance in the L1544 center ( 210-9, CWZ), suggesting that is one of the major ions in the gas phase (see Sect. 4).
In case of subthermal emission, the line optical depth and the total column density increase. For example, if = 6 K, = 2.8 and the total column density becomes 1.21014 . This corresponds to 110-9, so that . We note that = 6 K is the minimum excitation temperature possible to have a solution of eq. (1) in the case of an optically thick ( 0.5) line with = 0.9 K. At the off–positions (20″ or 2800 AU from the dust peak), where 81022 , the derived abundance is 2.310-10 (if = 7 K) and 4.010-10 (if = 6 K), a factor of about two lower than toward the dust peak.
We also carried out a radiative transfer analysis using the Monte Carlo program by Hogerheijde & van der Tak (2000)111http://talisker.as.arizona.edu/michiel/ratran.html. The density profile was taken from Tafalla et al. (2002), whereas dust temperatures are from Galli et al. (2002). Only thermal line broadening was included. Term energies, statistical weights and Einstein A coefficients were taken from the JPL catalog (Pickett et al. (1998)). Besides collisional excitation, for which we used the scaled radiative rates proposed by Black et al. (1990), radiation from the cosmic microwave background and thermal radiation by local dust are taken into account, using grain opacities from Ossenkopf & Henning (1994). The abundance of was assumed to be constant within a radius and zero at . Model results are compared to line profiles at the center and offset positions to constrain the abundance and . The best-fit abundance is /= 10-9, where calibration uncertainty allows a 50% decrease. Models with = 20–25 arcsec give good matches to the line fluxes at both the center and the offset positions. The optical depth at line center along the central pencil beam is 2.73. Here we limited our analysis to a static cloud. In a future paper (van der Tak et al., in prep.) we will explore the effects of including a velocity structure in the radiative transfer code.
4 Chemistry
The main result of this study is that has been detected for the first time in a pre–stellar core. The observed () line has a main beam temperature of 1 K, and the emission is concentrated in a region with radius of 2800 AU, roughly coincident with the so–called “flattened region” seen in the millimeter dust continuum emission, where the density is slowly changing with radius (; see André et al. (2000)) and/or the temperature is around 7 K (Evans et al. (2001); Galli et al. 2002).
The data have been analysed with a simple analytical model and with a Monte Carlo radiative transfer code. The derived abundance ( 10-9) is consistent with the electron fraction estimated by CWZ in the center of L1544. This implies that is the main molecular ion in the core center. The simple chemical code of CWZ, constrained by observations of several molecular ions, predicts 710-11 in the center of L1544, about one order of magnitude less than that deduced from the present data. A similar abundance ( 610-11) at the cloud center was also predicted by the detailed chemical model of Aikawa et al. (2001), coupled with the Larson–Penston dynamical evolution which best reproduced the L1544 observational results.
CWZ found that to match the observed / (0.24) and / (0.06) column density ratios toward the L1544 center one needs to (i) allow differential depletion of molecular species onto dust grains (in particular, has to be more volatile than CO, to maintain a large fraction of and in the core center); and (ii) maintain a significant fraction of atomic oxygen in the gas phase, to limit the deuterium fractionation to the observed values ( 0.2). As a by–product, was predicted to be abundant ( 10-9) in the core center.
The results of the present paper apparently contradict the CWZ conclusions, because the large abundance can only be produced if all neutral species, including O and , are essentially frozen onto dust grains (see also Bergin et al. (2002)). In fact, only in this case can the abundance reach values close to the electron abundance. This can be seen with a simple chemical model, where the ingredients are H, , HD, , , CO, , and electrons. We neglect recombination onto dust grains, which is likely not to be an important process for the above molecular ions in the high density core nucleus, where small grains and PAHs – significant carriers of negative charges (Lepp & Dalgarno (1988)) – are expected to be deposited onto bigger grains (e.g. Ossenkopf & Henning 1994). Following section 2 of Caselli (2002), assuming conditions appropriate for the central 2500 AU of L1544 (kinetic temperature = 7 K, = 106 , see Galli et al. 2002), we have:
| (3) |
where is the forward rate coefficient of the proton–deuteron exchange reaction +HD + (see below), and is defined as the ratio between the “canonical” CO abundance (9.510-5; Frerking et al. (1982)) and the observed . The abundance can be estimated from the charge conservation equation, so that we obtain (with rate coefficients as in Caselli 2002):
| (4) |
Equations (3) and (4) directly furnish the and abundances as a function of , once is known. Figure 3 shows the result of this simple chemical analysis, with (thin curves) and (dashed curves) as a function of , assuming = 210-9 (as roughly determined by CWZ in the L1544 center). We note that eqn. (3) breaks down at large values of ( 100), when dissociative recombination starts to dominate over proton transfer reactions. In the figure, two different values for have been used: (i) the “standard” value = 1.510-9 cm3 s-1 (upper curves), and (ii) = 3.510-10 cm3 s-1, recently measured by Gerlich et al. (2002) (lower curves). The two data points in the figure are our present estimates of , the arithmetic means of the abundances calculated with =6 and 7 K (Sect. 3): 7.210-10 and 3.1510-10 at the peak and off–peak positions, respectively. The corresponding values are from CWZ. The error bars indicate the uncertainties in the excitation temperature (1 K; Sect. 3) for estimating , and calibration errors affecting the determination of (about 30%; CWZ).
The observed abundances cannot be reproduced unless the CO depletion factor is 20 in the off position and 40 at the peak (the “Monte Carlo abundance” indicates an even higher , 70), whereas the observed values are 7 and 9, at the same positions. Although our comprehension of the deuteration process in cold gas may be substantially incomplete, it is certain that measurements of are contaminated by the CO emission along the line of sight coming from regions with marginal CO depletion, so that the resultant ’s estimates are lower limits of the total amount of CO freeze out at the core center. Indeed, the chemical model of CWZ predicts an almost complete (99%) CO freeze out within the central 2800 AU of L1544. Following the model results in Fig. 3, the predicted values at the observed abundances correspond to 1 and 2 at the off and central positions, respectively.

If other neutrals reacting with and , such as O and , are present in the gas phase, the predicted abundance will drop as in the case of a low value (e.g. Caselli 2002). Thus, the present observations also require a heavy depletion of O (99%) and (97%). A way to overcome the apparent inconsistency with CWZ (who need significant fractions of molecular nitrogen and atomic oxygen in the gas phase at 2800 AU) and well reproduce both the moderate value ( 0.2) of the column density ratio as well as the large abundance (which implies 2) is to increase the depletion rate of O and within the “flattened” region. This case requires central core densities of about 107 within a radius of 1000 AU, which is consistent with current mm continuum dust emission measurements if the central temperature drops to values of 7 K (e.g. Evans et al. (2001)). The conclusion is that present observations are compatible with being the most abundant molecular ion and with a total depletion of elements heavier than helium in the central 2800 AU. This can also explain the lower abundance derived in the direction of NGC1333–IRAS4 ( = 310-12; Stark et al. (1999)), where the young stellar object heats up the central zones, thus allowing the return of solid phase molecules back into the gas phase. A more comprehensive chemical model, coupled with a detailed radiative transfer code is however needed to better understand the whole data set available for L1544 and we are going to explore this in a future paper (van der Tak et al., in preparation).
Acknowledgements.
The authors are grateful to Malcolm Walmsley for discussion and to Dominic Benford for his assistance during the observations. The CSO is supported by NSF grant AST 99-80846. PC acknowledges support from the MIUR project “Dust and Molecules in Astrophysical Environments”.References
- (1) Aikawa, Y., Ohashi, N., Inutsuka, S., Herbst, E., Takakuwa, S. 2001, ApJ, 552, 639
- André et al. (2000) André, P., Ward–Thompson, D., Barsony, M. 2000, Protostars and Planets IV (Book - Tucson: University of Arizona Press; eds Mannings, V., Boss, A.P., Russell, S. S.), p. 59
- Bacmann et al. (2000) Bacmann, A., André, P., Puget, J.-L., Abergel, A., Bontemps, S., Ward–Thompson, D. 2000, A&A, 361, 555
- Bacmann et al. (2002) Bacmann,A., Lefloch,B., Ceccarelli,C., Castets,A., Steinacker,J., Loinard,L. 2002, A&A, 389, L6
- Bacmann et al. (2003) Bacmann,A., Lefloch,B., Ceccarelli,C., Steinacker,J., Castets,A., Loinard,L. 2003, ApJ, 585, L55
- Bergin et al. (2002) Bergin, E. A., Alves, J., Huard, T. Lada, C. J. 2002, ApJ, 570, L101
- Bergin & Langer (1997) Bergin, E. A., Langer, W. D. 1997, ApJ, 486, 316
- Black et al. (1990) Black, J. H., van Dishoek, E. F., Willner, S. P., Woods, R. C. 1990, ApJ, 358, 459
- Boreiko & Betz (1993) Boreiko, R. T., Betz, A. L. 1993, ApJ, 405, L39
- (10) Caselli, P. 2002, P&SS, 50, 1133
- (11) Caselli, P., Stantcheva, T., Shalabiea, O., Shematovich, V.I., Herbst, E. 2002a, P&SS, 50, 1257
- Caselli et al. (1999) Caselli, P., Walmsley, C. M., Tafalla, M., Dore, L., Myers, P. C. 1999, ApJ, 523, L165
- (13) Caselli,P., Walmsley, C.M., Zucconi,A., Tafalla,M., Dore,L., Myers, P.C. 2002c, ApJ, 565, 331
- (14) . 2002b, ApJ, 565, 344 (CWZ)
- Ceccarelli et al. (1998) Ceccarelli, C., Castets, A., Loinard, L., Caux, E., Tielens, A. G. G. M. 1998, A&A, 338, L43
- Ceccarelli et al. (2001) Ceccarelli, C., Loinard, L., Castets, A., Tielens, A. G. G. M., Caux, E., Lefloch, B., Vastel, C. 2001, A&A, 372, 998
- Dalgarno & Lepp (1984) Dalgarno, A., Lepp, S. 1984, ApJ, 287, L47
- Evans et al. (2001) Evans, N. J., II, Rawlings, J. M. C., Shirley, Y. L., Mundy, L. G. 2001, ApJ, 557, 193
- Frerking et al. (1982) Frerking, M. A., Langer, W. D., Wilson, R. W. 1982, ApJ, 262, 590
- (20) Galli, D., Walmsley, M., Goncalves, J. 2002, A&A, 394, 275
- (21) Gerlich, D., Herbst, E, Roueff, E. 2002, P&SS, 50, 1275
- Hogerheijde & van der Tak (2000) Hogerheijde, M. R., van der Tak, F. F. S 2000, A&A, 362, 697
- Lepp & Dalgarno (1988) Lepp, S., Dalgarno, A. 1988, ApJ, 335, 769
- Lis et al. (2002) Lis, D. C., Roueff, E., Gerin, M., Phillips, T. G., Coudert, L. H., van der Tak, F. F. S., Schilke, P. 2002, ApJ, 571, L55
- Loinard et al. (2000) Loinard, L., Castets, A., Ceccarelli, C., Tielens, A. G. G. M., Faure, A., Caux, E., Duvert, G. 2000, A&A, 359, 1169
- Loinard et al. (2001) Loinard, L., Castets, A., Ceccarelli, C., Caux, E., Tielens, A. G. G. M. 2001, ApJ, 552, L163
- Loinard et al. (2002) Loinard, L., Castets, A., Ceccarelli, C., Lefloch, B., Benayoun, J.-J., Caux, E., Vastel, Ch., Dartois, E., Tielens, A. G. G. M. 2002, P&SS, 50, 1205
- Ohashi et al. (1999) Ohashi, N., Lee, S. W., Wilner, D. J., Hayashi, M. 1999, ApJ, 518, L41
- (29) Ossenkopf, V., Henning, Th. 1994, A&A, 291, 943
- Pagani et al. (1992) Pagani, L., Wannier, P.G., Frerking, M.A., et al. 1992, A&A, 258, 472
- Parise et al. (2002) Parise, B., Ceccarelli, C., Tielens, A. G. G. M., et al. 2002, A&A, 393, L49
- Phillips et al. (1985) Phillips, T. G., Blake, G. A., Keene, J., Woods, R. C., Churchwell, E. 1985, ApJ, 294, L45
- Pickett et al. (1998) Pickett, H. M., Poynter, R. L., Cohen, E. A., et al. 1998, J. Quant. Spectrosc. Radiat. Transfer, 60, 883
- Roberts & Millar (2000) Roberts, H., Millar, T. J. 2000, A&A, 364, 780
- Roueff et al. (2000) Roueff, E., Tiné, S., Coudert, L. H., Pineau des Forêts, G., Falgarone, E., Gerin, M. 2000, A&A, 354, L63
- Stark et al. (1999) Stark, R., van der Tak, F. F. S., van Dishoeck, E. F. 1999, ApJ, 521, L67
- Tafalla et al. (1998) Tafalla,M., Mardones,D., Myers, P.C., Caselli,P., Bachiller,R., Benson, P.J. 1998, ApJ, 504, 900
- (38) Tafalla, M., Myers, P. C., Caselli, P., Walmsley, C. M., Comito, C. 2002, ApJ, 569, 815
- Tielens (1983) Tielens, A. G. G. M. 1983, A&A, 119, 177
- Turner (1990) Turner, B. E. 1990, ApJ, 362, L29
- van der Tak et al. (2002) van der Tak, F. F. S., Schilke, P., Müller, H. S. P., Lis, D. C., Phillips, T. G., Gerin, M., Roueff, E. 2002, A&A, 388, L53
- van Dishoeck et al. (1992) van Dishoeck, E. F.; Phillips, T. G.; Keene, J.; Blake, G. A. 1992, A&A, 261, L13
- Ward–Thompson et al. (1999) Ward–Thompson, D., Motte, F., André, P. 1999, MNRAS, 305, 143
- Williams et al. (1999) Williams, J. P., Myers, P. C., Wilner, D. J., di Francesco, J. 1999, ApJ, 513, L61