The Chandra Detection of Galactic Center X-ray Features G359.89-0.08 and G359.54+0.18
Abstract
We report on the detection of two elongated X-ray features G359.89-0.08 and G359.54+0.18 in the Galactic center (GC) region using the Chandra X-ray Observatory. G359.89-0.08 is an elongated X-ray feature located 2′ in projection south of the center of the Galaxy, SgrA∗. This X-ray feature source is partially coincident with a slightly curved (“wisp”-like) non-thermal radio source. The X-ray spectrum of G359.89-0.08 can be best characterized as non-thermal, with a photon index of 2. The morphological and spectral characteristics of the X-ray and radio emission associated with G359.89-0.08 are best interpreted as the synchrotron emission from a ram-pressure confined pulsar wind nebula. G359.54+0.18 is one of the most prominent radio non-thermal filaments (NTFs) in the GC region, located 30′ in projection from SgrA∗. A narrow (10″ ) filament of X-ray emission appears to arise from one of the two strands that comprise the radio NTF. Although the photon statistics are poor for this source, the X-ray emission is also likely to be non-thermal in nature. Several models for the production of X-ray emission in G359.54+0.18 are discussed.
1 Introduction
The central region of our Galaxy hosts many unique and filamentary radio features (e.g., Yusef-Zadeh, Morris, & Chance 1984; Morris & Serabyn 1996; Ekers et al. 1983; Anantharamaiah et al. 1991). Most prominent of these are the non-thermal filaments (NTFs), the brightest of which extend for up to 20′ (50 pc at the 8.0 kpc distance of the Galactic center (GC)). Radio polarization measurements show that the NTFs represent synchrotron radiation from relativistic particles on local magnetic fields (Yusef-Zadeh & Morris 1987; Lang, Morris & Echevarria 1999).
These NTFs are oriented in directions essentially perpendicular (within 20) to the Galactic plane and are thought to trace a large-scale poloidal magnetic field configuration in the GC region. However, the origin of the magnetic field arrangement in the GC, and the source of particles and their acceleration in the NTFs remain unclear (e.g., Morris & Serabyn 1996). Less extensive versions of these NTFs are also apparent throughout the GC region, and show the same physical characteristics, but on smaller scales (Ho et al. 1985; Morris & Yusef-Zadeh 1989; Lang, Morris & Echevarria 1999; LaRosa et al. 2000; LaRosa, Lazio & Kassim 2001).
We have detected three elongated X-ray features in the recent Chandra X-ray Observatory GC survey (GCS), which covers the central 300 pc along the Galactic plane (Wang, Gotthelf & Lang 2002a). Most interestingly, we find that the elongated X-ray features are apparently associated with either NTFs or NTF-like radio sources. These apparent associations, if confirmed, have strong implications for understanding the nature of the radio NTFs. In particular, if these X-ray features are also due to synchrotron emission, they directly trace the sites where relativistic particles are freshly accelerated (because the X-ray particles have an extremely short lifetime). Identifying such features would allow us to locate the origin of the particle acceleration in the mysterious radio NTFs.
The analysis of one of these X-ray features, G0.13-0.11 has already been presented (Wang, Lu, & Lang 2002b). A detailed study of the morphology and spectrum of the X-ray and radio emission suggest that G0.13-0.11 represents the leading-edge of a pulsar wind nebula (PWN), produced by a pulsar moving in a strong magnetic field environment. The main body of this PWN is traced by a radio protrusion that may also be related to the well-known nonthermal Radio Arc NTF (Yusef-Zadeh et al. 1984). Here, we present the analysis and interpretation of two similarly-shaped X-ray features, G359.89-0.08 and G359.54+0.18. It should be noted that recently, Sakano et al. (2002) have presented Chandra and XMM-Newton data on G359.89-0.08. This source has also been recorded by Baganoff et al. (2003) in their paper on the Chandra observation of the central 15′ (38 pc) of the Galaxy. However, neither of the two papers has provided a complete physical interpretation of the detected X-ray emission in this unusual elongated X-ray feature. In this paper, we present the detection (2), analysis (3) and discussion (46) of the X-ray emission in the features G359.89-0.08 and G359.54+0.18.
2 X-ray Observation and Data Reduction
The X-ray data of G359.89-0.08 were obtained using the Advanced CCD Imaging Spectrometer (ACIS-I) onboard the Chandra X-ray Observatory in two observations pointed at Sgr A∗: OBS#242 was taken on 1999 September 21 with a total exposure time of 51.1 ks; OBS#1561 consists of a series of short exposures from 2000 October 26 to 2001 September 28 with a total integration time of 49.8 ks. G359.89-0.08 is on the ACIS-I2 chip, with an off-axis angle of 37. G359.54+0.18 was covered by two of the Chandra GC Survey observations (OBS#2268, and #2275) (Wang et al. 2002a). OBS#2268 observation was made on 2001 July 20 with a total integration time of 11.0 ks, and OBS#2275 was made on 2001 July 20, with a total integration time of 12.0 ks. The diffuse X-ray emission feature is located on the ACIS-I0 chip in OBS#2268, with an offset of 35 from the aimpoint, and in OBS#2273, the feature is located on the ACIS-I3 chip, with an offset of 7′ from the aimpoint.
We calibrated the data using the most recent version of the Chandra data processing software CIAO. After excluding time intervals of high background we obtained 40.2 ks net exposure for OBS #242, 35.7 ks for OBS #1561, 10.9 ks for OBS # 2268, and 11.6 ks for OBS#2275. While the pointing astrometry of OBS #242 is better than 1 (Baganoff et al. 2003) and thus no additional calibration is required, we corrected offsets, 064 and 205 in the R.A. and Dec, for OBS #1561, and -011 and 212 in the R.A. and Dec, for OBS # 2268 and #2275, using the online web tool (http://asc.harvard.edu/cal/ASPECT/fix_offset/fix_offset.cgi). The data from OBS #242 and #1561 were co-added in the sky coordinates to improve the counting statistics.
The Chandra data are sensitive to the photons in the energy range 0.5-10 keV for OBS #242 and #1561 and 1-10 keV for OBS # 2268 and #2275 because of an imposed lower energy telemetry cutoff (Wang et al. 2002a). The data, corrected for the CTI effect of the CCD chips with the Penn State software (Townsley et al. 2000), provide a spectral resolution of . The spatial resolution, a function of the location in the ACIS-I CCD, is in the range of a couple of arcseconds for the X-ray features discussed here. Both the spatial and spectral resolution in this study are largely limited by the limited counting statistics of the data.
3 X-ray Properties
3.1 G359.89-0.08
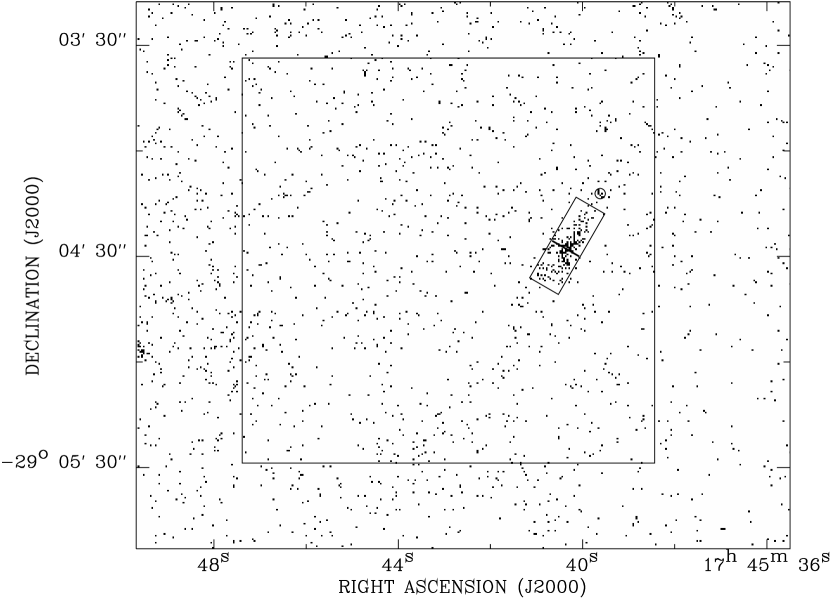
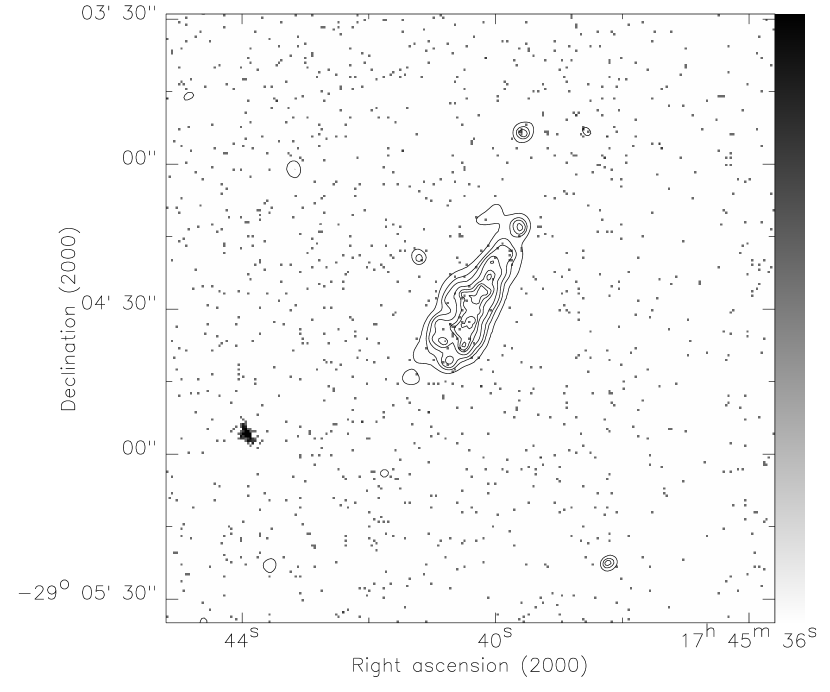
Figure 1 shows the count distribution in this field for energies of 4.09.0 keV. An elongated concentration of X-ray emission is present near R.A., DEC. (J2000) = 17h45m404, -290429, or l,b = 359.89, -0.08. Thus, this source will be referred to as G359.89-0.08. Figure 2 shows the 0.5-4.0 keV band count map overlaid with the contours of the smoothed count distribution in the 4.0-9.0 keV band. The elongation of G359.89-0.08 occurs in the NW–SE direction with a length of 24 and a width of . We also detect a point-like source (CXOU J174539.6-290413; Figures 1 & 2) with a total of 11 counts detected within an 15 radius; the expected number of the local background counts is and therefore this detection has a signal-to-noise ratio of . A comparison of the count rates of the source in the two observations (OBS #242 and #1561) shows no significant variability.
The energy distributions of G359.89-0.08 and CXOU J174539.6-290413 are similar, with counts almost entirely in the energy range above 4.0 keV as Figures 1 and 2 illustrate well. There is no significant soft X-ray enhancement (4 keV) associated with either G359.89-0.08 or the point-like source. This implies that they are at about the same distance and that the line-of-sight X-ray absorbing gas column density may be quite large ( cm-2).
We carried out a spectral analysis of G359.89-0.08 by extracting the spectrum of the extended source from the rectangular region illustrated in Figure 1. The large box in Figure 1 represents the region used for determination of the local background. Because of the limited counting statistics, the spectral fits alone cannot be used to distinguish between models. For example, the spectrum of G359.89-0.08 can be fitted by either a thermal plasma (Raymond & Smith 1977) or a simple power law model, both with a strong interstellar medium (ISM) absorption. Figure 3 shows the best-fit power law model to the data of G359.89-0.08. The parameters of the two different model fits are listed in Table 1. The best fit to the absorbing gas column density is 3.7 cm-2, which, for the power law model gives an X-ray (0.2-10 keV) luminosity of Lx 1.61034 erg s-1, where is the distance in units of the distance of the GC, 8 kpc. There is some excess near 6.7 keV (Figure 3), however it is most likely due to background noise fluctuations as this excess is not seen in the XMM data of G359.89-0.08 (Sakano et al. 2002).
With only 11 total counts from the point-like source, CXOU J174539.6-290413, little can be said about its spectral shape. We thus assume a power law spectrum with a photon index of 2 and the same absorbing gas column density as the best-fit value obtained for G359.89-0.08 (3.7 cm-2). The detected count flux of 1.4 counts s-1 then gives a 0.2-10 keV X-ray luminosity of 8 1032 erg s-1, where is the distance in units of 8 kpc.
3.2 G359.54+0.18
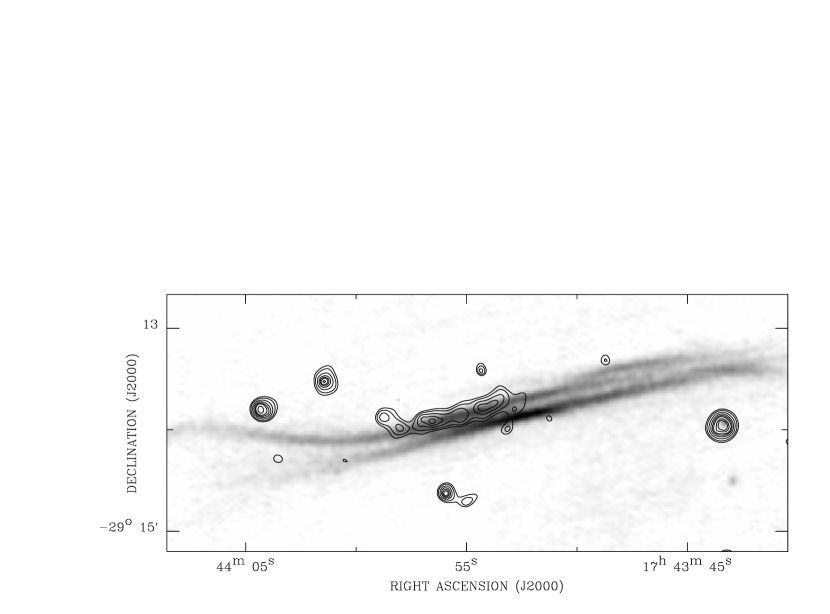
Figure 4 shows the X-ray emission that appears to be associated with the well-known radio NTF G359.54+0.18. This X-ray feature has a strikingly linear morphology extending for nearly 2′, and corresponds exactly with the brightest portion of the northern of the two radio filaments in G359.54+0.18. While the width of the X-ray feature is broaden in the smoothed image because of the limited counting statistics, the boundary of the X-ray emission appears to correspond well to the width of the radio filament. This clearly suggests that these two features are likely to be physically related. Figure 5 shows the average (but unsmoothed) X-ray intensity as a function of distance perpendicular to its long axis (a cross-cut) from the raw counts image. The width of this X-ray filament is resolved to be ″. The distance of the radio NTF G359.54+0.18 has now been constrained to be within a few hundred parsecs of the GC (Roy 2003); therefore, the linear size of the X-ray emitting region is approximately 10 pc 0.5 pc.
The spectral shape of G359.54+0.18 is more difficult to characterize with the only 70 counts collected in the 1-10 keV range. We find that the spectrum of G359.54+0.18 is consistent with a power law with a photon index equal to 2 and an X-ray-absorbing gas column density of cm-2, typical for a source in the GC region. The inferred X-ray luminosity of the filament, Lx(0.2-10 keV) is 2.4 erg s-1. Alternatively, the spectrum can also be characterized by a Raymond-Smith (1977) thermal plasma of a temperature 2 keV and a similar luminosity as the above power law fit.
4 Radio Properties
Both G359.89-0.08 and G359.54+0.18 have prominent and unusual radio counterparts. We discuss the radio properties of these sources in the following.
4.1 G359.89-0.08
Previous radio data on G359.89-0.08 were originally obtained by Yusef-Zadeh & Morris (1987) with the Very Large Array (VLA) radio telescope at 20 cm. These observations of this region, in addition to other VLA archive data, were reprocessed and imaged by Lang et al. (1999). For this study we have re-imaged both the Yusef-Zadeh & Morris (1987) and Lang et al. (1999) data to make new estimates of the flux of radio features for comparison with the X-ray (see below).
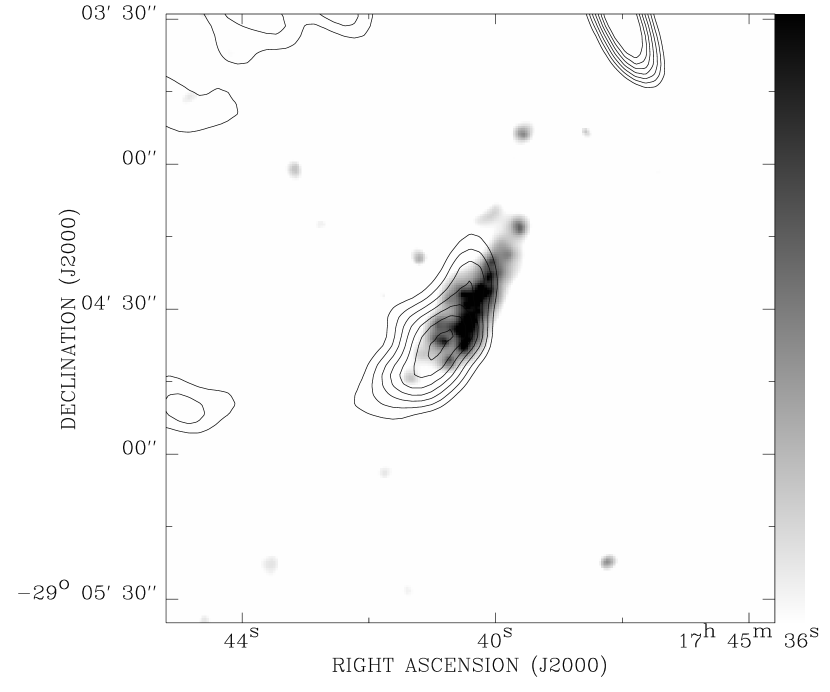
Figure 6 shows an overlay of the X-ray emission in G359.89-0.08 and the radio continuum emission from the corresponding “radio wisp”, first recognized by Ho et al. (1985) at 2 and 6 cm and was then shown at 20 cm (e.g., Yusef-Zadeh & Morris 1987). Ho et al. (1985) suggested that the wisp was part of a supernova remnant (SNR) shell with a nonthermal spectrum (0.4; where S). However, this radio spectral index was not well determined (Ho et al. 1985). We have re-calculated the radio spectral index, using the radio data at 2 and 20 cm. We measured the integrated 20 cm flux of the wisp to be 720 mJy. This flux, together with the 2 cm flux of the wisp of 447 mJy (Ho et al. 1985), suggests that the index is 0.2. The radio luminosity ( Hz, derived from the 2 cm flux density and using this spectral index of 0.2) is 2.9 erg s-1.
Interestingly, only part of the X-ray wisp G359.89-0.08 and the radio wisp overlap spatially. The X-ray intensity centroid of G359.89-0.08 shows an offset of 10 toward the NW from the centroid of the radio wisp. Although this position offset needs to be explained, the radio wisp is likely to be physically associated with G359.89-0.08. In the 86′ region around the GC, excluding the SgrA complex, only two isolated nonthermal diffuse radio features have been detected (Ho et al. 1985); the chance for a random superposition of the centroid of the X-ray wisp within the boundaries of one of these two nonthermal radio features is . Furthermore, the other two elongated X-ray features detected so far in the GCS (G0.13-0.11 (Wang et al. 2002b); G359.54+0.18, this paper) also have radio counterparts, and we thus expect that the spatial and morphological coincidence between G359.89-0.08 and the radio wisp represents a physical association.
Coil & Ho (1999; 2000) have also argued for a possible association between the radio wisp and a molecular “streamer”, which is projected between the so-called 20 km s-1 cloud M-0.13-0.08 and Sgr A∗. The lower tip of the streamer coincides spatially with the radio wisp and G359.89-0.08 (see Figure 4 of Coil & Ho (2000) and Figure 6 in this paper). The molecular hydrogen column density of the main body of this streamer is about 1.41024 cm-2. Since the NH3 emission strength at the lower tip is 1/5 of the NH3 emission strength of the main body of the streamer (Coil & Ho 1999; 2000), the molecular hydrogen column density along the line of sight to G359.89-0.08 is about 31023 cm-2, consistent with the difference (2.71023 cm-2) between the X-ray absorbing column densities to G359.89-0.08 (3.7 cm-2) and to Sgr A∗ (1023 cm-2) (e.g., Baganoff et al. 2001a). Therefore, G359.89-0.08 is most likely located behind this streamer. We assume here that G359.89-0.08 has a distance comparable with that to the GC and scale the luminosities with , the distance in units of 8 kpc (distance to GC).
4.2 G359.54+0.18
In the case of G359.54+0.18, VLA observations of this source were originally made by Yusef-Zadeh, Wardle, & Parastaran (1997) with the VLA at 3.6 and 6 cm. Their observations (Figure 4) show that this radio NTF extends for 8′ (20 pc) and has a very prominent bi-furcated morphology, which is common of most of the GC NTFs. The 90 to 20 cm spectral index of G359.54+0.18 has been calculated to be =0.8 (Anantharamaiah et al. 1991). The radio luminosity ( Hz, (derived from a 6 cm flux density of 150 mJy from the region where the X-ray emission is arising and using =0.8) is 5 erg s-1. Similar to the other well-studied NTFs (e.g. Lang et al. 1999), G359.54+0.18 is characterized by strongly linearly polarized emission and a well-ordered magnetic field along its long axis (Yusef-Zadeh et al. 1997). The 6 to 3.6 cm spectral index is slightly steeper (by =0.5) along the eastern side of the NTF than that of the center of the NTF and western side, which may indicate a steepening in the energy distribution to the East.
5 Nature of the X-ray Emission
5.1 Thermal Emission
The spatial and spectral properties of the X-ray and radio emission presented above provide useful constraints on the physical nature of the X-ray emission in G359.89-0.08 and G359.54+0.18. In the case of G359.89-0.08, the thermal hypothesis requires a temperature 13.5 keV (Table 1). No diffuse X-ray feature with such a high thermal temperature is known in the Galaxy. If the X-ray emission is really thermal, the closest possibility is that G359.89-0.08 could be a background cluster of galaxies, although the temperature is still considerably higher than the typical cluster temperature (2–108 K; Fabian 1994). The small sizes and high fluxes of the observed X-ray emission (Table 1) would further imply a very distant rich cluster. Morphologically, such a cluster should appear relatively round, inconsistent with the wisp-like appearance of G359.89-0.08. This distant cluster hypothesis would also be difficult to interpret the high flux and offset morphology of the apparently associated radio emission. We thus conclude that G359.89-0.08 is not a thermal source.
The thermal interpretation of the X-ray emission associated with G359.54+0.18 has the similar difficulties. In particular, the X-ray morphology of G359.54+0.18 is even more narrowly distributed than G359.89-0.08. If the filament represents a cylinder with a diameter of 10, the volume of the X-ray-emitting region is then 5 cm3 at the distance of 8 kpc. ¿From the X-ray luminosity, we can further infer the thermal pressure to be dynes cm-2. Because the magnetic field in the GC region is likely to be in the range of 10-4 to 10-3 Gauss (e.g., Ananthanamaiah et al. 1991; Morris & Serabyn 1996), the corresponding magnetic field pressure (4 to 4 dynes cm-3/2) is probably not high enough to confine the thermal plasma in such a narrow region. Furthermore, the thermal origin of the X-ray-emitting gas provides no explanation for the nonthermal radio emission, which is much more extended linearly. Therefore, a thermal origin of G359.54+0.18 is problematic.
5.2 Nonthermal Emission
Nonthermal X-ray emission in these two sources may arise from synchrotron emission or from inverse Compton scattering. The presence of the nonthermal radio emission is a testimony of the presence of relativistic electrons. Furthermore, it is important to note that the luminosity is considerably greater in X-ray than the radio for both G359.89-0.08 and G359.54+0.18 (§3-4).
The intensity of the inverse Compton scattering is proportional to the energy density of a photon field . In the GC, the energy density is generally dominated by Far-IR photons, (e.g., Odenwald & Fazio 1984), compared with the energy density of the microwave background radiation, erg cm-3, or the radio synchrotron radiation contained in the radio NTFs and NTF-like features, 10-16 erg cm-3 (e.g. Yusef-Zadeh et al. 1997; Ho et al. 1985). The Far-IR energy density may be even comparable to the magnetic field energy density (410 erg cm-3, where is the magnetic field strength in units of 0.1 mG; Morris and Serabyn 1996).
The intensity ratio of inverse-Compton scattering over synchrotron radiation is approximately , where is the index of the assumed power law particle energy distribution. The electron that scatters a far-IR photon ( m) to X-ray ( keV) would typically have a Lorentz factor , and is about an order of magnitude less energetic than the particles that are responsible for the observed radio synchrotron emission from the NTFs (). Therefore, in principle, the inverse-Compton scattering can produce an X-ray intensity that rivals the synchrotron radiation, if is significantly less 2 and/or there is a local enhancement of the far-IR photon field. But it is difficult for the inverse-Compton scattering mechanism to explain the fact that the X-ray arises only from part of the radio-emitting regions, especially in the case of G359.54+0.18. The two strands in this NTF are too close positionally for only one of them be affected by a local enhancement of the far-IR photon field, for example. Although IC scattering can not be ruled out completely, it appears that synchrotron radiation provides a more natural interpretation of the X-ray emission of both G359.89-0.08 and G359.54+0.18, which is detailed in the following.
6 Origins of Relativistic Particles
6.1 G359.89-0.08
6.1.1 Supernova Remnant (SNR) Origin
The first possibility for the origin of synchrotron particles in G359.89-0.08 is the nearby SNR (G359.92-0.09) (Ho et al. 1985; Coil & Ho 2000). Evidence for this SNR is present in the morphology of the radio features in this region, including the apparent circular structure consisting of the radio “wisp” and other shell-like radio sources (Ho et al. 1985). It has been proposed that the SNR shock could generate particles that may be energetic ( eV) enough to produce X-ray synchrotron radiation (e.g., Koyama et al. 1995).
However, it is difficult to associate G359.89-0.08 with this SNR G359.92-0.09. Firstly, if the X-ray synchrotron emission arises from a SNR, a tight spatial correlation between the radio and X-ray emission would be expected if they both arise from particles accelerated by the same SNR shock. Indeed, such correlations are observed in all SNR shells that are dominated by nonthermal radio and X-ray emission, such as SN 1006 (Reynolds & Gilmore 1986; Koyama et al. 1995; Willingale 1996) and RCW 86 (Borkowski et al. 2001). The 10-30″ offset between the radio and X-ray emission in G359.89-0.08, is therefore unusual and difficult to explain, although we can not exclude the possibility that the radio and X-ray features are from different parts of the SNR shell and in projection, overlap.
Secondly, the molecular line (NH3) study of the central 15 pc region of the Galaxy also shows evidence for the interaction between an SNR and the surrounding molecular streamers (Coil & Ho 2000). The velocity gradients and velocity displacement of the southern tip of a molecular streamer thought to be interacting with G359.89-0.08 suggests that the SNR is partially in front of the molecular gas and likely to be embedded in a distribution of disturbed molecular material (Coil & Ho 2000). However, the high X-ray-absorbing gas column density along the line of sight to G359.89-0.08 suggests that the X-ray emission must lie behind some enhancement of molecular material (4) and is not consistent with an X-ray detection of a SNR shell or arc that lies in front of the molecular gas. The X-ray emission in G359.89-0.08 is unlikely to be a detection of the SNR G359.92-0.09.
For these reasons, we conclude that G359.89-0.08 is unlikely part of the SNR shell and that the X-ray synchrotron emission does not arise from shocked-SNR particles.
6.1.2 Pulsar Wind Nebula (PWN)
We find that the X-ray properties of G359.89-0.08 are consistent with what is expected for a PWN. Both the spectrum and the luminosity of G359.89-0.08 are quite typical for a PWN, which usually has a nonthermal X-ray spectrum with photon index 1.1 to 2.4 and 0.2-10.0 keV X-ray luminosities from 41032 to 21037 erg s-1 (e.g., Gotthelf & Olbert 2001).
Naturally, we speculate that X-ray source CXCGCS J174539.6-290413 is the putative pulsar that powers the PWN. Indeed, the X-ray characteristics of this source, though weakly constrained, are consistent with being an isolated young pulsar at the similar distance as G359.89-0.08 (e.g., Becker & Trümper 1997). ¿From the X-ray luminosities of both the source and G359.89-0.08, we estimate the spin-down power of the pulsar as 4 erg/s (Seward-Wang’s 1988; Becker & Trümper 1997)
The wisp morphology of G359.89-0.08 and the location of the source CXCGCS J174539.6-290413 further suggest that they form a ram-pressure confined PWN (e.g., Wang, Li, & Begelman 1993). When a pulsar moves supersonically in a medium, a bow shock is expected to develop ahead of the pulsar. The pulsar wind is thermalized at the reverse shock, which can lead to acceleration of particles just as in a normal PWN. The ram-pressure of the bow shock then sweeps up the shocked pulsar wind material into a trail in the direction opposite to the pulsar motion. The pulsar wind material in this trail is relativistic plasma and can have a bulk motion that is mildly relativistic. Such systems have been observed recently in N157B (Wang et al. 2001), SNR G5.3-1.0 (Kaspi et al. 2001), and SNR W44 (Frail et al. 1996; Petre et al. 2002).
¿From the length of the X-ray feature 3 lyr sin , where is the angle between the flow direction and the line of sight, we estimate the lifetime of the X-ray emitting particles ( yr , where is the magnetic field strength in units of 10-4 Gauss and is the photon energy in keV). The bulk motion velocity is thus about 0.15 sin, in which a photon energy of 4 keV has been used. With the magnetic field in the GC region in the range of 10-4 to 10-3 Gauss (e.g., Anantharamaiah et al. 1991, Morris & Serabyn 1996), the bulk velocity could be a significant fraction of the speed of light.
The above ram-pressure confined PWN interpretation also provides a natural explanation of the radio wisp and its offset from the X-ray wisp G359.89-0.08. The radio synchrotron particles have a much longer lifetime ( yr ), comparable to, or less than, the age of the pulsar. Thus we expect the radio synchrotron emission from the accumulated particles over the history of the PWN and in a region further offset from the X-ray “trail” (G359.89-0.08). If the centroid of the radio emission represents the location where the pulsar was born, the separation from the pulsar light years then gives an estimate of the pulsar age of , where is the proper motion of the pulsar. In addition, the high polarization (10-20), center-filled morphology, and relatively flat non-thermal radio spectrum (Ho et al. 1985; 4) are all consistent with the properties of a PWN. The ratio of the X-ray (0.2-10 keV) luminosity to radio luminosity (8) is also comparable to PWNe such as 3C58 (e.g., Helfand & Becker 1987) and SNR G54.1+0.3 (Lu et al. 2002). Thus, we conclude that the ram-pressure confined PWN provides a unified explanation for the linear complex formed by the X-ray source CXCGCS J174539.6-290413, the X-ray emission in G359.89-0.08, and the radio counterpart.
We have also tried to study whether there exists any X-ray spectral evolution along G359.89-0.08 with increase distance from the point source CXCGCS J174539.6-290413. Because all the photons softer than 4 keV from G359.89-0.08 have been absorbed by ISM, we calculate the hardness ratios (the 5.5-9.0 keV counts divided by the 4.0-5.5 keV counts) of the two regions illustrated in Figure 1. The hardness ratio of the upper right region is 1.090.15 and that of the lower left region is 1.080.15, indicating that no spectral evolution along the length has been detected. However, this is not evidence against a PWN scenario. In a PWN, the X-ray spectrum of the closest region (from the pulsar) is usually flatter than the X-ray spectrum of the furthest region with a photon index difference of 0.5 (e.g., Lu et al. 2002; Willingale et al. 2001). Such a photon index difference corresponds to a hardness difference of only 0.10, if we assume that the X-ray spectrum of the furthest region is a power law with a photon index of -2.0. Apparently, the quality of the current data is not high enough to permit a spectral evolution study.
6.2 G359.54+0.18
There is no sign for any radio SNR emission near the X-ray filament G359.54+0.18. The NTF G359.54+0.18 is clearly not associated with a SNR and exhibits the morphology and physical properties of the NTFs. In addition, the X-ray emission is detected only in the middle of the northern of the two strands in G359.54+0.18. The southern filament is actually brighter in radio (Figure 5, see also Yusef-Zadeh et al. 1997), which is different from the strong correlation between the surface brightnesses of the nonthermal X-ray and radio emission as seen in SNRs.
Can G359.54+0.18 also be a PWN? There is no evidence for a point-like X-ray source that may represent a young energetic pulsar near G359.54+0.18, and which traces the origin of the relativistic particles. Of course, this lack of a point-like X-ray source alone does not exclude the PWN possibility. The source may be too faint to be detected with the existing data, or the X-ray emission may be beamed away from us. The most serious difficulty of the PWN interpretation is the presence of the two radio filaments and the fact that the X-ray emission is only associated with one of them. One possibility is that the pulsar is moving, and thus on its path, it illuminated the southern strand of G359.54+0.18 in the recent past and is now located near the northern strand of the NTF. Therefore the lack of X-ray emission from the southern strand would then be due to the synchrotron cooling of relativistic particles. The presence of into magnetic field flux tubes may be related to the synchrotron cooling instability of the PWN. But this mechanism does not explain why there are only two adjacent tubes. Furthermore, the radio spectral index of this NTF, =-0.80.1 (Anantharamaiah et al. 1991), is substantially steeper than the typical for PWNe.
Finally, let us examine the particle acceleration via magnetic reconnection. Magnetic reconnection is a source of inductive electric field, which can accelerate electric particles (Blandford 1994). Observational evidence for particle acceleration by magnetic reconnection has been obtained by investigating the hard X-ray emission of solar flares (e.g., Masuda et al. 1994). However, the actual acceleration process is complicated and has not been well understood so far (Blandford 1994). Nevertheless, the co-existence of the two nearly parallel radio filaments makes the magnetic reconnection an attractive interpretation for G359.89-0.08. The orientation of the magnetic field is found to be parallel to the filaments (Yusef-Zadeh et al. 1997), although the direction of the field lines are unknown. If the lines run in opposite directions in the two filaments, the magnetic reconnection might have occurred in a close contact between the two filaments, leading to the acceleration of particles. This may provide a reasonable explanation for the radio emission from the two filaments. But the mechanism still does not explain why the X-ray emission coincides with one of the filaments, not in-between them. Future, deeper X-ray observations are needed to make closer and better comparisons with the existing detailed radio data on this intriguing NTF.
References
- Anantharamaiah (1991) Anantharamaiah, K.R., Pedlar, A., Ekers, R.D., & Goss, W.M. 1991, MNRAS, 249, 262
- Baganoff (2001) Baganoff, F.K., et al. 2001a, Nature, 413, 45
- Baganoff (2003) Baganoff, F.K., et al. 2003, ApJ(submitted), astro-ph/0102151
- Becker (1997) Becker, W., & Trümper, J. 1997, A&A, 326, 682
- Blandford (1994) Blandford, R.D. 1994, ApJS, 90, 515
- Bocchino (1997) Bocchino, F., Maggio, A., & Sciortino, S. 1997, ApJ, 481, 872
- Bock (1998) Bock, D.C., Turtle, A.J., & Green, A.J. 1998, AJ, 116, 1886
- Borkowski (2001) Borkowski, K.J., Rho, J., Reynolds, S.P., & Dyer, K.K. 2001, ApJ, 550, 334
- Coil (1999) Coil, A.L., & Ho, P.T.P. 1999, ApJ, 513, 752
- Coil (2000) Coil, A.L., & Ho, P.T.P. 2000, ApJ, 533, 245
- Figer (1999) Figer, D.F., Kim, S.S., Morris, M., Serabyn, E., Rich, R.M., & McLean, I.S. 1999, ApJ, 525, 750
- Frail (1996) Frail, D.A., Giacani, E.B., Goss, W.M., & Dubner, G. 1996, ApJ, 464, L165
- Gaensler (2001) Gaensler, B.M. 2001, in AIP Conf. Proc. 565, Young Supernova Remnants, ed. S.S. Holt & U. Hwang (New York:AIP), 295
- Gaensler (2002) Gaensler, B.M., Arons, J., Kaspi, V.M., Pivovaroff, M.J., Kawai, N., & Tamura, K. 2002, ApJ, 569, 878
- Gotthelf (2001) Gotthelf, E.V., & Olbert, C.M. 2001, preprint (astro-ph/0112017)
- Govoni (2001) Govoni, F., Feretti, L., Giovannini, G., Böhringer, H., Reiprich, T.H., Murgia, M. 2001, A&A, 376, 803
- Helfand (1987) Helfand, D.J., & Becker, R.H. 1987, ApJ, 314, 203
- Ho (1985) Ho, P.T.P., Jackson, J.M., Barrett, A.H., & Armstrong, J.T. 1985, ApJ, 288, 575
- Kaspi (2001) Kaspi, V.M., Gotthelf, E.V., Gaensler, B.M., & Lyutikov, M. 2001, ApJ, 560, 371
- Kennel (1984) Kennel, C.F., & Coroniti, F.V. 1984a, ApJ, 283, 694
- Kennel (1984) Kennel, C.F., & Coroniti, F.V. 1984b, ApJ, 283, 710
- Koyama (1995) Koyama, K., Petre, R., Gotthelf, E.V., Hwang, U., Matsura, M., Ozaki, M., & Holt, S.S. 1995, Nature, 378, 255
- Lang (1999) Lang, C.C., Morris, M., & Echevarria, L. 1999, ApJ, 526, 727
- LaRosa (2000) LaRosa, T.N., Kassim, N.E., Lazio, T.J., & Hyman, S.D. 2000, AJ, 119, 207
- LaRosa (2001) LaRosa, T.N., Lazio, T.J.W., Kassim, N.E. 2001, ApJ, 563, 163
- Lu (01) Lu, F.J., Aschenbach, B., & Song, L.M. 2001, A&A, 370, 570
- Lu (02) Lu, F.J., Wang, Q.D., Aschenbach, B., Durouchoux, P., & Song, L.M. 2002, ApJ, 568, L49
- Markwardt (1995) Markwardt, C.B., & Ogelman, H. 1995, 375, 40
- Masuda (1994) Masuda, S., Kosugi, T., Hara, H., Tsuneta, S., & Ogawara, Y. 1994, Nature, 371, 495
- Morris (1996) Morris, M., & Serabyn, E. 1996, ARA&A, 34, 645
- Murakami (2000) Murakami, H., Koyama, K., Sakano, M., Tsujimoto, M., & Maeda, Y. 2000,ApJ, 534, 283
- Odenwald (1984) Odenwald, S. F., & Fazio, G. G. 1984, ApJ, 283, 601
- Petre (2002) Petre, R., Kuntz, K.D., & Shelton, R.L. 2002, ApJ, 579, 404
- Raymond (1977) Raymond, J.C., & Smith, B.W. 1977, ApJS, 35, 419
- Rees (1974) Rees, M.J., & Gunn, J.E. 1974, MNRAS, 167, 1
- Reynolds (1986) Reynolds, S.P., & Gilmore, D.M. 1986, AJ, 92, 1138
- Roy (2003) Roy, S. 2003, A&A, in press
- Sakano (2002) Sakano, M., Warwick, R.S., Decourchelle, A., & Predehl, P. 2002, MNRAS(accepted)
- Seward (1988) Seward, F.D., & Wang, Z.R. 1988, ApJ, 332, 199
- Townsley (2000) Townsley, L.K., Broos, P.S., Garmine, G.P., & Nousek, J.A. 2000, ApJ, 534, L139
- Wang (1993) Wang, Q.D., Li, Z.Y., & Begelman, M.C. 1993, Nature, 364, 127
- Wang (2001) Wang, Q.D., Gotthelf, E.V., Chu, Y.H., & Dickel, J.R. 2001, ApJ, 559, 275
- Wang (2002a) Wang, Q.D., Gotthelf, E.V., & Lang, C.C. 2002a, Nature, 415, 148
- Wang (2002b) Wang, Q.D., Lu, F.J., & Lang, C.C. 2002b, ApJ, 581, 1148
- Weisskopf (2000) Weisskopf, M.C., et al. 2000, ApJ, 536, L81
- Willingale (1996) Willingale, R., West, R.G., Pye, J.P., & Stewart, G.C. 1996, MNRAS, 278, 749
- Willingale (2001) Willingale, R., Aschenbach, B., Griffiths, R.G., Sembay, S., Warwick, R.S., Becker, W., Abbey, A.F., & Bonnet-Bidaud, J.-M. 2001, A&A, 365, L212
- Yusef-Zadeh (1987) Yusef-Zadeh, F., & Morris, M. 1987, ApJ, 320, 545
- Yusef-Zadeh (1984) Yusef-Zadeh, F., Morris, M., & Chance, D. 1984, Nature, 310, 557
- Yusef-Zadeh (1997) Yusef-Zadeh, F., Wardle, M., & Parastaran, P. 1997, ApJ, 475, L119


| Model | aaColumn density in units of cm-2. | Temperature(keV)/Photo Index | bb and are absorbed and unabsorbed fluxes, respectively; both in the 0.2-10.0 keV band and in units of 10-12 ergs cm-2 s-1. | bb and are absorbed and unabsorbed fluxes, respectively; both in the 0.2-10.0 keV band and in units of 10-12 ergs cm-2 s-1. | /DOFccDegree of freedom. |
|---|---|---|---|---|---|
| Thermal Plasma | 3.0 | 13.5(9.0) | 0.3 | 1.4 | 20.0/34 |
| Power Law | 3.7 | 1.9 | 0.3 | 2.2 | 20.4/34 |
Note. — The listed uncertainties are at the 90 confidence level.