Variable Stars in Metal-Rich Globular Clusters. II. NGC 6316
Abstract
We present time-series photometry of the metal-rich globular cluster NGC 6316. Our color-magnitude diagrams show a predominantly red-clump horizontal branch morphology with no evidence of the blue extensions seen in NGC 6388 and NGC 6441. Our data are in good agreement with published estimates of the reddening and metallicity provided the cluster has an absolute distance modulus of 15.50 mag. We have discovered more than one dozen long-period variable stars in our field of view, and argue that at least seven of them are members of NGC 6316. We have also discovered four RR Lyrae variables, although only one of them probably belongs to the cluster. The specific frequency of RR Lyrae stars in NGC 6316 is found to be less than 0.4, making it clear that this cluster is a normal, metal-rich globular and is not an analog of NGC 6388 and NGC 6441. We recommend long-term photometric monitoring of NGC 6316 to clarify the nature of the RR Lyrae member candidate as well as the pulsation classes of the long-period variables.
1 Introduction
Historically, the observational study of globular clusters has provided critical tests of stellar structure and evolution theories. In particular, the study of pulsating variable stars in globular clusters has provided tests of stellar theory which complement the matching of isochrones to observed cluster color-magnitude diagrams (CMDs). The types of pulsating variables found in globulars include Long Period Variables (LPVs) on the asymptotic giant branch, population II Cepheids, RR Lyrae variables (RRL) on the horizontal branch, SX Phoenicis stars (population II Scuti stars) on the main sequence or in the blue straggler region, and pulsating white dwarfs. Of these, the LPVs and RRL most easily accessible for study because they are relatively luminous and are commonly found in globular clusters.
Metal-rich globular clusters ([Fe/H] ), with their extremely cool red giant branches (RGBs) and horizontal branches (HBs), are expected to harbor large numbers of LPVs and few or no RRL. NGC 104 (47 Tuc) is often considered to be the prototype. However, two important exceptions have been discovered. In NGC 6388 and NGC 6441, Rich et al. (1997) observed blue HBs extending away from what appear to be ordinary red HB clumps. Subsequently, large numbers of RRL were discovered in both of these clusters (Layden et al., 1999; Pritzl et al., 2001, 2002). The periods of these RRL were unusually long ( days), suggesting that they are atypically luminous.
To date, both observers and theorists have been unable to identify a definitive cause for the blue HB extensions, although many suggestions have been put forward. For example, Rich et al. (1997) suggested that age or dynamical effects could be responsible for the blue HBs. However, no deep photometry has yet been published for these clusters to constrain their ages, and calculations by Rich et al. (1997) indicated that stellar interactions alone are too infrequent to explain the blue HB extensions. From the perspective of stellar theory, Sweigart & Catelan (1998) have suggested that enhanced helium abundance and/or stellar rotation could account for the blue HBs, but subsequent observational evidence (Layden et al., 1999; Moehler, Sweigart, & Catelan, 1999) has cast doubt on these explanations. More recently, Raimondo et al. (2002) and Ree et al. (2002) have suggested that the stars in these clusters may have normal properties, but span a modest range in age and/or metallicity, akin to the massive globular cluster Centauri. Photometry below the main sequence turn-off is still required to test this hypothesis. Clearly, the effort to understand the cause of the blue HB extensions in NGC 6388 and NGC 6441 is an ongoing and important endeavor.
A means of complementing this effort is to search for other globular clusters which contain extended blue HBs. Most of the metal-rich globulars are located at low galactic latitudes, where differential reddening and contamination by field stars in the disk and bulge confuse the appearance of the CMDs, and can mask the presence of extended blue HBs. One way to alleviate this confusion is to search for RRL – old, pulsating HB stars – based on their photometric variability. With this in mind, we have undertaken a variable star survey of twelve of the metal-rich globulars listed by Suntzeff, Kinman, & Kraft (1991) as having poor or no variable star searches. A fortunate byproduct of this survey is the discovery of LPVs in these clusters. Frogel & Whitelock (1998) noted that the census of luminous LPVs (Mira variables) in globular clusters is seriously incomplete.
In the first paper of this series, Layden et al. (1999) discovered about 50 new variable stars toward NGC 6441, including at least eight RRL and over 20 LPVs. In this paper, we report our results for the second cluster, NGC 6316 (C 1713–280). According to Harris (1996), this cluster is located at a heliocentric distance of 11.0 kpc in the direction (, ) = (357.18, +5.76) deg, behind the Galactic bulge. The resulting foreground field star contamination and the high reddening of mag present a challenge. However, the central concentration of the cluster (log = 1.55) is moderate, so we can obtain reasonable photometry near the cluster center. Previous optical CCD photometry has been conducted by Armandroff (1988), Davidge et al. (1992), and Heitsch & Richtler (1999), although the cluster has never been surveyed for variable stars of any kind (Clement et al., 2001).
In §2 of this paper, we describe the observations and data reduction procedures we employed, while §3 presents our color-magnitude diagrams of the cluster and nearby field. The detection and lightcurve analysis of the variable stars is discussed in §4. In §5 we investigate the foreground reddening of NGC 6316 in conjunction with its metallicity and distance. We consider whether the new variables are members of NGC 6316 in §6, and present a summary of our results in §7.
2 Observations and Reductions
We obtained time-series images of NGC 6316 using the direct CCD camera on the 0.9-m telescope at Cerro Tololo Inter-American Observatory (CTIO) during two runs in May and June of 1996 (3 and 8 usable nights, respectively). The Tek#3 2048 CCD provided a 13.5 arcmin field of view with 0.4 arcsec pixels. We used filters matched to the CCD to reproduce the Johnson and Kron-Cousins bandpasses. The raw images were processed by following the usual procedure for overscan subtraction and bias correction, and by using twilight sky frames to flat-field the images.
In a typical pointing toward the cluster, we obtained a short exposure (40–120 sec) frame pair and a long exposure (250–600 sec) pair. This provided two independent magnitude estimates of the HB stars at each observational epoch, and extended the dynamical range of the observations. Such pointings were obtained 0–2 times each night, with time intervals between pointings of at least two hours. In total, we obtained 47 images in twelve pointings toward NGC 6316. The seeing FWHM varied between 1.1 and 2.7 arcsec (1.7 arcsec median). In images taken during good seeing, a roughly radial gradient in the quality of the stellar profiles was evident, and in some images, the stars near the CCD corners were too far out of focus to yield reliable photometry.
During a photometric night in 1996 May, we obtained a pointing toward NGC 6316 along with an off-cluster image pair centered 13.3 arcmin South of the cluster center. The latter, which we will call the control field, is outside the cluster tidal radius of 5.9 arcmin (Harris, 1996) and enables us to determine the photometric properties of the foreground star field. On this night, we also obtained images of 63 Landolt (1992) photometric standard stars in 13 independent pointings. The standards covered large ranges in color () and airmass (), and were obtained at roughly hourly intervals throughout the night. This time () coverage confirmed that the entire night was photometric, and enabled us to seek and correct for small, slow variations in extinction. The instrumental aperture magnitudes of these stars (), through filters or , were fit with the equation
where is the standard (Landolt) magnitude, and () are the fitted coefficients. The time-dependent terms produced corrections of 0.01 mag or less. The rms scatter about the adopted fits were 0.010 and 0.013 mag in and , respectively.
The cluster and control pairs obtained on this night were reduced using the Daophot II point spread function (PSF) fitting photometry package following the procedure outlined by Stetson (1994). We selected 300 PSF stars well-distributed spatially over each image to characterize the significant radial variation in PSF across the image. For each image, the PSF was iteratively improved by fitting and removing faint neighbor stars. This final PSF was applied to the image using Allstar to obtain optimal photometry for each star on the image. We then used Daophot to subtract all the fainter stars from each image, leaving only a set of several hundred bright, isolated stars for use as secondary standards. We measured the aperture magnitudes of these stars using the same software and parameters as was used for the Landolt standard stars, and used the equations above to transform them to the Landolt (1992) system. These secondary standards were then used to transform the PSF-fit Daophot magnitudes of the fainter stars on the image onto the Landolt (1992) scale.
The remaining images of NGC 6316, taken during non-photometric conditions, were reduced using a version of the DoPHOT PSF-fitting package (Schechter et al., 1993) which allows for spatial variations in the PSF. Instrumental magnitudes were obtained for each image and combined into instrumental pairs, and then transformed to standard Landolt (1992) magnitudes via fits to the secondary standards described above. Each image pair thus produced a single photometry list.
The positions from each list where aligned to a common coordinate system,111A FITS-format image defining the () system used in Table 1 is available at http://physics.bgsu.edu/layden/ASTRO/PUBL/published.html. and the photometry of spatially coincident stellar images was combined using an error-weighted mean. As an estimate of the error in each combined stellar magnitude, we adopted the standard error of the mean from the individual measures. For each star, we also computed the variability index of Welch & Stetson (1993), , from the individual magnitudes (see §4).
Table 1 presents the mean photometry for stars near NGC 6316 that appear in at least four and four images, that lie within eight arcmin of the cluster center, and that have a mean magnitude of mag. Column 1 lists the identification number, columns 2 and 3 are the and pixel values of the star, columns 4 and 5 are the mean magnitude and standar error of the mean, columns 6 and 7 are the mean magnitudes and standard error, columns 8 and 9 indicate the number of images on which the star appeared, and column 10 lists the Welch & Stetson (1993) variability index, . Data for nearly 16,000 stars are listed.
The control field photometry consisted of only a single image pair with an intermediate exposure time of 300 sec. These data are presented in Table 2; columns 1–7 are as in Table 1. Only stars within eight arcmin of the field center, and with mag are included. Table 2 contains data for over 15,000 stars.
3 Color-Magnitude Diagrams
The color-magnitude diagrams (CMDs) for the data in Tables 1 and 2 are shown in Figure 1a and 1b, respectively. Several features are common to both panels, indicating that they represent the field star populations (predominantly the Galactic disk and bulge) along the line of sight through NGC 6316. These include (a) the line of disk main sequence stars extending from and mag to the lower right, (b) the disk and bulge red giant stars at and mag, (c) the bulge core helium-burning stars (“red HB” or “red clump”) at and mag, and (d) the bulge blue HB stars at and mag. The only feature of the cluster CMD that is clearly absent in the control field CMD is the group of stars at and mag, which corresponds to the red HB clump of NGC 6316.
The influence of the overwhelming field star population is reduced in Figure 1c, where we plot only the stars located at a projected radius between 40 and 160 arcsec from the center of NGC 6316. The cluster red clump is again evident, and appears slightly elongated along the reddening vector, suggesting there is a small amount of differential reddening across the face of the cluster. This helps to explain why the cluster RGB remains ill-defined in this panel. The number of BHB stars is greatly reduced relative to Figure Figure 1a, indicating that few, if any, are members of NGC 6316.
Another means of isolating the cluster stars from the field involves the technique of statistical subtraction. We generated a field star CMD using only stars located between 40 and 160 arcsec of the center of the control field image. For each star in this CMD, we removed from the cluster CMD (Figure 1c) the star nearest in color-magnitude space.222Tests showed no detectable difference in mean reddening between the cluster and control field CMDs. Statistically, the remaining stars should represent the locus of stars in the cluster alone. This CMD is shown in Figure 1d. Though the subtraction is over-aggressive for the faint stars, the red clump and lower RGB stars are more clearly shown. Unfortunately, subtraction was not possible for the upper RGB stars because they were saturated in the control field images. An important result of the subtraction is that only a handful of blue HB stars remain, further indicating that NGC 6316 does not have a well-populated blue HB like the metal-rich globulars NGC 6388 and NGC 6441. Specifically, we would expect about 22 HB stars with if NGC 6316 had the same ratio of HB to red clump stars as seen in NGC 6441 (Layden et al., 1999), whereas at most six can be seen in Figure 1d.
We can compare our photometry with other CCD photometry available in the literature. Figure 2 shows a star-by-star comparison with the photometry of Armandroff (1988). Small but significant systematic differences are apparent. Considering bright stars ( mag) and rejecting outliers, we find mag (rms = 0.040 mag) and mag (rms = 0.043 mag), with our photometry being fainter and redder than that of Armandroff (1988). The differences do not appear to be color dependent, though there is a slight correlation with coordinate.
Heitsch & Richtler (1999) also presented photometry of NGC 6316. Estimating from their observed CMD (their Figure 8), they find the typical color and magnitude of the red clump to be 1.30 and 17.5 mag, respectively. The median color and magnitude of the red clump in our data (Table 2) are 1.63 and 17.85 mag, while the values from Armandroff’s data were 1.56 and 17.80 mag. Davidge et al. (1992) found the red clump at mag.
Clearly, there are disagreements between these studies, particularly among the colors, and it is not obvious which photometric zeropoint is correct. Errors in aperture corrections due to the high stellar density in the region are a likely cause of the discrepancies. It is worth noting that our larger areal coverage enables us to obtain aperture corrections from stars farther from the crowded cluster center. For the remainder of this paper we adopt the data presented in Table 1, but acknowledge the uncertainty in its photometric zeropoint.
4 Variable Stars
We used the Welch & Stetson (1993) variability index, , to characterize the likelihood that a given star varies in brightness. The location of points in the (, ) plane led us to classify stars as probable variables () and possible variables (). When plotted on the cluster CMD, three classes of variables were evident: extremely red variables (candidate long period variables), blue variables (candidate RRL), and a few variables scattered around the CMD (candidate eclipsing binaries or other types).
The cluster center is rather crowded, resulting in larger photometric errors and an increased likelihood of detection incompleteness for faint or low-amplitude variables. Variable star detection using image-subtraction software (Alard, 2000), rather than PSF-fitting software, may provide a more complete census of variables near the cluster center. In this approach, a number of high-quality images are registered and co-added to produce a reference image. This reference image is convolved with a spatially-variable kernel to match the seeing in each observed image, and the two images are subtracted. The non-variable stars subtract away, leaving positive or negative residuals at the positions of variable stars. We used the ISIS2.1 software by Alard (2000) on our -band images. As described below, the results confirmed the variability of stars found using DoPHOT, and detected some additional candidate variables.
4.1 Long Period Variable Stars
When their and magnitudes were plotted as a function of time, many of the red variable candidates showed constant or slowly-varying apparent brightness, with distinct jumps between the May and June data. This suggests that they are long period variables (LPVs) of the Mira, Semi-Regular, or Irregular classes. An example of their behavior is shown in Figure 3.
Mean photometry for the thirteen detected LPV stars is presented in Table 3, where we have designated these stars V1 through V13. This table also contains the identification number from Table 1 (“ID”),333The coordinates of each variable star in Tables 3, 4, and 6 can be found using the cross-reference “ID” number listed in Table 1. The coordinates can be converted to approximate right ascension and declination offsets from the cluster center (in arc seconds, with positive values indicating East and North) via the equations , and . Harris (1996) lists the J2000.0 equatorial coordinates of NGC 6316 as (, ) = (17:16:37.4, –28:08:24). the radial distance of the variable from the cluster center in arcsec (); the mean magnitude and color of the variable during the May observing run ( and ), and the number of observations obtained in May (). The next two columns contain the difference between the average magnitudes and colors determined in the May and June observing runs ( and ), and the number of observations obtained in June ().
The ISIS2.1 analysis confirmed the variability of V1 through V13, and suggested that several other stars might vary. The DoPHOT photometry of these stars was often compromised by light from blended neighbor stars, resulting in time-magnitude plots with enhanced scatter. These stars are listed in Table 4 as SV1-SV6, along with their “ID” number and radial distance, , as in Table 3. Also listed are the mean magnitude and color of the variable ( and ), the range of observed and magnitudes ( and ), and the number of pairs observed ().
The time-series photometry of the probable and suspected LPVs are presented in Table 5. The columns contain: the variable star name, the heliocentric Julian Date of the observation (HJD), the observed magnitude and its error (), the observed magnitude and its error (), the fitted light curve phase () when applicable (see Sec. 4.2), and a quality code (). This code is defined as: indicates a long exposure under good seeing conditions (filled circle), indicates a short exposure in good seeing (filled triangle), indicates a long exposure in poor seeing (open circle), and indicates a short exposure in poor seeing (open triangle). Variability detected only in the ISIS2.1 analysis are indicated by .
Unfortunately, our observations do not sample the complete light cycles of the LPVs, and thus do not accurately represent the stars’ mean photometric properties. The limited phase coverage also leads to LPV detection incompleteness, especially for stars which vary on long time scales or with low amplitudes. The LPV stars in NGC 6316 deserve long-term photometric monitoring, though the detections described here are an important first step in their study.
4.2 RR Lyrae Variables and Eclipsing Binaries
When plotted as a function of time, the magnitudes of the blue variable candidates usually showed large variations on time scales of a day or less. The same was true for most of the variables scattered around the CMD. This type of behavior is expected from RR Lyrae and close binary stars.
The rapid variability makes it likely that, even with only twelve independent observational epochs, we can obtain sufficient phase coverage to determine the period and construct a light curve for a candidate variable. This information enables us to classify the type of variability with some confidence.
We searched for periods using the template-fitting method described in Layden et al. (1999) and Layden & Sarajedini (2000). Briefly, this technique involves folding a star’s magnitude–time data by a sequence of periods, and at each period, fitting the resulting light curve with a set of templates describing the light curve shapes of different types of variables (e.g., RRab, RRc, W UMa, etc.) If the period being tested is near the true period, the scatter about the fitted template will be small, resulting in a small value of . Probable periods can thus be identified by searching for minima in period–template space.
We fit each star with ten templates, including curves for six RRab with different shapes, one RRc, a contact binary, a detached binary, and a cosine function (Layden & Sarajedini, 2000). We fit the templates over periods ranging from 0.1 to 3.0 days (periods longer than 3 days are evident in the time-magnitude plots). To complement this analysis, we also searched for periods in the range days using both the Lomb-Scargle method (Scargle, 1982) and the String Length method (von Braun & Mateo, private communication). In most cases, the periods from the different methods agreed well.
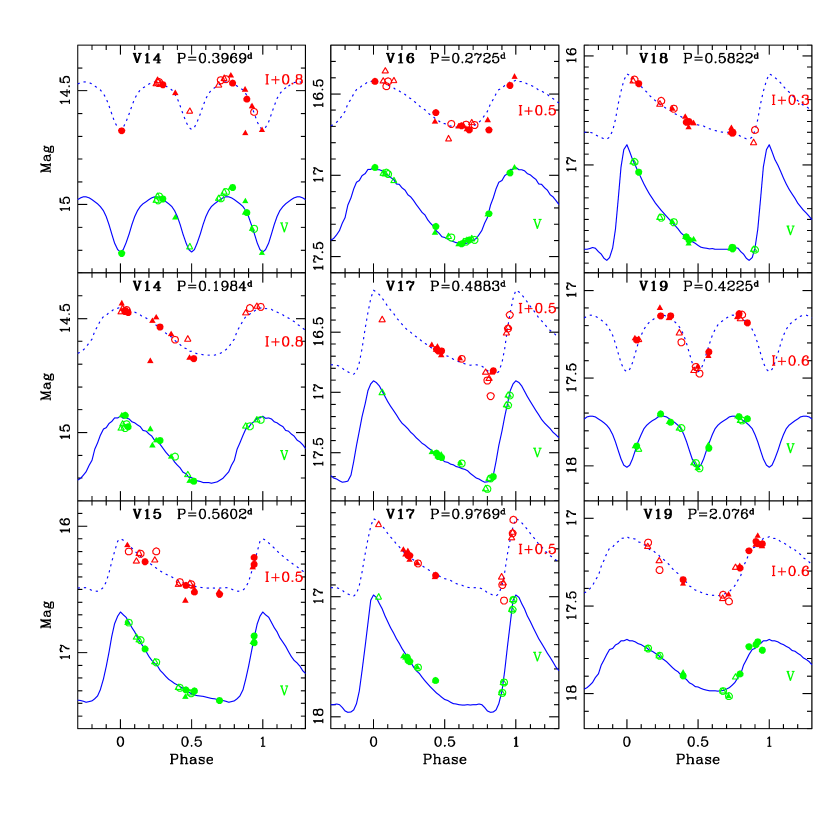
We determined periods for six of the short-period variable candidates. Three appear to be RR Lyrae stars pulsating in the fundamental mode (RRab), one is an RR Lyrae pulsating in the first overtone (RRc), and two are probably contact binaries of the W Ursae Majoris type (WUMa). Details of these stars’ photometry are presented in Table 6, including the variable star designation, ID number corresponding to Table 1, the radial distance from the cluster center in arcseconds (), the best-fitting period in days (), the class of variability corresponding to the best-fitting template, the rms scatter of the observed points about that template ( and ), the intensity-mean and magnitudes ( and ), the light curve amplitude ( and ), the number of paired data points observed for the variable (), and a comment. The intensity means and amplitudes were determined from the best-fitting template since the phase coverage of the actual observations was often incomplete. The light curves, along with the best-fitting templates, are shown in Figure 4.
For the stars V14, V17, and V19, the light curve fitting procedure yielded two minima of comparable depth, and hence two possible periods. In the cases of V14 and V19, this led to ambiguity in the variable class (contact binary versus pulsating star). For each of these stars, entries for both periods are given in Table 6, and light curves for both periods are shown in Figure 4. The rms values listed in Table 6 indicate the relative merit of the two periods. The star labeled SV2 in Table 4 exhibited short period variability in its magnitude–time plots, but did not present any minima which yielded a satisfactory light curve. Further observations of these stars are required to determine their correct periods and variable classes. Time-series photometry for each of the suspected and probable variable stars is given in Table 5.
We did not detect any detached eclipsing binaries in the region of NGC 6316. We suspect this is due largely to observational bias. With only twelve independent visits to the cluster, the chance of observing a detached binary during eclipse is relatively small, and the chance of observing enough eclipses to determine a unique period is smaller still. In Paper I, we found the detached eclipsing variables were not members of the cluster, so their absence in this study of NGC 6316 should not adversely affect our inventory of variable stars in the cluster. We emphasize that our sampling is much more sensitive to variables that exhibit continuous variations. The ISIS2.1 analysis confirmed the variability of the short-period variables V14–V19 and did not detect any additional meaningful candidates near the crowded cluster center.
5 Interstellar Reddening
We used the equations of Cardelli et al. (1989) to establish the relations between reddening and extinction in the filter passbands used in this study. We find and , where corresponds to the system defined in Cardelli et al. (1989). The reddening vector in Figure 1 employs this relation. The cluster HB in that figure is elongated by differential reddening along the same slope, indicating that is appropriate for our data.
Heitsch & Richtler (1999) showed that there is a small amount of differential reddening along the line of sight to NGC 6316. They used the cluster’s red clump and RGB stars to derive a reddening map for stars in a arcmin box centered on the cluster (see their Figure 22). Having noted in §3 the difference in photometric zeropoint between their data and ours, it seems that a differential application of their map to our data is appropriate. We converted their map into a differential map by subtracting the mean reddening in their field, 0.66 mag, from each map value.444Experiments with our own data indicate a differential reddening map with qualitatively similar behavior.
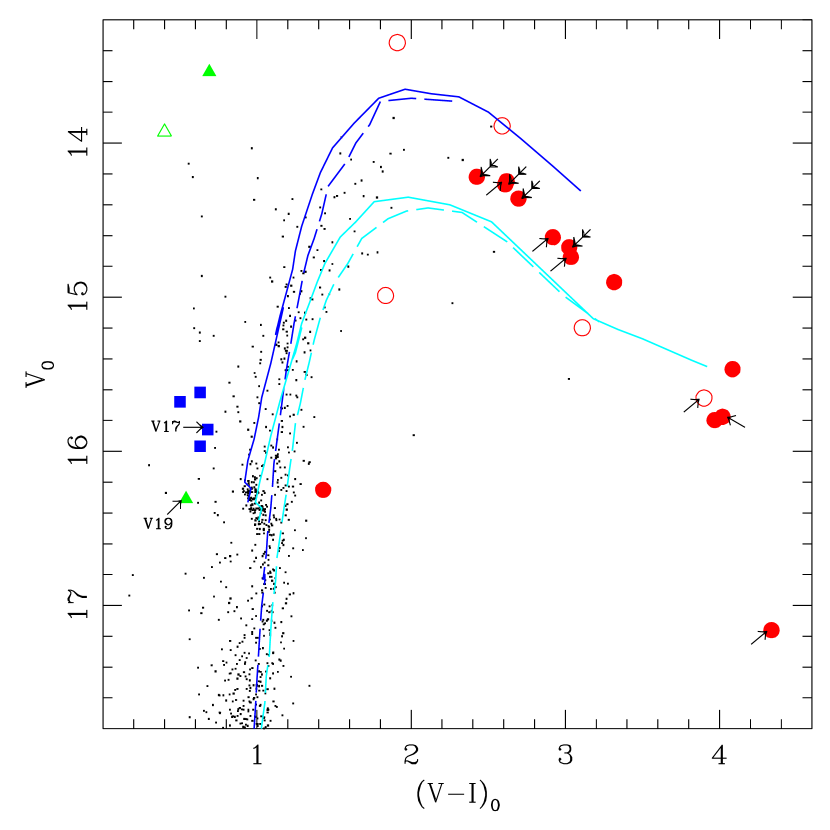
Harris (1996) lists the metallicity and mean reddening of NGC 6316 as [Fe/H] = –0.55 and mag, respectively. The reddening value corresponds to mag. Figure 5 shows the dereddened CMD of stars from Table 1 that are located within the arcmin box defined by Heitsch & Richtler (1999). The photometry of each star has been adjusted using the differential reddening map derived from Heitsch & Richtler (1999), and then shifted by the mean reddening value from Harris (1996).
We can use isochrones in conjunction with our data to test whether the Harris (1996) reddening and metallicity values are correct. Bertelli et al. (1994) provides isochrones that bracket the metallicity of NGC 6316: and 0.008 ([Fe/H] = –0.7 and –0.4 dex, respectively). Figure 5 shows the 12 Gyr isochrones () at these metallicities (isochrones with 10 and 14 Gyr ages are nearly identical). They have been shifted vertically by 15.5 mag to match the red clump stars. The isochrones bracket the observed red clump and the upper RGB and AGB stars, supporting the Harris (1996) reddening and metallicity values. The elongation of the red clump suggests that differential reddening, on scales that are unresolved by the Heitsch & Richtler (1999) map, continues to affect our data at the level of 0.1 mag. Alternatively, this elongation could indicate a metallicity spread of 0.4 dex within the cluster. However, the narrowness of the upper RGB and AGB sequences argues against this. Finally, we note that our photometry shows an enhancement in the number of stars at mag, where the isochrones double-back upon themselves along the AGB.
To summarize, our data are in excellent agreement with globular cluster aged Bertelli et al. (1994) isochrones with the current estimates of metallicity and reddening: [Fe/H] = –0.55 and mag. The one free parameter in this analysis is the cluster distance modulus, which we find to be mag. This corresponds to a distance of kpc, which is somewhat larger than the value of 11.0 kpc listed by Harris (1996).
6 Cluster Membership
The high density of field stars along the line of sight through NGC 6316 makes it difficult to determine which variable stars are members of the cluster and which are not. Information on cluster membership can be derived from the positions of the stars in the CMD and the radial locations of the stars with respect to the cluster center. Future radial velocity measurements are another possible discriminant for membership.
The colors and magnitudes of all the variable stars are plotted on the CMD shown in Figure 5. The four LPVs within 3.0 arcmin of the cluster center define a tight sequence, suggesting that most of them are cluster members. The LPV with (V12) appears to be too faint and blue to be a pulsating AGB star, but could be a contact eclipsing binary involving a red giant star. The LPVs V7, V11, and V12 are very close to the cluster’s tidal radius of 5.9 arcmin, and so are unlikely to be members of NGC 6316. Of the five suspected LPVs, only SV1 appears capable of being a cluster member. Membership of the stars redder than mag is uncertain since the isochrones leave some ambiguity over the exact position and extent of the AGB tip. Based on this information, we classified as LPV members (commented with an “m” in Table 3) the seven variables with arcmin and which have mag. The group of LPVs at (, ) = (4.0, 15.6), which includes V8, V10, and SV1, are possible members. The slope of the color-magnitude variations of Mira stars suggest that these stars, along with the fainest, reddest LPV (V13) could be cluster Mira variables. Ultimately, it is difficult to assign definitive membership designations since our observations do not provide an accurate estimate of the stars’ magnitudes and colors averaged over their pulsation cycles. Further monitoring of the LPVs in NGC 6316 is required to improve the membership analysis. Such monitoring would also provide perriods and light curves for the LPVs that would enable their classification as Irregular, Semi-Regular, or Mira variables.
The positions of the eclipsing binary candidates in Figure 5 suggest that these stars are associated with the field population. One exception may be V19, which lies only 1.5 arcmin from the cluster center. In the CMD, this variable is in the correct place to be an RRL member of the cluster. However, its light curve suggests it is a contact eclipsing binary star or perhaps a Population II Cepheid (BL Herculis type). If the latter, it should have a luminosity 1 mag above the HB. Its presence at the apparent magnitude of the cluster HB would argue that it is located well behind the cluster. Whether V19 is an eclipsing binary or a BL Her star, its membership in NGC 6316 seems unlikely.
The membership of the four probable RRL is of particular interest. Only one of the stars, V17, lies within the cluster’s tidal radius. This star is about 0.5 mag brighter than the NGC 6316 red clump stars, and is about the same brightness as the red clump of the Galactic bulge (see §3). This argument favors membership in the foreground bulge. However, the RRL in the metal-rich globulars NGC 6388 and NGC 6441 are unusually luminous (Pritzl et al., 2002; Layden et al., 1999; Pritzl et al., 2001), and their “horizontal” branches slope upward toward the blue end (Rich et al., 1997). Thus, it is possible that V17 is a luminous member of NGC 6316. The mean periods of the luminous RRL in NGC 6388 and NGC 6441 are unusually long ( days) compared to those of bulge RRL ( days, Alard (1996)). Unfortunately, this test does not yield a clear result, since V17 is well-fit by two periods: 0.4883 days and 0.9769 days. The first period suggests a bulge origin, while the second is consistent with cluster membership in the long-period, metal-rich RRL paradigm. We encourage additional monitoring of V17.
7 Conclusions
We have obtained time-series photometry of stars within a projected radius of 8 arcmin from the metal-rich globular cluster NGC 6313. Our photometry is in agreement with that of Armandroff (1988) and Davidge et al. (1992), but is 0.35 mag fainter and redder than that of Heitsch & Richtler (1999). Though our photometry extends several magnitudes below the cluster’s red clump, we find no evidence for an extended, blue horizontal branch of the type found in the metal-rich globular clusters NGC 6388 and NGC 6441. Comparison of our CMD with isochrones (Bertelli et al., 1994) indicates consistency with the metallicity and reddening values listed by Harris (1996), provided the cluster’s distance modulus is mag.
We have detected over a dozen long period variable stars in the direction of NGC 6316, and at least seven of them appear to be cluster members. Several of the member LPVs appear to lie above the RGB tip in Figure 5, which would suggest they are Mira variables according to the criteria of Frogel & Whitelock (1998). However, our limited coverage of the stars’ pulsation cycles leaves us uncertain whether these LPVs are Irregular, Semi-Regular, or Mira type pulsators. If they are Mira stars, the specific frequency for Miras in NGC 6316 should be comparable to that found in other globular clusters of similar metallicity. The specific frequency has been defined as
where is the number of stars of type “” in the cluster and and is the cluster’s integrated absolute magnitude. Using the Mira counts and -band absolute magnitudes from Table 1 of Frogel & Whitelock (1998), we find that most clusters with –0.8 [Fe/H] –0.3 dex have . If we assume that of the very red LPVs in Figure 5 are Mira stars, then for NGC 6316. The agreement suggests that some or all of these stars could be Mira members of this cluster. Long-term photometric monitoring is strongly encouraged to confirm this interpretation.
We also detected four RR Lyrae variables along the line of sight through the cluster. Three lie outside the tidal radius of the cluster, and their periods and magnitudes indicate they belong to the foreground bulge. Ambiguities in the pulsation period of the fourth RRL (V17) leave us unable to determine whether it is a normal bulge RRL projected on the cluster or a long-period, luminous member of NGC 6316. If V17 is a field star, the specific frequency of RRL in NGC 6316 is clearly zero, whereas if V17 is the sole RRL member of NGC 6316. In this calculation, we used the integrated -band apparent magnitude and interstellar reddening values from Harris (1996) along with the distance modulus determined herein to obtain mag. The value for NGC 6316 is much smaller than was found for the unusual clusters NGC 6388 and 6441, which have (Pritzl et al., 2002) and 7.5 (Pritzl et al., 2001), respectively. By comparison, 47 Tuc has (Harris, 1996). Whether or not V17 is found to be an RRL member of NGC 6316, the process that produced abundant RRL and blue HB stars in NGC 6388 and NGC 6441 is clearly not operating in NGC 6316.
References
- Alard (1996) Alard, C. 1996, ApJ, 458, L17
- Alard (2000) Alard, C. 2000, A&AS, 144, 363
- Armandroff (1988) Armandroff, T. E. 1988, AJ, 96, 588
- Bertelli et al. (1994) Bertelli, G., Bressan, A., Chiosi, C., Fagatto, F., & Nasi, E. 1994, A&AS, 106, 275
- Cardelli et al. (1989) Cardelli, J. A., Clayton, G. C., & Mathis, J. S. 1989, ApJ, 345, 245
- Clement et al. (2001) Clement, C. Clement, C., Muzzin, A., Dufton, Q., Ponnampalam, T. Wang, J., Burford, J., Richardson, A., Rosebery, T., Rowe, J., & Sawyer Hogg, H. 2001, AJ, 122, 2587
- Davidge et al. (1992) Davidge, T. J., Harris, W. E., Bridges, T. J., & Hanes, D. A. 1992, ApJS, 81, 251
- Frogel & Whitelock (1998) Frogel, J. A. & Whitelock, P. A. 1998, AJ, 116, 754
- Harris (1996) Harris, W. E. 1996, AJ, 112, 1487
- Heitsch & Richtler (1999) Heitsch, F. & Richtler, T. 1999, A&A, 347, 455
- Landolt (1992) Landolt, A. U. 1992, AJ, 104, 340
- Layden et al. (1999) Layden, A. C., Ritter, L. A., Welch, D. L., & Webb, T. M. A. 1999, AJ, 117. 1331
- Layden & Sarajedini (2000) Layden, A. C. & Sarajedini, A. 2000, AJ, 119, 1760
- Moehler, Sweigart, & Catelan (1999) Moehler, S. Sweigart, A. V. & Catelan, M. 1999, A&A, 351, 519
- Pritzl et al. (2001) Pritzl, B. J., Smith, H. A., Catelan, M., & Sweigart, A. V. 2001, AJ, 122, 2600
- Pritzl et al. (2002) Pritzl, B. J., Smith, H. A., Catelan, M., & Sweigart, A. V. 2002, AJ, 124, 949
- Raimondo et al. (2002) Raimondo, G., Castellani, V., Cassisi, S., Brocato, E., & Piotto, G. 2002, ApJ, 569, 975
- Ree et al. (2002) Ree, C. H., Yoon, S.-J., Rey, S.-C., & Lee, Y.-W. 2002, in Omega Centauri, A Unique Window into Astrophysics, ASP Conf. Proc. 265, edited by F. van Leeuwen, J. D. Hughes, and G. Piotto (San Francisco: ASP), p. 101
- Rich et al. (1997) Rich, R. M., Sosin, C., Djorgovski, S. G., Piotto, G., King, I. R., Renzini, A., Phinney, E. S., Dorman, B., Liebert, J., & Meylan, G. 1997, ApJ, 484, L25
- Scargle (1982) Scargle, J. D. 1982, ApJ, 263, 835
- Schechter et al. (1993) Schechter, P., Mateo, M., & Saha, A. 1993, PASP, 105, 1342
- Stetson (1994) Stetson, P.B. 1994, PASP, 106, 250
- Suntzeff, Kinman, & Kraft (1991) Suntzeff, N. B., Kinman, T. D., & Kraft, R. P. 1991, ApJ, 367, 528
- Sweigart & Catelan (1998) Sweigart, A. V. & Catelan, M. 1998, ApJ, 501, L63
- Welch & Stetson (1993) Welch, D.L. & Stetson, P.B. 1993, AJ, 105, 1813


| ID | |||||||||
|---|---|---|---|---|---|---|---|---|---|
| 22014 | 183.88 | 720.98 | 14.384 | 0.024 | 13.454 | 0.007 | 4 | 4 | 1.1 |
| 64097 | 1275.35 | 1999.84 | 14.384 | 0.013 | 13.513 | 0.003 | 4 | 4 | 0.1 |
| 3648 | 1427.78 | 128.13 | 14.418 | 0.005 | 13.222 | 0.005 | 4 | 4 | 0.5 |
| 12836 | 1418.48 | 440.26 | 14.447 | 0.005 | 13.270 | 0.003 | 4 | 4 | -0.2 |
| 60056 | 1293.93 | 1861.65 | 14.593 | 0.008 | 13.628 | 0.003 | 4 | 4 | -1.0 |
Note. — The complete version of this table is in the electronic edition of the Journal. The printed edition contains only a sample.
| ID | ||||||
|---|---|---|---|---|---|---|
| 51776 | 180.02 | 1580.01 | 14.773 | 0.015 | 13.736 | 0.013 |
| 15006 | 663.02 | 478.49 | 14.784 | 0.012 | 13.679 | 0.011 |
| 33217 | 197.75 | 1012.57 | 14.798 | 0.008 | 13.719 | 0.007 |
| 34546 | 1244.87 | 1052.59 | 14.815 | 0.008 | 13.771 | 0.008 |
| 7412 | 1116.96 | 244.06 | 14.856 | 0.009 | 13.751 | 0.011 |
Note. — The complete version of this table is in the electronic edition of the Journal. The printed edition contains only a sample.
| Name | ID | CommentaaKey: m = probable cluster member, S = significant short-term variation, e = possible eclipsing binary. | |||||||
|---|---|---|---|---|---|---|---|---|---|
| V1 | 38583 | 103 | 12.49 | 3.20 | 3 | -0.05 | -0.09 | 7 | m |
| V2 | 31501 | 30 | 12.51 | 3.17 | 3 | -0.06 | -0.14 | 6 | m |
| V3 | 35496 | 42 | 12.52 | 3.21 | 3 | -0.05 | -0.24 | 7 | m |
| V4 | 27562 | 50 | 12.72 | 3.64 | 4 | 0.29 | 0.19 | 5 | m |
| V5 | 29770 | 21 | 12.65 | 3.83 | 3 | 0.23 | 0.35 | 6 | m |
| V6 | 29391 | 60 | 12.41 | 3.46 | 3 | -0.35 | -0.41 | 8 | m, S |
| V7 | 56815 | 368 | 12.51 | 3.98 | 3 | 0.09 | 0.06 | 6 | |
| V8 | 13811 | 256 | 12.37 | 4.76 | 3 | 0.20 | 0.09 | 6 | |
| V9 | 32682 | 20 | 12.60 | 2.98 | 3 | -0.17 | -0.18 | 9 | m |
| V10 | 21530 | 121 | 12.57 | 4.58 | 3 | -0.15 | -0.14 | 8 | |
| V11 | 32140 | 347 | 12.64 | 4.53 | 3 | -0.14 | -0.13 | 9 | |
| V12 | 8488 | 348 | 15.79 | 2.06 | 7 | 0.18 | 0.01 | 12 | e, S |
| V13 | 43903 | 143 | 14.13 | 4.92 | 6 | 0.85 | -0.09 | 11 | S |
| Name | ID | Comment | ||||||
|---|---|---|---|---|---|---|---|---|
| SV1 | 40992 | 136 | 17.14 | 4.53 | 0.19 | 0.07 | 11 | LPV? |
| SV2 | 16039 | 222 | 15.44 | 1.03 | 0.17 | 0.18 | 20 | short period |
| SV3 | 6438 | 444 | 16.39 | 2.50 | 2.60 | 3.15 | 18 | LPV? |
| SV4 | 15154 | 361 | 15.40 | 3.22 | 0.21 | – | 21 | LPV? |
| SV5 | 7526 | 409 | 16.71 | 3.74 | 0.38 | – | 21 | LPV? |
| SV6 | 12600 | 230 | 14.86 | 2.54 | 0.12 | – | 21 | LPV? |
| Name | HJD | ||||||
|---|---|---|---|---|---|---|---|
| V1 | 2450225.6418 | 15.705 | 0.009 | 12.481 | 0.007 | 9.990 | 2 |
| V1 | 2450226.6308 | 15.690 | 0.009 | 12.505 | 0.011 | 9.990 | 2 |
| V1 | 2450227.7814 | 15.673 | 0.009 | 12.473 | 0.008 | 9.990 | 2 |
| V1 | 2450258.5347 | 15.858 | 0.009 | 12.544 | 0.005 | 9.990 | 4 |
| V1 | 2450258.5401 | 15.859 | 0.009 | 12.537 | 0.005 | 9.990 | 3 |
| V1 | 2450258.8264 | 15.867 | 0.005 | 12.553 | 0.007 | 9.990 | 2 |
| V1 | 2450259.4997 | 15.847 | 0.005 | 12.558 | 0.004 | 9.990 | 4 |
| V1 | 2450260.6096 | 15.844 | 0.005 | 12.531 | 0.008 | 9.990 | 4 |
| V1 | 2450262.5007 | 15.817 | 0.005 | 12.530 | 0.004 | 9.990 | 4 |
| V1 | 2450262.7478 | 15.804 | 0.006 | 12.520 | 0.006 | 9.990 | 2 |
| V1 | 2450263.4834 | 15.785 | 0.006 | 12.527 | 0.006 | 9.990 | 4 |
| V1 | 2450266.7368 | 15.747 | 0.007 | 12.509 | 0.007 | 9.990 | 2 |
| V2 | 2450225.6418 | 15.679 | 0.012 | 12.506 | 0.010 | 9.990 | 2 |
| V2 | 2450226.6308 | 15.677 | 0.014 | 12.524 | 0.011 | 9.990 | 2 |
Note. — The complete version of this table is in the electronic edition of the Journal. The printed edition contains only a sample.
| Name | ID | Class | Comment | |||||||||
|---|---|---|---|---|---|---|---|---|---|---|---|---|
| V14 | 8333 | 327 | 0.3969 | WUMa | 0.015 | 0.024 | 15.05 | 13.73 | 0.24 | 0.21 | 20 | field |
| … | … | … | 0.1984 | RRc | 0.020 | 0.028 | 15.08 | 13.76 | 0.29 | 0.21 | 20 | short for RRc |
| V15 | 29329 | 454 | 0.5602 | RRab | 0.018 | 0.041 | 17.13 | 15.87 | 0.71 | 0.41 | 21 | field |
| V16 | 45168 | 366 | 0.2725 | RRc | 0.014 | 0.042 | 17.19 | 16.06 | 0.47 | 0.29 | 22 | – |
| V17 | 45182 | 158 | 0.4883 | RRab | 0.026 | 0.032 | 17.37 | 16.06 | 0.84 | 0.70 | 20 | |
| … | … | … | 0.9769 | RRab | 0.030 | 0.029 | 17.59 | 16.23 | 0.98 | 0.64 | 20 | |
| V18 | 76037 | 370 | 0.5822 | RRab | 0.017 | 0.021 | 17.48 | 16.22 | 1.06 | 0.60 | 20 | field |
| V19 | 40886 | 88 | 0.4225 | WUMa | 0.016 | 0.034 | 17.82 | 16.65 | 0.29 | 0.32 | 20 | field |
| … | … | … | 2.076 | Cep | 0.026 | 0.032 | 17.84 | 16.68 | 0.30 | 0.34 | 20 | – |