Long-term Properties of Accretion Disks in X-ray Binaries: II. Stability of Radiation-Driven Warping
Abstract
A significant number of X-ray binaries are now known to exhibit long-term “superorbital” periodicities on timescales of 10 - 100 days. Several physical mechanisms have been proposed that give rise to such periodicities, in particular warping and/or precession of the accretion disk. Recent theoretical work predicts the stability to disk warping of X-ray binaries as a function of the mass ratio, binary radius, viscosity and accretion efficiency, and here we examine the constraints that can be placed on such models by current observations.
In paper I we used a dynamic power spectrum (DPS) analysis of long-term X-ray datasets (CGRO, RXTE), focusing on the remarkable, smooth variations in the superorbital period exhibited by SMC X-1. Here we use a similar DPS analysis to investigate the stability of the superorbital periodicities in the neutron star X-ray binaries Cyg X-2, LMC X-4 and Her X-1, and thereby confront stability predictions with observation. We find that the period and nature of superorbital variations in these sources is consistent with the predictions of warping theory.
We also use a dynamic lightcurve analysis to examine the behaviour of Her X-1 as it enters and leaves the 1999 Anomalous Low State (ALS). This reveals a significant phase shift some 15 cycles before the ALS, which indicates a change in the disk structure or profile leading into the ALS.
keywords:
stars - X-rays: binaries :pulsars :accretion disks :precession periods1 Introduction
In a small but growing number of bright X-ray binaries a third (or “superorbital”) period is present in addition to the usual periodicities. Broadly speaking, superorbital variations divide into two observational classes, with clear, stable X-ray intensity variations in the 30-day range forming one category (e.g. SMC X-1, Her X-1, LMC X-4), and more quasi-periodic, longer periodicities in the 50-200 day range forming the other (see Clarkson et al, 2002, hereafter paper I, and references therein). Modulations in the longer-period class are distinctly “quasi-periodic” in that even long-term monitoring datasets do not yield precise periods in their power spectra, but a broad peak, often superposed on an apparent “red-noise” continuum. Examples of these include Cyg X-2 (70-80d; Paul, Kitamoto & Makino 2000, hereafter PKM00), GX354-0 (70d; Kong, Charles & Kuulkers 1998), X1916-053 (83d; Homer et al. 2001) and X1820-30 (171d; Chou & Grindlay 2001).
With the exception of X1820-30, it has become customary to interpret superorbital periodicities from both classes as due to a precessing, possibly warped accretion disk, with differences in amplitude due to differences in inclination. This scenario dates from the early history of X-ray astronomy, in which a warped disk was proposed to explain the behaviour of Her X-1 (Gerend & Boynton 1976, Petterson 1977). The intense radiation pressure from the central X-ray source drives the disk warp, and tidal forces lead to precession on the observed 35-day cycle. The precession causes periodic obscuration of the central source, giving rise to a modulation of the X-ray flux at the precession period. This model has been the subject of intense theoretical examination in recent years (see e.g. Wijers and Pringle 1999, or for the current state-of-the-art, Ogilvie and Dubus 2001, hereafter OD01, and references therein).
In Paper I it was argued that varying absorption could not account for the superorbital periodicity in SMC X-1, as variation in the 1.3 - 12.1 keV band was mirrored at higher energies. Instead, the warp could manifest itself in two ways: as a variation in uncovered emitting area (as in Gerend and Boynton 1976), or as a variation in accretion rate onto the neutron star.
A further manifestation of disk warping not mentioned in Paper I is modification of disk throughput by X-ray irradiation of the disk. X-ray irradiation from the central source influences the disk temperature and viscosity (van Paradijs 1996, King & Ritter 1998). In a flat disk, self-screening strongly diminishes this effect (Dubus et al 1999), but if the disk is at all warped, irradiation reaches beyond the inner disk in an azimuthally asymmetric way. In this case irradiation can significantly heat the disk (Hynes et al 2002) and is thought to affect the rate of mass flow through the disk (Dubus et al 2003), with measurable time-varying effects on the disk temperature profile and central source intensity.
Scenarios other than disk warping are possible, however. We merely introduce these mechanisms here and refer the reader to section 6.2 of Paper I for more information:- (i) Also postulated to explain the superorbital periodicity in Her X-1 was the possibility of precession of the magnetic axis of the neutron star (Trümper et al 1986; Lamb et al 1975). Here, the variation of accretion from equator to pole causes a torque that leads to the precession of the magnetic axis. (ii) A third body can induce an eccentricity in the XRB orbit, causing orbital precession and decay. The precession manifests itself as a change in accretion rate on a period determined by the orbital period of the XRB and the third body (Chou & Grindlay 2001). This process has been postulated to explain the 171 day period in X1820-303 but for SMC X-1 the low amplitude of modulation of the pulse arrival times (Wojdowski et al 1998) requires an extremely finely tuned triple system, so this mechanism was discarded for that system (paper I). Mechanisms for which no prototypical system have yet been identified involve (iii) variations in the extent to which the donor overflows its Roche Lobe as a result of stellar pulsation (see, e.g: Wehlau et al 1992), or (iv) varying location of an accretion X-ray bright spot (as happens in the UV in CV’s, e.g: Rutten, van Paradijs & Tinbergen 1992).
1.1 Accretion Disk Warping
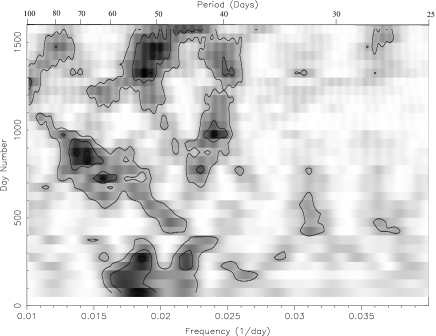
In Paper I we presented the techniques of examining superorbital variations in XRB, focusing on SMC X-1, the source which shows the clearest variation in its superorbital period. The dynamic power spectrum (or DPS) was used to chart the behaviour of the superorbital period. An apparently cyclic variation (on an even longer timescale of 7 years) in the superorbital period was evident in the DPS. It was suggested that the behaviour of SMC X-1 is consistent only with a precessing, warped accretion disk, where a competition of warping modes leads to variation in the warp, giving rise to the shifting superorbital period.
This interpretation gains support from the theoretical stability analysis of OD01, which extends -disk theory to radiation-driven warping, with correct analytic expressions for the torque on a disk element. Solutions are examined numerically to determine stability to warping for initially flat disks, steadily precessing disks and nonlinear warps. They find that for reasonable values of the global disk viscosity and accretion efficiency , the stability of an accretion disk to warping is determined by the binary separation and mass ratio . A further variable is the location of the mass input to the disk, whether close to the Lindblad resonance point or the circularisation radius . For most X-ray binaries, the majority of the torque exerted by the mass input is close to , as even in LMXB with large accretion disks, the matter stream is believed to continue to the vicinity of the circularisation radius. Accordingly, we follow OD01 in taking the location of mass addition to be . Figure 7 shows the division of XRB into regions of stability to warping from this analysis. The location of SMC X-1 at the boundary between regions stable to simple mode 0 warping and combinations of modes supports our assertion that the long-term X-ray behaviour of SMC X-1 is due to a competition of warping modes.
The location of the boundaries between stability regions in - space depends strongly on the global disk viscosity parameter, and the neutron star accretion efficiency . Uncertainty in these values translates into uncertainty as to the location of the boundary between regions and thus the stability classification of a system. However, the adopted values of = 0.3 and = 0.1 are usually assumed to be appropriate for neutron star XRB (Frank, King & Raine 1995, OD01 and references therein).
In this paper we examine the long-term behaviour of a selection of X-ray persistent neutron star XRB in which superorbital periodicities are well-established. We apply the techniques from paper I, in particular the DPS, to explore the phenomenology of these variations. We focus on neutron star XRB for which persistent superorbital periods have previously been reported. Our goal is to relate the long-term behaviour of the sources to their position in the - diagram, so as to directly confront the stability predictions of the radiation-driven warping framework with observation. If succesful, it will establish the time evolution of periodicities as a powerful indicator of XRB properties in systems whose properties are less well-understood, for example the Ultracompact X-ray Binaries (Clarkson et al 2003, in prep)
2 RXTE Observations
Launched in December 1995, the Rossi X-Ray Timing Explorer (RXTE) carries an All Sky Monitor (ASM), which gives regular coverage of the entire sky. Typically 5-10 readings - called “dwells” - are taken of each of a list of sources per day, lasting about 90 seconds per dwell. Timing information is provided to within a thousandth of a day, as well as crude spectral information. The ASM is sensitive to photon energies between 1.3 and 12.1 keV, broken into three energy channels (1.3-3.0 keV, 3.0-5.0 keV and 5.0-12.1 keV). Nearly 7 years of data (January 1996 - August 2002) from the ASM were used in our analysis. For all analyses reported in this paper, the ASM data were selected by background and quality of coverage; all points with background level above 10 were rejected as part of a filtering technnique modeled after Levine et al (2000). Crude X-ray spectral information can be obtained from the ASM data by constructing hardness ratios of the three channels. In this work we define the ratio to be the sum of the count rate in the two high energy channels (3.0 - 12.1 keV) to that at low energy (1.3 - 3.0 keV).
3 Source Selection
Each source used in this analysis was selected on the basis of three criteria. Firstly, independent estimates of and must be available, which restricts our search to optically identified systems with full orbital solutions. Secondly, the sources must be persistent X-ray emitters at a high enough level to provide long-term datasets of sufficient quality to detect long-term modulations, which favours neutron star XRB. Third, each system used must show independent evidence for a persistent accretion disk.
Table 1 shows the sources selected for this study, together with the warping behaviour predicted by OD01. The strong dependence of the stability boundaries on and leads us to choose systems with similar compact objects in the hope that for such systems these parameters will take similar values. Poor coverage of the - diagram forces us to select systems with both high and low - mass companions.
Figure 1 shows sections of the RXTE/ASM lightcurves from the sources used here, binned appropriately to improve signal-to-noise. The lightcurve of Cyg X-2 shows similar morphology to that of SMC X-1, though at count rates about a factor of 20 higher. Its morphology is also more complex than a single periodic cycle, which leads to the detection of more than one periodicity (PKM00). The ASM lightcurve for Her X-1 shows a clear variation on the well-known 35 day cycle, with a secondary peak half a cycle after the main period of extended activity. LMC X-4 also shows evidence of a cycle that is superficially similar to that of SMC X-1, although the lightcurve shows more scatter.
3.1 Discarded Sources
Several well-constrained, persistent neutron star XRB are within the regions of interest in the diagram, but we choose not to analyse them here as they are unlikely to show significant long-term cyclic phenomena in the RXTE/ASM. Circinus X-1 is well within the region of the stability diagram corresponding to mode 1 and higher warping, and is a luminous neutron star XRB (Tennant 1986). However, its orbit is strongly suspected to be highly eccentric, among many other properties the system shares with A0538-66 (Charles et al. 1983). As pointed out in OD01, the stability analysis as it stands is not valid for non-circular orbits.
4U 1907+09 is a pulsar XRB with massive companion (e.g. van Kerkwijk et al 1989) in a wide orbit, that has shown a monotonic increase in pulse period since its discovery (Mukerjee et al 2001). Transient QPO’s have twice been discovered at frequencies (10 - 400 mHz), the interpretation of which requires an accretion disk, however small. This phenomenon suggests that temporary formation of an accretion disk is the mechanism responsible for the spin-down, and that this must occur during the majority of orbital cycles (Mukerjee et al 2001). The interval over which this disk persists is small compared to the 8.4-day orbital period (in ’t Zand et al 1998), suggesting that radiation-driven warps would not persist long enough to be measurable by RXTE/ASM.
X2127+119 has recently been shown to consist of two sources which cannot be resolved by RXTE (White & Angelini 2001; Charles, Clarkson & van Zyl 2002). While resolving the mystery of how a source can show evidence for both an ADC and Type I bursts, it is not possible to relate components in the observed RXTE/ASM X-ray flux to a single system.
OAO1657-415 shows spin-up and spin-down trends without any correlation with X-ray luminosity 20keV (Baykal 2000), suggesting no persistent accretion disk is present. In the case of OAO1657-415, these episodes cannot be explained by wind accretion (Baykal 1997), but are thought to arise through temporary formation and destruction of a disk, in the manner implied by Bildsten et al (1997). A small correlation between accretion rate and pulse frequency change in the RXTE waveband is taken as evidence that this is indeed the case.
| Name | 1 | Prediction 2 | |||||
|---|---|---|---|---|---|---|---|
| () | (d) | (d) | () | ||||
| Her X-1 | 3.1 | 1.56 | 35 | 1.36 | 1.700 | 1.4 | Persistent mode 0 |
| LMC X-4 | 4.5 | 10.6 | 30 | 1.35 | 1.408 | 3.5 | Persistent mode 0 |
| SMC X-1 | 8.9 | 11.0 | 50 | 1.6 | 3.890 | 2.3 | Mode 0 dominant but other modes possible |
| Cyg X-2 | 8.0 | 0.34 | 78 | 1.78 | 9.844 | 2 | Complex combination of modes 0,1 and higher |
1 Claimed superorbital period 2 Based on position in figure 7 of OD01 3 See text for references

4 Dynamic Power Spectrum
Data were analysed using our DPS approach, designed to be sensitive to long-term quasi-periodic variations. The Lomb-Scargle (LS) periodogram code (Scargle 1982, 1989) was used in conjunction with a sliding ‘data window’ to produce power density spectra (PDS) for a series of overlapping stretches of the time series. Adjustable parameters in the analysis were the length of the data window and the amount of time by which the window was shifted each time to obtain the overlapping stretches of data. The code accounted for variations in the number of datapoints per interval such that the power spectrum resolution was identical for each interval.
Choice of data window length was influenced by the limits of reliable period search with the PDS; we choose two complete cycles as the minimum needed for a reliable detection. The range of claimed superorbital periodicities runs from 30 - 200 days, so we set our window length at 400 days. We choose the maximum length that meets our criteria because this brings about the sharpest period detections.
4.1 Statistical Significance of Detected Periods


Once a period is detected, its statistical significance must be addressed. For most of the sources in this paper, long-term variability is superposed on frequency-independent white-noise. The statistical significance of a detected periodicity over this noise is determined by computing the LS power spectra of simulated 400-day datasets (assuming gaussian white-noise) with the sampling of the true lightcurve, then measuring the fraction of datasets that produce the LS power of interest or greater (figure 2).For the 400-d data windows used in this analysis, an LS power of 9 corresponds to a confidence level that the detected periodicity is real, and not a collusion of random noise and data sampling. These sources show LS powers in excess of 30, substantially in excess of even the 99.9% significance level. The highly coherent nature of the variation profiles (figure 1) argues against frequency-dependent red-noise (e.g. Timmer & König 1995, Homer et al 2001), affording confidence in our significance levels.
The error in the detected period is determined empirically. A sinusoidal variation at the detected periodicity, with amplitude corresponding to the detected peak LS power is superimposed on white noise, with random sampling on the RXTE/ASM count rate and over the same length of time as a data window from the DPS. The LS periodogram of this dataset is performed and the peak frequency measured. This process is repeated for simulated datasets, and the resulting spread of detected periodicities about the input periodicity measured. The detection accuracy is quoted in units of of the fit to the resulting distribution in period detections. In one case (Cyg X-2) the peak period detection was shifted from the input period by an amount corresponding to the beat between the detected period and 8 times the time interval of a data window, which has been incorporated into the quoted error on the period detection (table 2 and figure 2).
5 Results
5.1 Her X-1
Her X-1 is the prototypical disk warping system, with a 35-day periodicity detected at optical and X-ray wavelengths. This periodicity is almost certainly due to a precessing, warped accretion disk, as first suggested by Gerend & Boynton (1976) to explain the optical lightcurve, and corroborated by the evolution of the pulse profile (Scott et al 2000), and variations in X-ray illumination of the companion HZ Her (Leahy & Marshall 1999, Leahy, Marshall & Scott 2000). The accretion disk is thought to be tilted and twisted (Gerend & Boynton 1976, Schandl & Meyer 1994, Schandl 1996). With X-ray pulsations at 1.24s, eclipses at 1.7 days and an A7 Roche lobe-filling companion (Middleditch & Nelson 1976) of 2 , the mass ratio and binary radius are constrained (but see Leahy & Scott 1988 for uncertainties due to possible subsynchronous donor rotation). On three occasions, the source has failed to reach a high state at the time expected from the 35-day cycle (Parmar et al 1985; Vrtilek et al 1994; Oosterbroek et al 2000). These Anomalous Low States (ALS) last for several 35-day cycles each, and are thought to be the result of a state change in the accretion disk (Still et al 2001).


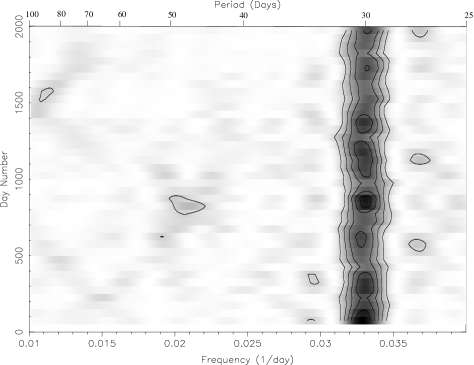
The DPS of Her X-1 (figure 3) shows an extremely significant (99.99 %) periodicity at 34.98 days, along with a less significant secondary peak at 17.5 days. This secondary peak is not an artefact of the search technique; as figure 3 shows, the DPS has picked up the secondary peak at phase 0.3 in the 35-day cycle. Her X-1 is the only system suspected of disk precession to show this secondary feature so significantly. Her X-1 also shows the clearest relation between ASM count rate and spectral hardness of all the sources studied here (figure 4).
5.2 LMC X-4
LMC X-4 is a 13.5 s X-ray pulsar with a 15 O-type companion that eclipses the X-ray source every 1.4 days. QPO’s have been found at 2-20 mHz during large X-ray flares (Moon & Eikenberry 2001) confirming the presence of orbiting matter at least 0.25 from the neutron star. Disk modeling of the orbital and precessional optical lightcurve (Heemskerk & van Paradijs 1989) suggest the accretion disk may extend out to about .
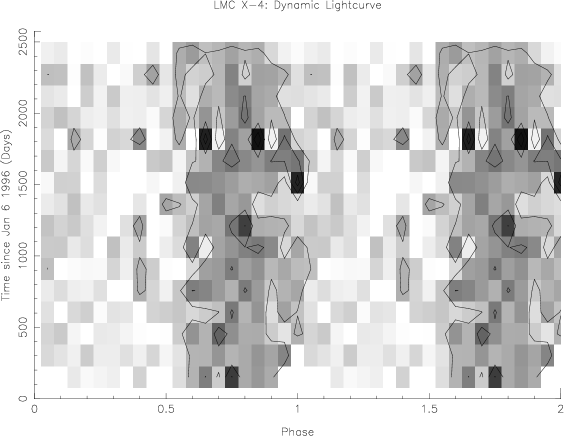
The DPS of LMC X-4 (figure 5) shows the simplest behaviour of the sources analysed here: a periodicity at 30.28 days that is both stable and persistent throughout the entire dataset. The DPS is not sensitive to the systematic variation of this periodicity reported recently by Paul & Kitamoto (2002). At LS power 38, this 30-d cycle is somewhat less significant than for Her X-1 (LS Power 300), but the power still corresponds to significance. There appears to be slight jitter in the peak period, but at days this is not significant when compared with the uncertainty for this source of days. LMC X-4 shows a relationship between RXTE/ASM spectral hardness and count rate (figure 6) that is somewhat less steep than for Her X-1.


5.3 Cygnus X-2
Although not a pulsar, Cyg X-2 nevertheless has a well-constrained binary orbit, with a 0.5 - 0.7 companion in a 9.84-day period (Casares, Charles & Kuulkers 1998), unusually long for a LMXB. Type I X-ray bursts (e.g: Kahn & Grindlay 1984) established Cyg X-2 as a neutron star XRB. Modeling of IUE spectra (Vrtilek et al 1990) yields a best-fit outer accretion disk radius of (the Roche lobe radius), while modeling of optical lightcurves (Orosz & Kuulkers 1999) suggests the disk radius may be closer to 0.9 . A pattern of high- and low-intensity X-ray states has been seen in early RXTE/ASM, Vela 5B and Ariel-5 observations (Wijnands et al 1996), on timescales of 77.7, 77.4 and 77.7 days respectively, while the Ginga/ASM lightcurve shows the strongest periodicities on periods of 53.7 and 61.3 days (PKM00). This variation has been attributed to radiation-driven accretion disk precession (Vrtilek et al. 1997).
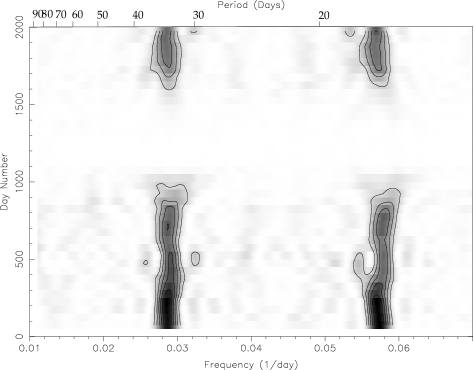
Cyg X-2 shows complex behaviour in the DPS, with an extremely significant (LS 900) periodicity at period 59 days, seen over the period from day number 600-900 (figure 7). This feature seems to form as two separate periodicities converge, then diverge as the feature vanishes. There are also significant recurring features at 40 days. The -day periodicity noted previously may be present during the beginning of the RXTE/ASM dataset, though is of equal or lower significance than its harmonic. In any case the longterm variation of Cyg X-2 is not the reliable clock suggested by Wijnands et al (1996). In contrast to Her X-1 and LMC X-4, the binned superorbital lightcurve of Cyg X-2 shows a negative relation between the RXTE/ASM spectral hardness and count rate (figure 8), as expected if the superorbital lightcurve is due to an obscuration effect (section 6.3).


| Name | (d) | (d)1 |
|---|---|---|
| Her X-1 | 35.0 | 0.16 |
| LMC X-4 | 30.3 | 0.46 |
| Cyg X-2 | 59.0 | 0.45 |
| 1 |
6 Discussion
6.1 Her X-1: Inclination Change
The clear hardness-intensity relation in the RXTE/ASM lightcurve (figure 4) is not by itself an indication of the physical mechanism (Tanaka 1997). In fact we find no feature of the lightcurve of this source that contradicts the precessing, warped accretion disk scenario of Gerend and Boynton (1976). As the warp precesses, it could uncover regions deeper towards the central accretor, predicting the correspondence between spectral hardness and count rate observed. The asymmetry in the superorbital lightcurve can be brought about by a combination of the system inclination and vertical extent of the warp (Gerend & Boynton 1976, Schandl & Meyer 1994, Schandl 1996).
The superorbital periodicity is completely absent from a significant fraction of the data, marking the third ALS detected in this source to date (Oosterbroek et al. 2001). This is not an effect of data sampling, as might be expected for a source with such a low count rate; on the contrary, the persistent emission at 1 is still well sampled. Measurements by BeppoSAX (Oosterbroek et al 2001) show that the most recent ALS is accompanied by a rapid spin-down of the neutron star, in which the spin-down rate is some nine times faster than the spin-up rate during “normal” X-ray output. At the same time, optical observations during the ALS show (Margon et al 1999) that the companion is still strongly irradiated. Spectral fits and lightcurve modeling of RXTE/PCA pointings during the ALS suggest the X-ray output during the ALS consists of X-ray reflection from the companion (Still et al 2001). The current interpretation for this behaviour is that the line of sight to the central source has been obscured during the ALS, causing the turn-off, by an increase in line-of-sight column density due to the disk.
This would impact the superorbital lightcurve in two ways. Firstly, the asymmetry between the peaks in the fold would be altered, but whether as an increase or decrease would depend on the current inclination and the precise disk profile. Secondly, a phase shift in the superorbital fold would be seen during the change of inclination. The twist of the disk brought about by the warp means that any given feature in the warp would be seen at different disk azimuth angles for different heights above the nominal flat disk equator.
In figure 9 we plot the dynamic lightcurve (DL) of Her X-1. In a manner analogous to the DPS, this breaks the dataset into windows of sufficient length to give good coverage, then folds these windows on the ephemeris specified. Because fewer cycles per window are needed for detection in a fold than a power spectrum, the windows can be shorter for the DL than for the DPS; it was therefore decided to use independent windows.
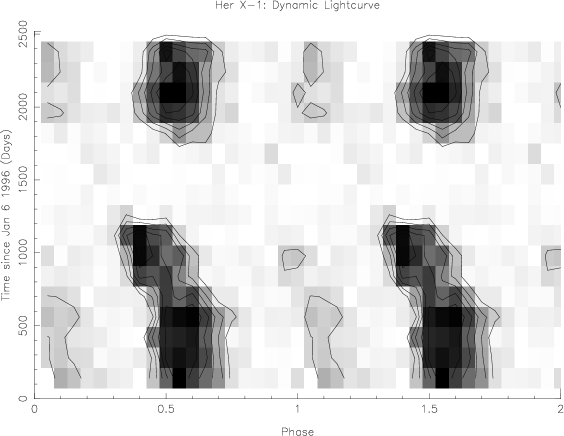
From the DL we see that there is indeed a phase shift taking place over some fifteen cycles before the ALS. The secondary peak in the 35-day cycle appears to decrease in relative amplitude just before onset of the ALS. The cut-off in the superorbital period detection, however, is abrupt, taking place over three cycles at most. By the end of the ASM dataset, the system shows behaviour similar to the beginning of the dataset, and the secondary feature is recovered.
This phase shift and profile change is most naturally interpreted as a change in the line-of-sight disk profile. There are two good candidates for the nature of this change. It has been suggested (Wijers & Pringle 1999, van Kerkwijk et al 1998) that if a disk is sufficiently warped, the inner disk may actually flip over and start to precess in the opposite direction to the outer disk. This would produce the extremely rapid spin-down observed during the ALS as the direction of flow of accreting matter would then oppose the spin of the neutron star. Following this interpretation, we would expect to be observing the neutron star through the accretion disk for at least some of the ALS, which would produce a harder spectrum for the ALS than for the normal state. However, the continuum X-ray emission is not spectrally harder for the ALS than for the emission prior to and after the ALS (figure 10). A further difficulty is that one would expect to see some manifestation of the change of disk orientation in the overall ASM lightcurve.

A second interpretation involves the disk changing its inclination with respect to the observer. We suppose here that the X-ray intensity from a twisted, warped disk varies as the amount of emitting area uncovered in the inner disk region varies. If such a disk were to change its inclination with respect to the observer, the uncovered area at each point in the cycle would also change with the inclination. A twisted disk would naturally produce a variation in the phase of features in the profile. That the ALS is accompanied by rapid spin-down of the neutron star presents a difficulty for this scenario, unless either (i) the accretion flow at the magnetosphere/inner disk boundary changes direction to act against the neutron star rotation, or (ii) the spin of the neutron star causes ejection of matter in the manner of e.g: 4U1907+09 (section 3.1), producing a rapid spin-down as the accretion flow lessens due to a reduction in accretion rate through the disk. In scenario (ii), the spin-down during the ALS would suggest that the Her X-1 disk is reducing its inclination to the binary plane. The extent to which the uncovered area is sensitive to the inclination change, and thus the level of other observable effects of this change, is not at present clear. A further effect might be the variation with the warp of the area open to X-ray heating, which might bring about a reduction in mass throughput depending on the timescale for such heating (c.f. Dubus et al 1999).
6.2 LMC X-4: Stable variation
At some five times more distant than most of the sources in this study, LMC X-4 exhibits low count rate and hence lower S/N, as can be seen in its 31-day dynamic lightcurve (figure 11), which furthermore undergoes no significant shift in phase or overall intensity over the ASM dataset. The superorbital lightcurve itself is somewhat different in shape to that of Her X-1 (figures 4 and 6), with the primary peak in the profile less symmetric, and no significant secondary peak is detected. A secondary peak might be present, however: assuming a similar relative amplitude as that in Her X-1, such a peak would occur at only 0.2 c/s.
This suggests that if the accretion disk in this source does shift its inclination, as suggested for Her X-1, the LMC X-4 accretion disk either does not do so at all on the timescale detectable with the DL, or the disk profile and inclination are such that any existing wobble does not impact the superorbital fold to the same extent. We can place a rough upper limit on superorbital phase variation of features in the dynamic lightcurve of orbit.
6.3 Cyg X-2: Multimode Variation
For Cyg X-2, in which the DPS behaviour does not show a single stable periodicity, such analysis is not possible. Indeed, its behaviour is highly complex, with significant periodicities forming and shifting over the 7 years of the ASM dataset. This explains the range of modulations reported for this source over the years (e.g: Smale & Lochner 1992, PKM00). Of particular interest is the apparent convergence, reinforcement and subsequent divergence of periodicities about April 1996 - January 1999 (figure 7). Because the accretion disk is a fluid entity and the DPS overlap between data windows of the same order as the warp precession periods, we do not expect too discontinuous a change in the variation shape: in other words we expect the pattern (primary peak+single harmonic) to persist over a timescale of several data windows. At the point at which the strong DPS peak appears to split into two modes, we interpret the mode evolving towards lower frequencies as the dominant frequency, as it is more significant. It is thus easy to interpret this feature as a single periodicity with ill-defined phasing (hence the broad peaks in the DPS), with a period that changes in a manner superficially similar to SMC X-1, only on a much shorter period: 2 years compared to the 7 years of SMC X-1.
However, the behaviour may be more complex. Closer examination of the secondary peak at 40 days suggests it is not a simple harmonic of the primary period, as its period is some 20% longer than the expected location of the harmonic (see also PKM00). Furthermore, this structure is still present over the last 1500 days of the dataset, even though the fundamental it would be a harmonic of has all but disappeared. This feature may represent either (i) a slightly shifted harmonic that represents a deviation from a purely sinusoidal variation profile, or (ii) a mode of variation independent of the 59-day variation.
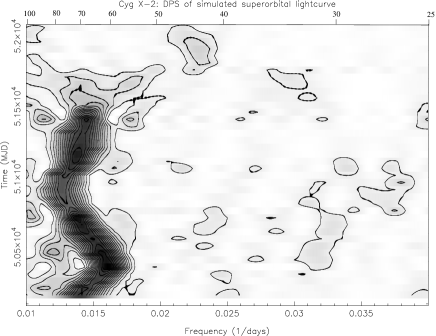
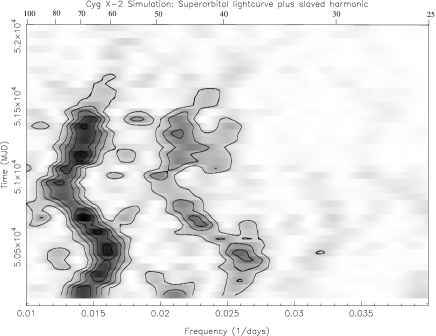
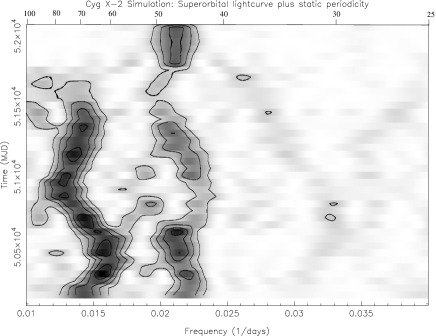
We can test which scenario describes Cyg X-2 better through simulations of varying periocicities. We take the superorbital lightcurve over day number 600-900 (from Jan 6 1996), then scale the period over time in a manner approximating our identified dominant periodicity. The DPS of this simulation is quite different in character to the real DPS (figure 12); the most obvious differences are its far lower significance and frequency than the 40-day periodicity actually seen. A 40-day periodicity was then artificially added but slaved to the fundamental to simulate a non-sinusoidal variation. The DPS structure that results varies more closely with the dominant periodicity than that actually seen. If the 40 day periodicity is made completely independent of the fundamental, however, by being held steady as the fundamental varies), the DPS that results is similar in morphology to that actually seen (figure 7).
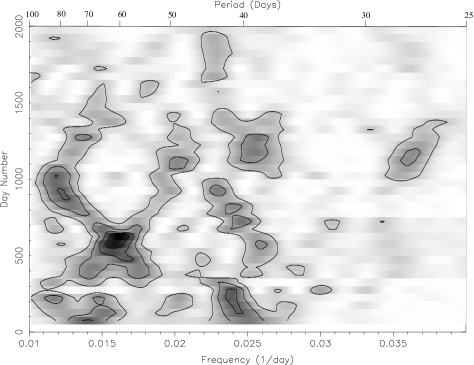
We thus suggest here that the apparently variable periodicity at days and the more stable periodicity at 40 days represent independent variations, rather than a single variation of non-sinusoidal shape. This suggestion is in agreement with the conclusion of an earlier analysis based on the static periodogram of the early years of the RXTE/ASM (PKM00). This suggestion gains some support when we notice that the 40-day periodicity is close to the expected harmonic of the 77-day periodicity reported in the archival Vela 5B and Ariel-5 datasets. To attempt to constrain the properties of this behaviour over a longer baseline, the Ariel-5 and Vela-5B datasets were subjected to DPS analysis. The Vela-5B dataset was used in the filtered, binned form provided by NASA HEASARC. Enough points were present to use the static periodogram to confirm the 77.4-day period already noted elsewhere (e.g: Smale & Lochner 1992), but not enough to follow its time evolution in a statistically significant way. However the Ariel-5 dataset has higher S/N, allowing less coarse binning and thus providing enough datapoints to permit DPS analysis. As figure 13 shows, the periodicities are highly variable over time, producing the highly complex structures seen in static periodograms (PKM00). The 77-day periodicity is strongly detected over the middle 400 days of the dataset, while its harmonic at 40 days is detected throughout most of the ASM dataset. However, as with the RXTE/ASM dataset, there is a further periodicity which appears variable and transient. Thus the apparent combination of two or more separate variations does not appear to be a new behaviour. Furthermore, this complex behaviour has now been confirmed using two independent datasets separated by 20 years.
The X-ray manifestation of the precessing warp may be different from that evidenced from the canonical disk precessing systems SMC X-1, Her X-1 and LMC X-4. Cyg X-2 shows a decrease in spectral hardness with count rate (figure 8), which at first sight would be inconsistent with a precessing warp. However, the variation of uncovered emitting area invoked to explain the superorbital periods in Her X-1 and LMC X-4 requires the column density through which the bulk of the X-rays reach RXTE to remain the same as the warp precesses. If, however, the emitting area is permanently obstructed by the outer accretion disk, assumed not to be a significant emitter in the ASM bandpass, the variation can be brought about by changing the column density through which the majority of the X-rays travel. In this case, the warped disk acts to subtract flux from the central source, rather than contributing significantly to any emission. This removal of flux will be seen as X-ray obscuration, which thereby causes the observed spectrum to harden.
6.4 Stability of Accretion Disks to Warping
We now use our results for the other systems showing superorbital modulations to test the stability framework of OD01. We first attempt to identify the warping modes corresponding to the superorbital variations identified in this work. With their stable behaviour in the DPS and simple superorbital lightcurves, Her X-1 and LMC X-4 show clear evidence for mode 0 warping. SMC X-1 shows a simple superorbital fold that varies over time, probably due to disk instabilities brought about as other modes begin to form (paper I). Cyg X-2 shows at least two independent modes of warping, thought to represent mode 0,1 and possibly higher warp modes.
The sources thus behave in ways qualitatively predicted by the stability analysis of OD01 (table 1). Her X-1 and LMC X-4 are both predicted to show stable mode 0 warping, which is indeed observed. SMC X-1 is thought to show warping commensurate with its position near the mode 0 and mode 1 regions. Cyg X-2 is deep within the region predicting mode 1 and higher modes, which is consistent with the appearance and interaction of at least two warping modes.
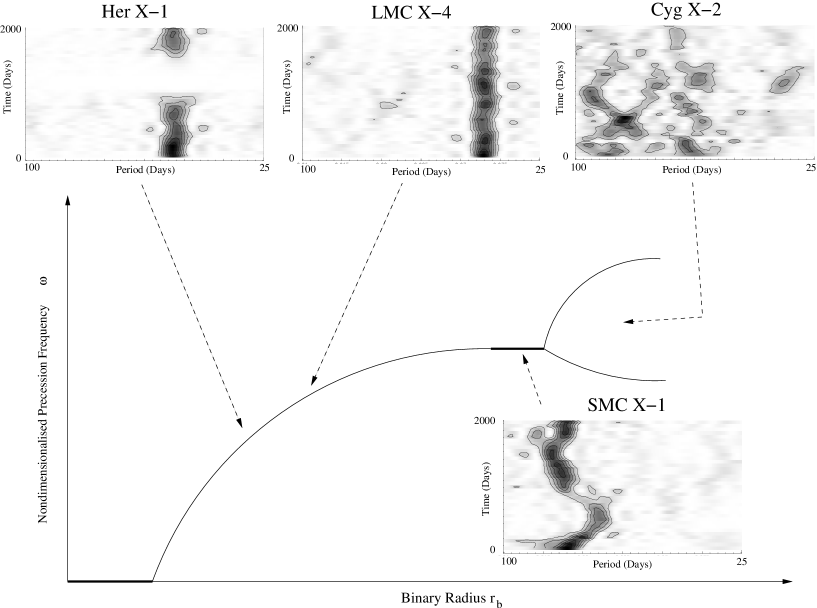
We illustrate the evolution of disk warping with binary radius in a schematic bifurcation diagram, shown in figure 14. This charts the evolution of precession solutions as the control parameter is increased. According to the OD01 predictions, for low values of the control parameter , no radiation-driven disk warping is predicted at present. In the region corresponding to stable mode 0 predicted warps, such warps are indeed found, with the precession frequency increasing with (Her X-1 and LMC X-4 type variations). Near the boundary between regions, modes begin to compete, producing an instability in the superorbital period (SMC X-1 type variations). Finally, once the boundary into full multi-mode variations is crossed, strong periodicities form and interact (Cyg X-2 type variations). When we overplot the location of these sources on the schematic, along with their DPS results, we find that the long-term behaviour of the sources agrees qualitatively with the predictions of table 1, as can be determined from the DPS of the sources.
7 Conclusion
We have analysed the time variation of superorbital periodicities present in three persistent neutron star XRB: Her X-1, LMC X-4 and Cyg X-2. Her X-1 shows a shift in phasing of the superorbital period shortly before entering its third Anomalous Low State, which we interpret as evidence for a change in disk inclination. LMC X-4 shows stable mode 0 warping, with little change over the period of the RXTE/ASM dataset. Cyg X-2 shows a combination of at least two separate modes of variation, suggesting more complex warping shape than for the other sources. Furthermore this behaviour has persisted for at least 1000 binary orbits, as shown by new analysis of the Ariel-5 dataset.
We have identified the most likely warping modes to produce the observed variations in Her X-1, LMC X-4 and Cyg X-2, and together with SMC X-1 have constructed an observational stability sequence based on their behaviour in the DPS. We find that this qualitatively agrees with the predictions of the stability analysis of OD01 and establishes the DPS as a powerful tool to probe XRB properties.
Acknowledgments
SGTL and WIC were in receipt of PPARC research studentships. WIC thanks Guillaume Dubus and the anonymous referee for insightful comments. This work was only made possible through the efforts of the ASM/RXTE team at MIT and NASA/GSFC. Archival Ariel-5 and Vela-5B data was obtained through the High Energy Astrophysics Science Archive Research Centre Online Service, provided by NASA/GSFC.
References
- [1] Alcock, C. et al., 1997 MNRAS 286, 483
- [2] Baykal, A., 1997 A&A 319, 515
- [3] Baykal, A., 2000 MNRAS 313, 637
- [4] Casares, J., Charles, P.A., Kuulkers, E., 1998 ApJ 493, L39
- [5] Charles, P.A. et al, 1983 MNRAS 202, 657
- [6] Charles, P.A., Clarkson, W.I., van Zyl., L., 2002 NewAst 7, 21
- [Chou, & Grindlay 2001] Chou Y. & Grindlay J.E., 2001 ApJ 563, 934
- [7] Chou, Y., Grindlay J. E., Bloser P. F, 2001 ApJ 549, 1135
- [8] Clarkson, W.I., et al, 2003 in prep
- [9] Clarkson W.I., Charles P.A., Coe M.J., Laycock S.G.T., Tout M.D., Wilson C.A. 2002 MNRAS, in press, astro-ph 0210241 (paper I)
- [10] Dubus, G., Lasota, J-P, Hameury, J-M, Charles, P.A., 1999 MNRAS 303, 139
- [11] Dubus, G., 2003 in preparation
- [12] Edwards, D. A., Pringle, J. E., 1987 MNRAS 229, 383
- [13] Frank, J., King, A.R., Raine, D.J, Accretion Power in Astrophysics, 3rd ed., 2002, CUP
- [14] Gerend, D., Boynton, P.E., 1976 ApJ 209, 562
- [15] Haberl, F., Stella, L., White, N.E., Gottwald, M., Priedhorsky, W.C., 1987 ApJ 314, 266
- [16] Haswell, C.A., King, A.R., Murray, J.R., Charles, P.A., 2001 MNRAS 321, 475
- [17] Heemskerk, M.H.M, van Paradijs, J., 1989 A&A 223, 154
- [Homer et al 2001] Homer L., 2001 MNRAS
- [18] Hynes, R.I., Haswell, C.A., Chaty, S., Shrader, C.R., Cui, W., 2002 MNRAS 331, 169
- [19] in ’t Zand, J.J.M., Baykal, A., Strohmayer, T.E., 1998 ApJ 496, 386
- [20] Kahn, S.M., Grindlay, J.E., 1984 ApJ 281, 826
- [21] King, A.R., Ritter, H., 1998 MNRAS 293, 42L
- [22] Kong, A.K.H., Charles, P.A., Kuulkers, E., 1998 NewAst, 3, 301
- [Lamb et al. 1975] Lamb D.Q. et al., 1975 ApJ 198L, 21
- [23] Leahy, D.A., Scott, D.M., 1998 ApJ 503, 63L
- [24] Leahy, D.A., Marshall, H., 1999 ApJ 521, 328
- [25] Leahy, D. A., Marshall, H., Scott, D. M., 2000 ApJ 542, 446
- [26] Levine, A. M., Bradt, H. V., Enevoldsen, A., Morgan, E. H., Remillard, R. A., Wen, L., Smith, D. A., 2000 HEAD #32, #43.07
- [27] Lubow S. H., 1991 ApJ, 321, 259
- [28] Margon, B., Deutsch, E. W., Leinhardt, Z. M., Anderson, S. F. 1999, IAU Circ., 7144
- [29] Middleditch, J., Nelson, J., 1976 ApJ 208, 567
- [30] Moon, D-S., Eikenberry, S.S., 2001 ApJ 549, 225L
- [31] Mukerjee, K., Agrawal, P. C., Paul, B., Rao, A. R., Yadav, J. S., Seetha, S., Kasturirangan, K., 2001 ApJ 548, 368
- [Ogilvie & Dubus 2001] Ogilvie G. I., Dubus G., 2001 MNRAS 320,485 (OD01)
- [32] Oosterbroek, T., Parmar, A. N., Orlandini, M., Segreto, A., Santangelo, A., Del Sordo, S. 2001 A&A 375, 922
- [33] Oosterbroek, T., Parmar, A.N., Dal Fiume, D., Orlandini, M., Santangelo, A., Del Sordo, S., Segreto, A., 2000 A&A 353, 575
- [34] Orosz, J.A., Kuulkers, E., 1999 MNRAS 305, 132
- [35] Parmar, A.N., Pietsch, W., McKechnie, S., White, N.E., Trümper, J., Voges, W., Barr, P., 1985, Nature 313, 119
- [36] Paul B., Kitamoto S., Makino F., 2000 ApJ 528, 410 (PKM00)
- [37] Paul, B., Kitamoto, S., 2002 JApA 22, 33
- [Petterson 1977] Petterson J. 1977, ApJ 218, 783
- [38] Reig, P., Papadakis, I., Kylafis, N. D., 2003 A&A 398, 1103
- [39] Retter, A., Chou, Y., Bedding, T. R., Naylor, T., 2002 MNRAS 330, 37L
- [Reynolds et al 1993] Reynolds A.P., Hilditch R.W., Bell S.A., Hill G., 1993 A&A 261, 337
- [Rutten, van Paradijs & Tinbergen 1992] Rutten R.G.M., van Paradijs J. & Tinbergen, J. 1992, A&A 260, 213
- [Scargle 1982] Scargle J. D., 1982, ApJ 263, 835
- [Scargle 1989] Scargle J. D., 1989, ApJ 343, 874
- [40] Schandl, S., Meyer, F., 1994 A&A 289, 149
- [41] Schandl. S., 1996, A&A 307, 95
- [42] Scott, D.M., Leahy, D.A., Wilson, R.B., 2000 ApJ 539, 392
- [Smale & Lochner 199X] Smale A.P., Lochner, J., 1992, ApJ 395, 582
- [Still2001] Still, M., O’Brien, K., Horne, K., Boroson, B., Titarchuk, L.G, Engle, K., Vrtilek, S.D., Quaintrell, H., Fiedler, L., 2001, ApJ 554, 352
- [Tanaka1997] Tanaka Y., 1997., Lecture Notes in Physics Vol. 487, Accretion Disks - New Aspects, eds. E. Meyer-Hofmeister & H. Spruit (Berlin: Springer), p1
- [43] Tennant, A.F., Fabian, A.C., Shafer, R.A., 1986 MNRAS 219, 871
- [44] Timmer, J., König, M., 1995 A&A, 300, 707)
- [Trümper et al 1986] Trümper J., et al., 1986 ApJ 300L, 63
- [45] van der Klis, M., 1995, in X-ray Binaries, eds. W.H.G.Lewin, J.van Paradijs, E.P.J.van den Heuvel, C.U.P., p252
- [46] van Kerkwijk, M.H., van Oijen, J.G.J., van den Heuvel., E.P.J., 1989 A&A 209, 173
- [47] van Kerkwijk, M. H., Chakrabarty, D.,; Pringle, J. E., Wijers, R. A. M. J., 1998 ApJ 499, 27L
- [48] van Paradijs, J., 1996 ApJ 464, 139L
- [49] Vrtilek, S. D., Boroson, B., Primini, F. A., Raymond, J. C., McCray, R., Smale, A., Kallman, T., Nagase, F., 1997 AAS #191, #110.14; Bulletin of the AAS, 29, 1389
- [50] Vrtilek, S.D. et al., 1994 ApJ 436, L9
- [51] Vrtilek S. D., Raymond, J. C., Garcia, M. R., Verbunt, F., Hasinger, G., Kurster, M., 1990 A&A 235, 162
- [Wehlau et al 1992] Wehlau A. et al., 1992 AJ 103, 1583
- [52] White, N.E., Angelini, L., 2001 ApJ 561, 101L
- [53] Whitehurst R., 1988, MNRAS, 321, 35
- [54] Whitehurst R., King A. R., 1991, MNRAS, 321, 25
- [Wijers & Pringle 1999] Wijers R. A. M. J., Pringle J. E., 1999, MNRAS 308, 207
- [55] Wijnands, R.A.D., Kuulkers, E., Smale, A.P., 1996 ApJ 473, 45L
- [Wojdowski et al 1998] Wojdowski P., Clark G. W., Levine A. M., Woo J. W., Zhang S. N., 1998, ApJ 502, 253