CI and CO in the nearby spiral galaxies IC 342 and Maffei 2
Received ????; accepted ????)
We present =2–1, =3–2, =4–3 and 492 GHz [CI] maps as well as =2–1 and =3–2 measurements of the central regions in the nearby Sc galaxies IC 342 and Maffei 2. In both galaxies. the distribution of CO and [CI] is strongly concentrated towards the center. These centers harbour modest starbursts. Both galaxies have nearly identical transitional ratios but the relative intensities of their and [CI] emission lines differ significantly. The observed sets of line intensities require modelling with a multi-component molecular gas. In both galaxies, a dense component must be present () with kinetic temperatures = 10–20 K (IC 342) or 20–60 K (Maffei 2), as well as a less dense (IC 342: a few hundred at most; Maffei 2: ) and hotter ( = 100–150 K) component. In both galaxies, neutral and ionized atomic carbon amounts are between 1.5 and 2.5 times those of CO. In both starburst centers about half to two thirds of the molecular gas mass is associated with the hot PDR phase. The center of IC 342 contains within = 0.25 kpc an (atomic and molecular) gas mass of 1 and a peak face-on gas mass density of about 70 pc-2. For Maffei 2 these numbers are less clearly defined, mainly because of uncertainties in its distance and carbon abundance. We find a gass mass , and a peak face-on gas mass density of about 35 pc-2.
Key Words.:
Galaxies – individual (IC 342; Maffei 2) – ISM – centers; Radio lines – galaxies; ISM – molecules1 Introduction
| IC 342 | Maffei 2 | |
|---|---|---|
| Typea | SABcd | SABbc |
| Optical Centre: | ||
| R.A. (B1950)b | 03h41m58.6s | 02h38m08.0s |
| Decl.(B1950)b | +67∘56′26′′ | +59∘23′24′′ |
| R.A. (J2000) | 03h46m49.7s | 02h41m54.6s |
| Decl.(J2000) | +68∘05′45′′ | +59∘36′11′′ |
| Radio Centre : | ||
| R.A. (B1950)c | 03h41m57.3s | 02h38m08.4s |
| Decl.(B1950)c | +67∘56′27′′ | +59∘23′30′′ |
| +35 | –31 | |
| Inclination | 25∘ | 67∘ |
| Position angle | 39∘ | 26∘ |
| Distance | 1.8 Mpc | 2.7 Mpc |
| Luminosity | 2 LB⊙ | 1 LB⊙ |
| Scale | 115 ′′/kpc | 77 ′′/kpc |
Notes to Table 1:
a RSA (Sandage Tammann 1987)
b Dressel Condon (1976);
c Hummel Gräve (1990); Turner Ho (1994)
d Rots (1979); Newton (1980); Hurt et al. (1996)
e McCall (1989) for IC 342; for Maffei 2 see text
f Buta McCall (1999), assuming Galactic foreground for IC 342 = 3.32 mag (Madore
Freedman (1992); for Maffei 2 an uncertain foreground = 8 mag is assumed.
| Transition | Object | Date | Freq | Beam | t(int) | Map Parameters | |||||
| Size | Points | Size | Spacing | P.A. | |||||||
| (MM/YY) | (GHz) | (K) | () | (sec) | () | () | (∘) | ||||
| =2–1 | IC 342 | 02/89 | 230 | 1290 | 21 | 0.63 | 600 | 16 | 4080 | 8 | 70 |
| 01/96 | 640 | 0.69 | 60 | 52 | |||||||
| Maffei 2 | 01/96 | 490 | 0.69 | 240 | 25 | 4860 | 12 | 25 | |||
| =3–2 | IC 342 | 04/94 | 345 | 735 | 14 | 0.58 | 180 | 39 | 3272 | 8 | 70 |
| Maffei 2 | 12/93 | 1854 | 0.53 | 400 | 10 | 3648 | 6 | 27 | |||
| 11/94 | 1465 | 0.58 | 240 | 33 | |||||||
| 12/00 | 565 | 0.63 | 120 | 77 | 6080 | 8 | 27 | ||||
| =4–3 | IC 342 | 12/93 | 461 | 8000 | 11 | 0.53 | 600 | 8 | 2440 | 8 | 70 |
| 04/94 | 2170 | 0.53 | 400 | 14 | |||||||
| Maffei 2 | 04/94 | 3200 | 0.53 | 480 | 7 | 3036 | 6 | 25 | |||
| 07/96 | 3700 | 0.53 | 360 | 26 | |||||||
| =2–1 | IC 342 | 02-89 | 220 | 1440 | 21 | 0.63 | 900 | 5 | 3030 | 15 | 0 |
| Maffei 2 | 01-96 | 550 | 0.69 | 2400 | 1 | ||||||
| =3–2 | IC 342 | 04-94 | 330 | 2170 | 14 | 0.58 | 6000 | 1 | |||
| 01-96 | 1660 | 0.58 | 1560 | 5 | 1616 | 8 | 0 | ||||
| Maffei 2 | 01-96 | 2800 | 0.58 | 2400 | 1 | ||||||
| CI 3P1–3P0 | IC 342 | 11-94 | 492 | 5250 | 10 | 0.53 | 800 | 27 | 2448 | 8 | 70 |
| Maffei 2 | 12-93 | 4885 | 0.53 | 3200 | 1 | ||||||
Molecular gas is a major constituent of the interstellar medium in galaxies. Within the inner kiloparsec, many spiral galaxies exhibit a strong concentration of molecular gas towards their nucleus. We have conducted a programme to observe a number of nearby galaxies in various CO transitions and in the 492 GHz 3P1–3P0 CI transition in order to determine the physical condition of such central molecular gas concentrations. Results on NGC 253 (Israel, White Baas 1995), NGC 7331 (Israel Baas 1999), NGC 6946 and M 83 = NGC 5236 (Israel Baas 2001) have already been published. In this paper, we present the results for the very nearby galaxies IC 342 and Maffei 2 whose basic properties are summarized in Table 1.
Both are major members of the IC 342/Maffei group, which is located at a distance of about 2 Mpc (Huchtmeier et al., 2000 and references therein). This appears to be the galaxy group closest to the Local Group but it is, unfortunately, located in the sky very close to the Galactic plane. Consequently, its members suffer high foreground extinction rendering several of them, including Maffei 2, all but invisible at optical wavelengths. Mainly for this reason, the distance of Maffei 2 is still quite uncertain. However, it is usually assumed that it exceeds that of IC 342. We have thus assumed a distance of 2.7 Mpc which is in line with the overall cluster value, but 50 per cent greater than the reasonably well established distance to IC 342. Both IC 342 and Maffei 2 have been studied well at longer wavelengths, including those of the CO line. Inasmuch as IC 342 is, together with NGC 253 and M 82, one of the strongest (sub)millimeter line emitters in the sky, it has been observed frequently. In the =1–0 transition of , it was one of the first galaxies mapped at resolution (Morris Lo 1978; Rickard Palmer 1981; Young Scoville 1982). More extensive mapping of the and isotopes in both the =1–0 and =2–1 transitions was presented by Eckart et al. (1990) and Xie et al. (1994). Emission in the =3–2 transition was detected and mapped by Ho et al. (1987), Steppe et al. (1990) and Irwin Avery (1992), while the isotope was detected in this transition by Wall Jaffe (1990) and Mauersberger et al. (1999). Finally, the =4–3 and, with a somewhat uncertain calibration, the = 6–5 transitions were detected by Güsten et al. (1993) and Harris et al. (1991). The isotope ratio was determined to be by Henkel et al. (1998). High-resolution aperture synthesis maps of IC 342 have been published in =1–0 and by Ishizuki et al. (1990), Turner Hurt (1992), Wright et al., (1993) and Sakamoto et al. (1999), and in =2–1 and by Turner et al., (1993) and Meier et al. (2000).
Maffei 2 was first detected in by Rickard et al. (1977) and subsequently mapped at 23′′ resolution by Weliachew et al. (1988). Emission in the =2–1 and =3–2 transitions was measured by Wall et al. (1993) and Mauersberger et al. (1999). Maffei 2 was mapped in =1–0 and by Ishiguro et al. (1989) and Hurt Turner (1991), in =2–1 by Sargent et al. (1985) and in =3–2 by Hurt et al. (1993).
Although the molecular line emission from Maffei 2 is somewhat weaker than that from IC 342, both are frequently included in the same observing programs. Both have been observed in a great variety of other molecular species: CS (Mauersberger Henkel, 1989; Mauersberger et al., 1989; Sage et al., 1990; Paglione et al., 1995), HCN and HCO+ (Nguyen-Q-Rieu et al., 1992; Downes et al., 1992; Jackson et al. 1995; Paglione et al. 1997), H13CO+ and N2H+ (Mauersberger Henkel, 1991); HNC (Hüttemeister et al., 1995), CN and HC3N (Henkel et al. (1988), HNCO (Nguyen-Q-Rieu et al. 1991), OCS (Mauersberger et al., 1995) as well as H2CO and CH3OH (Hüttemeister et al., 1997). In particular the discovery of strong NH3 emission, first from IC 342 (Ho et al. 1990 and references therein), then from Maffei 2 (Henkel et al. 2000; Takano et al. 2000) showed that a significant fraction of the molecular gas in the centers of these galaxies is both dense and hot.


2 Observations
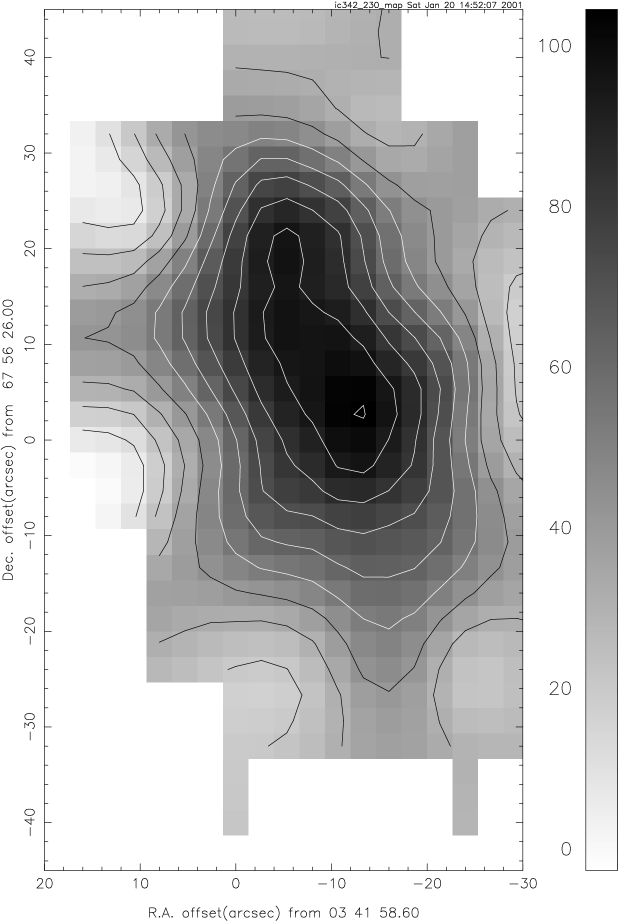
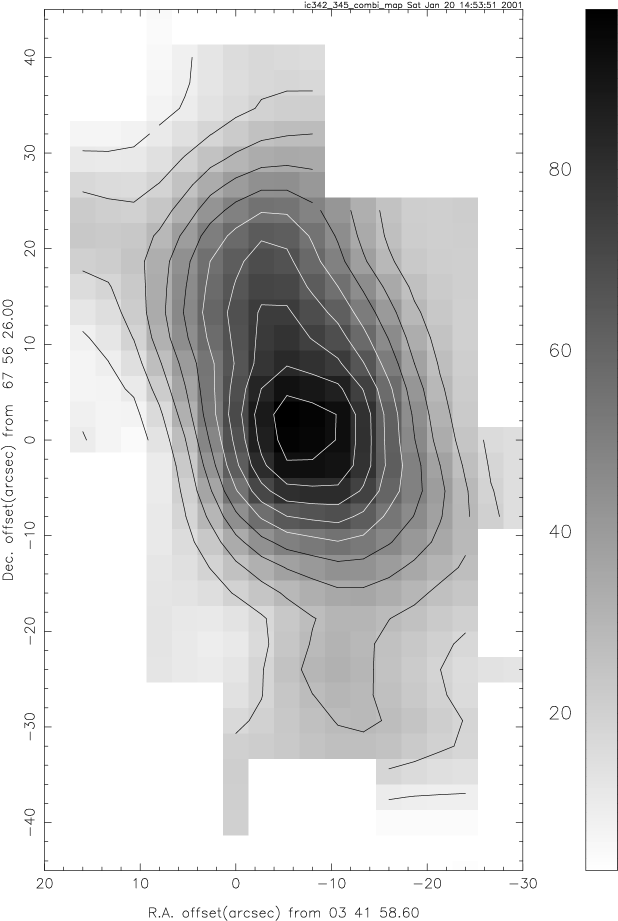
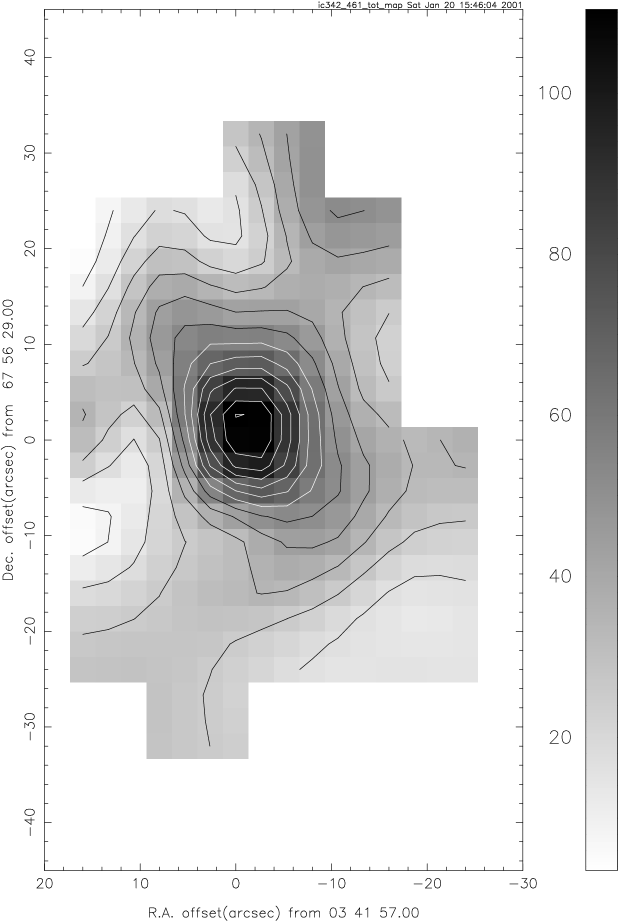
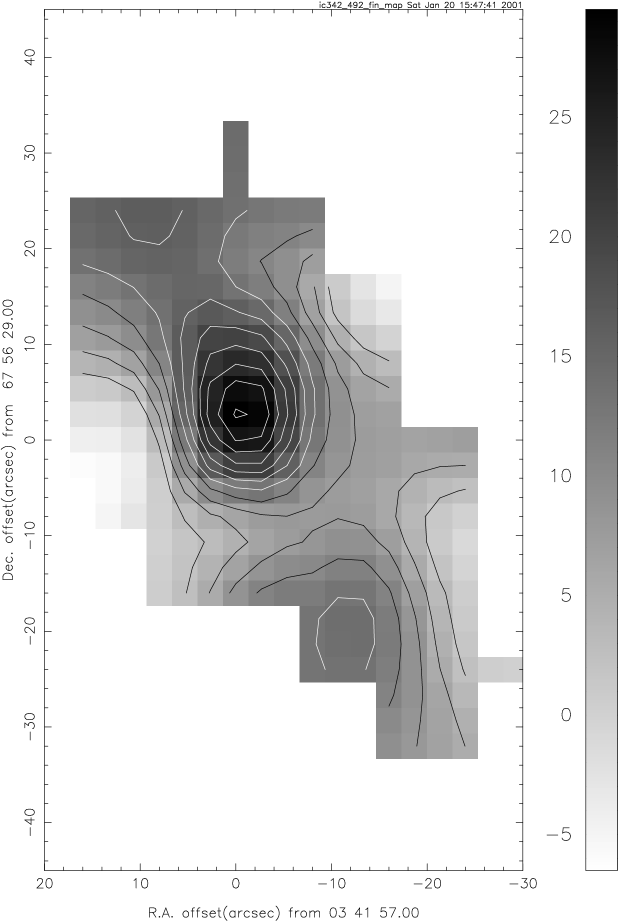
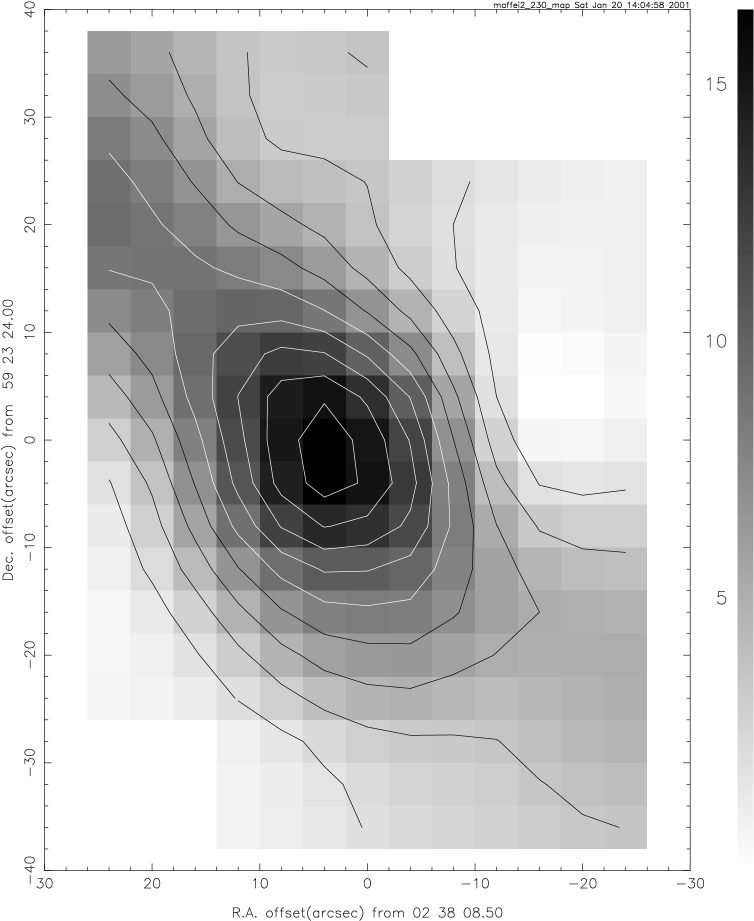
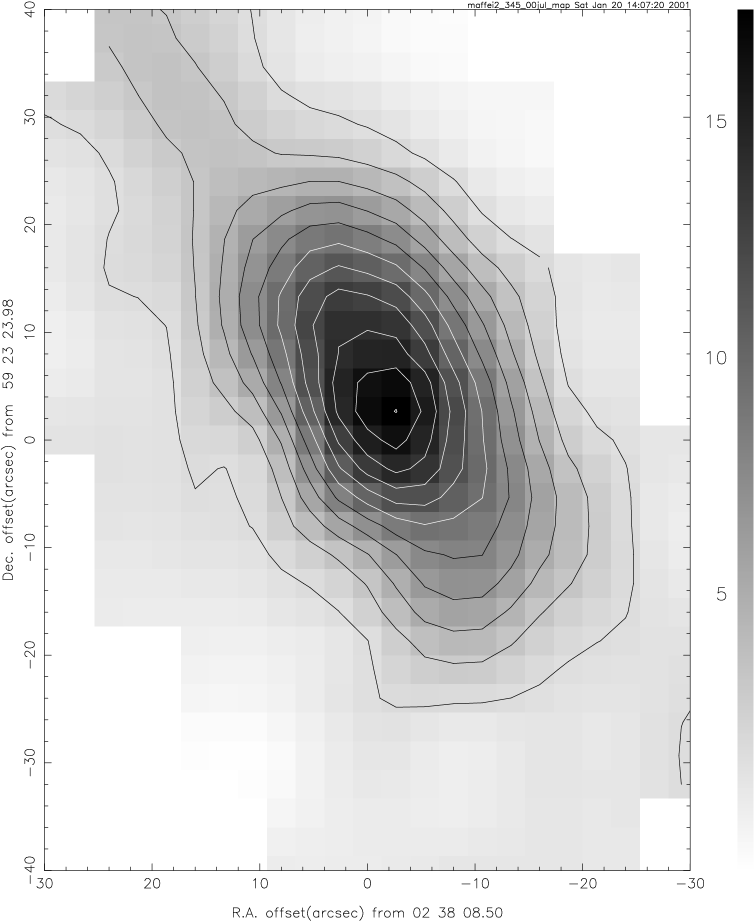
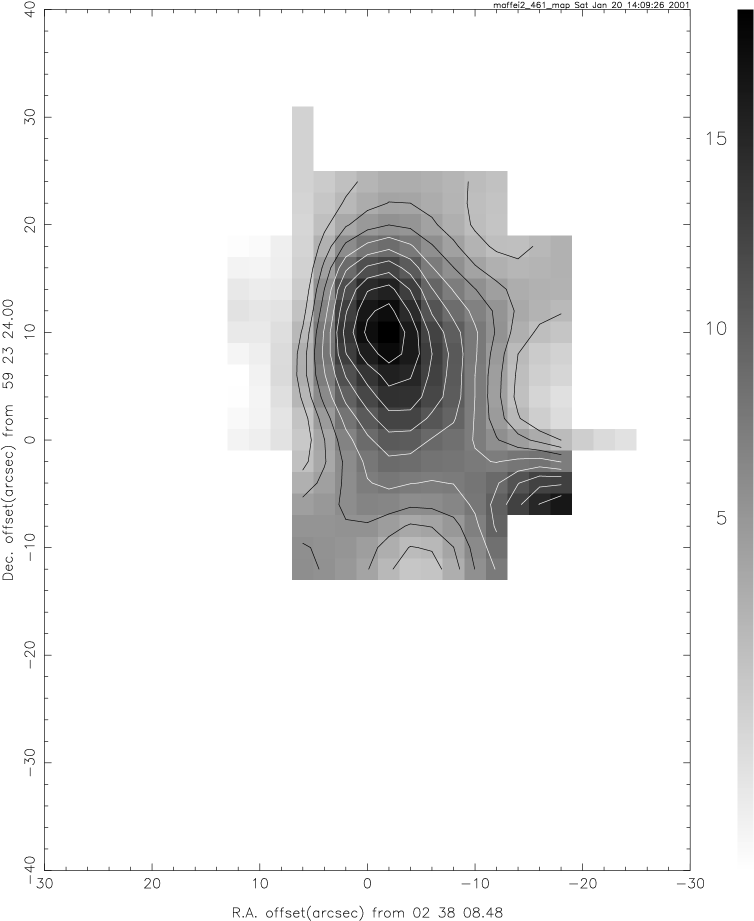
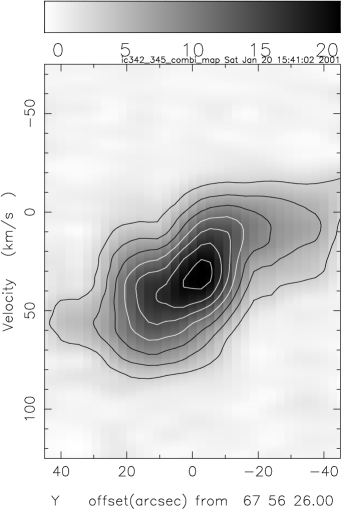
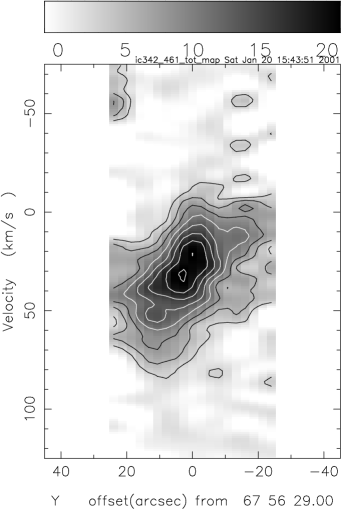
All observations described in this paper were carried out with the 15m James Clerk Maxwell Telescope (JCMT) on Mauna Kea (Hawaii) 111The James Clerk Maxwell Telescope is operated on a joint basis between the United Kingdom Particle Physics and Astrophysics Council (PPARC), the Netherlands Organisation for Scientific Research (NWO) and the National Research Council of Canada (NRC).. Details are given in Table 2. Up to 1993, we used a 2048 channel AOS backend covering a band of 500 MHz ( at 230 GHz). After that year, the DAS digital autocorrelator system was used in bands of 500 and 750 MHz. Integration times given in Table 2 are typical values used in mapping; central positions were usually observed more than once and thus generally have significantly longer integration times. Values listed are on+off. When sufficient free baseline was available, we subtracted second or third order baselines from the profiles. In all other cases, linear baseline corrections were applied. All spectra were scaled to a main-beam brightness temperature, = /; relevant values for are given in Table 2. Spectra of the central positions in both galaxies are shown in Fig. 1 and summarized in Table 3. In Table 2, we have also listed the parameters describing the various maps obtained. All maps are close to fully sampled. In all maps, the mapping grid was rotated by the angle given in Table 2 so that the Y axis coincided with the galaxy major axis. The velocity-integrated maps shown in Figs. 2 and 3 have been rotated back, so that north is (again) at top and the coordinates are right ascension and declination. For IC 342, the map grid origin in the =2–1 and =3–2 CO maps is within a few arcseconds from the optical centre listed in Table 1, whereas the =4–3 and [CI] maps find their origin close to the radio centre; the two sets of maps are thus offset from one another by , = +9′′, -3′′. For Maffei 2, the grid origin is again close to the optical centre; the radio centre occurs in the maps nominally at , = -0.8′′, +6′′.
| IC 342 | Maffei 2 | |||||||
| Transition | Resolution | a | d | b | a | d | b | |
| () | (mK) | () | kpc2 | (mK) | () | kpc2 | ||
| =2–1 | 21 | 3090 | 17219 | 15.4 | 1500 | 24535 | 11.6 | |
| 43 | 9814 | 10615 | ||||||
| =3–2 | 14 | 3140 | 18623 | 10.4 | 1650 | 29535 | 7.6 | |
| 21 | 12613 | 16515 | ||||||
| =4–3 | 11 | 4020 | 20921 | 4.6 | 1950 | 40550 | 5.7 | |
| 14 | 17619 | 28035 | ||||||
| 21 | 11514 | 16025 | ||||||
| =2–1 | 21 | 476 | 24.03 | — | 150 | 224 | — | |
| 43 | 12.02 | — | ||||||
| =3–2 | 14 | 311 | 17.12 | — | 200 | 204 | — | |
| 21 | 14.42 | — | ||||||
| [CI] | 3P1–3P0 | 10 | 1030 | 546 | 1.0 | 190 | 377 | — |
| 14 | 428 | — | ||||||
| 21 | 277 | — | ||||||
Notes to Table 3: a. Beam centered on nucleus; b. Total central concentration
| Transitions | IC 342 | Maffei 2 | ||
|---|---|---|---|---|
| Nucleus | Total Center | Nucleus | Total Center | |
| (1–0)/(2–1)a | 0.950.1 | 0.9 | 0.90.2 | 0.8: |
| (3–2)/(2–1)b | 0.730.10 | 0.7 | 0.750.13 | 0.7 |
| (4–3)/(2–1)b | 0.670.10 | 0.3 | 0.650.10 | 0.5 |
| / (1–0)c | 10.71.3 | — | 8.61.1 | — |
| / (2–1)b | 7.21.5 | — | 10.01.4 | — |
| / (3–2)d | 10.21.4 | — | 12.41.7 | — |
| CI/CO(2–1)b | 0.160.03 | 0.06 | 0.100.05 | — |
| CII/CO(2–1)e | 0.54 | 0.31 | ||
Notes: a. IC 342 ratio from Eckart et al. (1990), Xie et al. (1994) and Meier et al. (2000); Maffei 2 ratio from =1–0 data by Weliachew et al. (1988); both ratios at 21′′ resolution. b. This Paper, JCMT at 21′′ resolution; c. Weighted mean based on ratios presented by Rickard Blitz (1985); NRAO at 65′′ resolution; Young Sanders (1986); FCRAO at 45′′ resolution; Weliachew et al. (1988); IRAM 30 m at 24′′ resolution; Sage Isbell (1991); NRAO 12m at 57′′ resolution; Xie et al. (1994) FCRAO at 45′′ resolution; Meier et al. (2000) OVRO at 4.′′5 resolution d. This Paper; JCMT at 14′′ resolution. e. From Crawford et al. (1985) and Stacey et al. (1991), KAO at 55′′ resolution; JCMT convolved to 55′′ resolution.
3 Results
3.1 CO distribution
In both galaxies, molecular gas as traced by CO is strongly concentrated towards the center. The central molecular source is contained with 250 pc in the case of IC 342, and pc in the case of Maffei 2, where is the true distance of Maffei 2 in Mpc.
CO line aperture synthesis maps of IC 342 show, at resolutions of 2′′–4′′, considerable structure only hinted at in our maps (Fig. 2). Clearly, the central CO concentration is not toroidal in shape. Rather, the maps published by Sakamoto et al. (1999) and Meier et al. (2000) show individual CO peaks (cloud complexes) distributed along a perspectively foreshortened double spiral – although the foreshortening seems more than expected for an inclination of only 25∘. The molecular gas enhancement of spiral arms ends at about = 250 pc from the nucleus. The nucleus itself is located at a minimum in the CO distribution. Emission from the high-density tracer HCN offers a very similar appearance (Downes et al. 1992). Our =2–1 12CO map shows an elongated source, in which a smoothed version of the high-resolution map by Meier et al. (2000) is easily recognized. Emission in all our CO maps, as well as the [CI] map peaks at the position coinciding with cloud complex B in the designation by Downes et al. (1992). This peak becomes more pronounced with increasing level, and in [CI]. This is partly the consequence of increasing angular resolution, but we also note that the peak coincides with the strongest concentration of thermal radio continuum emission (Turner Ho 1983), thus with the region containing the highest spatial density of early type stars. The peak line intensities in Table 3 and the line ratios in Table 4 refer to this maximum. We thus expect them to exhibit properties commensurate with a starburst environment, i.e. those of a photon-dominated region (PDR).
The region corresponding to complexes C and D (Downes et al. 1992), referred to as ‘Eastern Ridge’ by Eckart et al. (1990), behaves differently. It is almost as pronounced as region B in the =2–1 transition, but fades rapidly at higher levels. Its molecular gas must thus be cooler on the whole than that of region B. This is, in any case, consistent with the much less impressive appearance of this region in the radio continuum maps by Turner Ho (1983). There appear to be relatively weak, secondary maxima in the neutral carbon emission at the northern and southern edges of the main CO distribution, in addition to the primary [CI] maximum at cloud B.
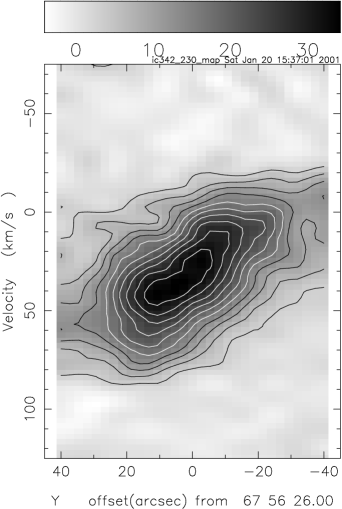
The major-axis position-velocity map of IC 342 covers a relatively small velocity range, in accordance with the mostly face-on orientation of the galaxy. With increasing level, hence increasing resolution and decreasing beamsmearing, the rotation steepens. In the =4–3 CO p-V map the central material covers a range of about 80 km s-1 over about 20′′. The rotation in this region is characterized by a velocity gradient (cf. =4–3 CO in Fig. 4 and =1–0 CO in Fig. 4 of Sakamoto et al. 1999) d/d = 7.8 /′′ , corresponding to d/d 2.1 /pc in the plane of the galaxy.
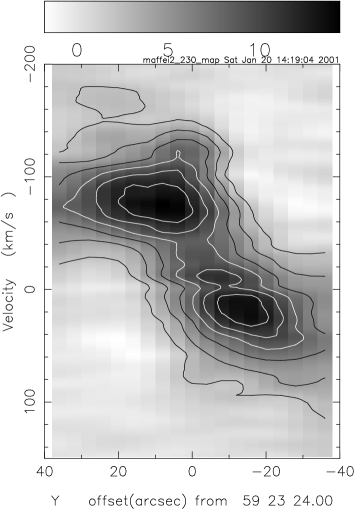
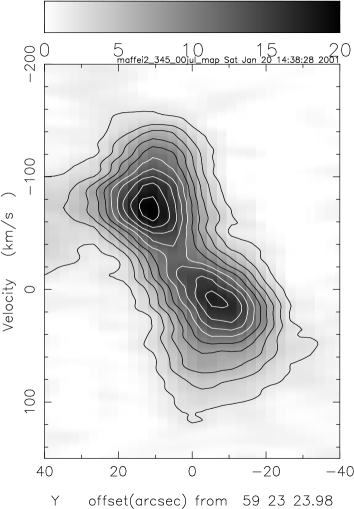
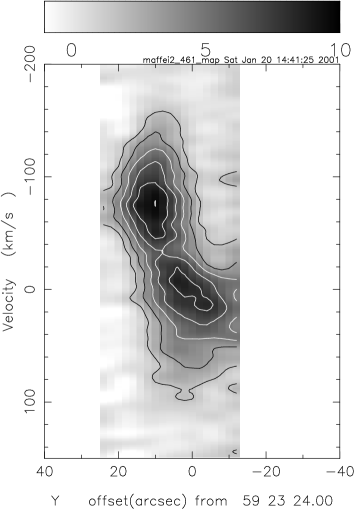
The structure of the central CO source in Maffei 2 is more complex than Fig. 3 suggests. The galaxy is much more tilted than IC 342, and the integrated velocity images, showing only a resolved but featureless central source, are misleading. Maps of peak temperature rather than integrated-velocity temperature maps show a distinct double-peaked source (see also Hurt et al. 1993). This is in sharp contrast to IC 342, where peak-temperature and integrated-temperature maps show only marginally different morphologies. The deceptively simple appearance of Maffei 2 in Fig. 3 is easily explained by a glance at the major axis position-velocity maps in Fig. 5. The single peak in the integrated map results from the line-of-sight superposition of two distinct velocity components. This is, in fact, the same situation that we found to apply to NGC 253 (Israel et al. 1995), and it is one to watch out for in all high-inclination galaxies. The CO source in Fig. 3 becomes more compact with increasing level, i.e. increasing frequency. As can be seen in Fig. 5, this is mostly the consequence of increasing resolution and decreasing beamsmearing. In the peak-temperature maps (not shown) the separation of the two peaks is only 13′′ (corresponding to 170 pc). The CO distribution shown in Figs. 3 and 5 is characteristic for a toroidal distribution of molecular gas, with a 45 – 60 pc wide gap in the center. However, the ‘S’-shaped morphology of CO in high-resolution (6′′) aperture synthesis maps by Ishiguro et al. (1989) and Hurt Turner (1991) strongly suggests greatly enhanced emission from molecular gas in inner spiral arms instead.
The effects of beamsmearing are quite noticeable in the p-V maps in Fig. 5. The average velocity gradient increases from 4.5 in the =2–1 CO map to about 18 in the =4–3 CO map. The latter value corresponds to d/d = 1.4 /pc, i.e. not much different from the gradient in IC 342 (or NGC 6946 and M 83 for that matter – see Israel Baas 2001). We note that the CO distribution in Fig. 5 just fills the steep leading edge of the major axis HI distribution in Maffei 2 (Fig. 9 in Hurt et al. 1996).
3.2 Line ratios
We have determined the intensity ratio of the observed transitions at the centers of both galaxies; all intensities are normalized to those of the =2–1 line. The columns in Table 4 marked ‘Nucleus’ refer to ratios in a 21′′ beam centered on the nucleus, with the exception of the [CII]/CO(2–1) ratio which was determined after convolution of the =2–1 12CO measurements to the 55′′ beam of the [CII] observations, and the 12CO/13CO isotopic ratio which represents a weighted mean from a number of determinations at various resolutions. The [CII] intensities (Crawford et al. 1985; Stacey et al. 1991), were converted to velocity-integrated temperatures to obtain the line ratios in Table 4. The columns marked ‘Total Center’ refer to the intensities of the central concentration integrated over the source extent in the maps. The apparent decrease in source extent going from the lower levels (lower frequencies) to the higher frequencies is mostly an artifact of limited resolution. When corrected for finite beamwidth, source dimensions at e.g. the =2–1 and =4–3 transitions are in fact very similar. Nevertheless, the smaller area coverage in the [CI] and =4–3 CO maps may ahve led to an underestimate of the total intensity. The entries in Table 4 suggest that this may indeed be the case. The =1–0/=2–1 ratios have relatively large uncertainties, because we could not use observations of our own, but instead have used estimated =1–0 intensities reduced to a 21′′ beam from the references given in the table. These ratios are, in any case, close to unity.
The 12CO ratios are quite similar for both galaxies, but the intensity of the [CI] and [CII] lines relative to CO is significantly lower in Maffei 2 than in IC 342, suggesting stronger PDR effects in the latter. The intensity of the [CII] line indicates the presence of both high temperatures and high gas densities in the medium as the critical values for this transition are 91 K and . At the same time, such values must be reconciled with the much lower temperatures and (column) densities implied by the more modest isotopic ratios in the lower CO transitions. These isotopic ratios differ for the two galaxies. For each individual transition the isotopic ratios just agree within the errors, but the overall patterns are clearly different. For Maffei 2, the isotopic ratio increases with increasing level, but for IC 342 the isotopic ratio is minimal in the =2–1 transition. These differences suggest significant differences in the molecular gas properties at the positions sampled in both galaxies
4 Analysis
4.1 Modelling of CO
| Model | Component 1 | Component 2 | Relative | ||||
| Kinetic | Gas | CO Column | Kinetic | Gas | CO Column | CO Emission | |
| Temperature | Density | Density | Temperature | Density | Density | Component 1:2 | |
| ) | (CO)/d | ) | (CO)/d | ||||
| (K) | () | () | (K) | ( | () | ||
| IC 342 | |||||||
| 1 | 150 | 1000 | 3 | 150 | 3000 | 0.6 | 0.65 : 0.35 |
| 2 | 100 | 1000 | 3 | 100 | 3000 | 1 | 0.35 : 0.65 |
| 3 | 10 | 10000 | 3 | 100 | 3000 | 1 | 0.25 : 0.75 |
| Maffei 2 | |||||||
| 4 | 150 | 500 | 10 | 150 | 3000 | 0.3 | 0.25 : 0.75 |
| 5 | 150 | 100 | 10 | 60 | 10000 | 0.6 | 0.50 : 0.50 |
| 6 | 100 | 100 | 10 | 20 | 100000 | 0.3 | 0.30 : 0.70 |
| 7 | 10 | 3000 | 6 | 150 | 3000 | 0.6 | 0.35 : 0.65 |
| Model | Beam-Averaged Column Densities | Total Central Mass | Face-on Mass Density | Relative Mass | ||||
| (CO) | (C) | Components 1:2 | ||||||
| () | () | () | (/pc-2) | |||||
| IC 342; = 2200; (HI) | ||||||||
| 1 | 0.8 | 2.3 | 3.3 | 0.5 | 0.6 | 49 | 67 | 0.7 : 0.3 |
| 2 | 0.7 | 3.8 | 4.8 | 0.7 | 0.9 | 70 | 96 | 0.4 : 0.6 |
| 3 | 0.7 | 1.0 | 4.9 | 0.7 | 1.0 | 72 | 99 | 0.3 : 0.7 |
| Maffei 2; = 2500; (HI) | ||||||||
| 4 | 1.7 | 1.6 | 3.5 | 0.6 | 0.9 | 28 | 43 | 0.55 : 0.45 |
| 5 | 3.6 | 1.3 | 5.5 | 0.9 | 1.4 | 43 | 64 | 0.8 : 0.2 |
| 6 | 2.6 | 1.1 | 4.1 | 0.7 | 1.1 | 32 | 49 | 0.7 : 0.3 |
| 7 | 2.0 | 1.9 | 4.4 | 0.7 | 1.1 | 32 | 53 | 0.55 : 0.45 |
Notes: a. Newton (1980); b. Hurt et al. (1996)
The observed and line intensities and ratios have been modelled with the large-velocity gradient (LVG) radiative transfer models described by Jansen (1995) and Jansen et al. (1994). These provide model line intensities as a function of three input parameters: gas kinetic temperature , molecular hydrogen density and CO column density per unit velocity (/d). By comparing model line ratios to the observed ratios we have identified the physical parameters best describing the actual conditions in the observed source. Beam-averaged properties are determined by comparing observed and model intensities. In principle, with seven measured line intensities, properties of a single gas component are overdetermined as only five independent observables are required. We found that no single-component fit could be made to the data of either IC 342 or Maffei 2.
However, good fits based on two gas components can be obtained. In order to reduce the number of free parameters, we assume identical CO isotopical abundances for both gas components and assign the specific value [12CO]/[13CO] = 40 (Mauersberger Henkel 1993; Henkel et al. 1998). We identified acceptable fits by searching a grid of model parameter combinations (10 K 250 K, , ) for model line ratios matching the observed set, with the relative contribution of the two components as the single free parameter. Largely as a consequence of the non-negligible finite errors in the line ratios, solutions are not unique, but rather delineate a range of values in a particular region of parameter space. To a certain extent, variations in input parameters may compensate for one another, leading to identical line ratios for somewhat different combinations of input parameters. We have rejected all solutions in which the denser gas component is also hotter than the more tenuous component, as we consider this physically unlikely on the linear scales observed. From the remainder of solutions, we have selected characteristic examples and listed these in Table 5.
The line ratios observed for IC 342 allow only a rather limited range of gas parameters. One of the two components has well-determined parameters: a column density /d = 6–10 , an density of 3000 ) and a kinetic temperature of 100 – 150 K. The other gas component either is less dense and equally hot, or denser and much cooler with a temperature of the order of 10 – 20 K. For Maffei 2, the choice of models is less restricted. Possible solutions pair a low-density, hot component and rather large column densities with a much denser, low-column density component of uncertain temperature. Alternatively, both components have a reasonably high density of 3000 , but represent either a low temperature/high column-density or a high temperature/low column-density gas.
A further check on the validity of the model results is provided by the C18O measurements obtained by Eckart et al. (1990). This isotope was not included in our modelling requirements. For isotopic ratios between 12CO/C18O = 250 (model 1) and 12CO/C18O = 225 (model 3), the parameters of our solutions reproduce the observed intensity ratios in the =1–0 and =2–1 transitions within 10.
4.2 Beam-averaged molecular gas properties
The relation between carbon monoxide, neutral and ionized carbon combines the observed C and C+ intensities with the chemical models by Van Dishoeck Black (1988) which show a strong dependence of the column density ratio on total carbon and molecular hydrogen column densities. In the analysis of [CI], we took the kinetic temperatures, densities and filling factors resulting from the CO analysis, and then solved for column density . In practice, the column density of one component is frequently well-determined, whereas that of the other is more or less degenerate. For this reason, we solved for identical velocity dispersions in the two gas components. This procedure we also followed for [CII]; in those cases where both model kinetic temperature and gas density are very different for the two components, we have modelled a single [CII] component with the higher kinetic temperature and the higher gas density of the two components. This applies specifically to models 5 and 6 (see below). Finally, we have related total carbon (i.e. C + CO) column densities to molecular hydrogen column densities by using an estimated [C]/[H] gas-phase abundance ratio.
IC 342 has a measured central abundance [O]/[H] = 2.0 10-3 (Vila-Costas Edmunds 1992, Garnett et al. 1997). We are unaware of any abundance determination for Maffei 2, and therefore use the mean value for the spiral galaxies listed by Zaritzky et al. (1994), [O]/[H] = 1.7 10-3. Then, using the results obtained by Garnett et al. (1999), notably their Figs. 4 and 6, we have estimated carbon abundances [C]/[H] = 1.70.5 10-3 and 1.450.5 10-3 for IC 342 and Maffei 2 respectively. As a significant fraction of carbon is tied up in dust particles and thus unavailable in the gas-phase, we have adopted a fractional correction factor = 0.27 (see for instance van Dishoeck Black 1988), so that = [2(HI)] = A [(CO) + (C)], where A = 2200 and 2500 for IC 342 and Maffei 2 respectively. The numerical parameter A is uncertain by about a factor of two.
In Table 6, we present beam-averaged column densities for both CO and C (Co and C+), and column densities derived under the assumptions just discussed. We also present the total masses estimated to be present in the central molecular concentration calculated from listed in Table 3, and the face-on mass densities implied by hydrogen column density and the galaxy inclination. Notwithstanding the differences between the model cloud parameters, the beam-averaged results in Table 6 are rather similar: hydrogen column densities, masses and mass-densities are well within a factor of two from one another. Beam-averaged neutral carbon to carbon monoxide column density ratios range from (Co)/(CO) = 0.5–0.6 for IC 342 to (Co)/(CO) = 0.15–0.3 for Maffei 2. These values are well within the range found for other late-type galaxies such ad M 82, NGC 253, M 83, and NGC 6946 (White et al. 1994; Israel et al. 1995; Stutzki et al. 1997; Petitpas Wilson 1998; Israel Baas, 2001).
4.3 The center of IC 342
Even before the model fitting described in the previous section, the center of IC 342 was identified as the abode of hot and dense molecular gas, first by Martin et al. (1982) and Martin Ho (1985) who found the presence of gas with kinetic temperatures estimated to be 70 K or higher. Somewhat later, measurements of the high-density tracer HCN led Downes et al. (1992) to suspect the presence of molecular gas at various densities in the range and kinetic temperatures in the range = 50 – 70 K. This gas consisted of a few dense cloud complexes and much less dense gas inbetween. Multitransition HCN measurements (Jackson et al. 1995; Paglione et al. 1997) and other molecules (Paglione et al. 1995; Mauersberger et al 1995; Hüttemeister et al 1997; Henkel et al 2000) suggest kinetic temperatures in the range of 50 - 200 K, densities of about 10 as well as the presence of additional gas components at lower densities. Such temperatures and densities are not unexpected for the site of a significant burst of star formation (cf. Turner Ho, 1983; 1994). The PDR model calculations by Kaufman et al. (1999), applied to the relative intensities of CO, [CI], [CII] and the far-infrared continuum of the center of IC 342 likewise suggest a temperature 150 K, a density around 10 and an ambient radiation field strength log = 2.5 ( expressed in units of the Habing Field, i.e. erg s-1 cm-2. All three model solutions in Table 5 are consistent with these values, although the higher densities suggested by the other molecular line observations are only provided by model 3. More support for model 3 follows from the C18O aperture synthesis observations carried out by Meier Turner (2001) who find that the molecular cloud complexes have densities of the order of 1000–3000 and, more importantly, kinetic temperatures of 10–40 K (see also Meier et al. 2000). We thus accept model 3 as the most probable approximation of the physical conditions in the central molecular gas of IC 342. About a third of the total molecular mass resides in a dense, fairly cold component with an excitation temperature close to the kinetic temperature, and very high optical depths in all observed CO transitions; even the 13CO transitions are marginally optically thick with = 1–2. Most of the remaining mass is hot, with Tex = 50 K. The =1–0 12CO transition is optically thin, but the higher transitions are optically thick although optical depths are not extremely high.
Obviously, actual conditions will be more varied and complex, but even then we expect the beam-averaged results to be not very different from the ones obtained here. We find a total central gas mass of about 107 which agrees well with estimates derived from e.g. HCN observations, but is much lower than the mass values quoted in previous CO studies. However, these were all based on assumed CO to ratios, notably the column density to CO intensity ratio . The column densities and masses presented in this paper are, in contrast, based on total gas-phase carbon amounts and the actual carbon abundance. The uncertainty in these results is essentially determined by the error in the product [C]/[H], which is hard to quantify, but which we estimate to be about a factor of two. A mass of is not very high, yet it is about 10 of the dynamical mass with = 130 pc; this renders any value much higher rather unlikely. Model 3 implies for IC 342 a value mol cm-2/, i.e. almost an order of magnitude lower than commonly used values for the Galactic Solar Neighbourhood. However, such a low value is not uncommon for a galactic center. We have found similar values for NGC 6946 and M 83 (Israel Baas 2001), and such values are by now solidly established for the center of our own Milky Way (Sodroski et al. 1995; Oka et al 1998; Dahmen et al. 1998). As an important consequence of these low values for and beam-averaged , the abundances of all molecular species that were derived using erroneously estimated much higher column densities must be revised upwards by almost an order of magnitude. This is particularly important in the case of IC 342. Because it is one of the few galaxies bright in molecular line emission, it has extensively been used as the basis for abundance determinations of a relatively great variety of molecular species.
4.4 The center of Maffei 2
In a similar vein, rough estimates of conditions to be found in the center of Maffei 2 follow from observations of HCN, CS and other molecules: densities in the range and probably closer to the former than to the latter, as well as kinetic temperatures of about 100 K (Mauersberger et al. 1989; Hüttemeister et al. 1997; Paglione et al. 1997). The relative intensities of CO, CI, CII and the far-infrared continuum imply, within the context of the PDR model by Kaufman et al. (1999), somewhat higher densities close to 10, temperatures of about 150 K and a radiation field log = 2.3. These temperatures and densities suggest that models 5 and 6 are more appropriate than models 4 and 7 which lack the high densities that appear to be required. Models 5 and 6 are not fundamentally different. They consist of a rather low density (), hot ( = 100–150 K) and very optically thick ( = 15–20 for =1–0) component and a more dense, cooler component of relatively low optical thickness. The actual temperature and density of the latter component is not firmly established. As can be seen in Table 5, temperatures between 20 and 60 K and densities between and 10 can be obtained by varying the relative contributions of the two gas components, requiring only that the ratio is kept constant. The ionized carbon intensities can only be explained by postulating the presence of a hot and dense gas phase not sampled by the CO observations but rather resulting from extensively photodissociated and ionized gas (interface with HII regions and supernova remnants?). A similar situation was found to apply in M 83 (Israel Baas, 2001).
In any case, the molecular medium in the center of Maffei 2 appears to be significantly different from that in the center of IC 342. In Maffei 2, the dense phase is warmer and probably denser, and its hot phase is much less dense. Maffei 2 is experiencing a strong central starburst comparable to the one in IC 342. A difference between the two, at least at radio wavelengths, is that Maffei 2 and M 83 have much larger amounts of nonthermal emission than IC 342 (Turner Ho 1983, 1994). This suggests that the starbursts in Maffei 2 and M 83 are more evolved than the one in IC 342, perhaps explaining the molecular gas differences as well.
As the distance and metallicity of Maffei 2 have not been measured, we have had to assume plausible values. This is an additional source of uncertainty in the column densities, the masses and the mass densities derived for Maffei 2 in Table 6. As the observed HI column densities are much less than the model-inferred total H column densities, column densities, masses and mass densities scale linearly with the actual carbon abundance, whereas the and gas masses scale with the actual distance squared. Because it is unlikely that the distance of Maffei 2 differs much from the adopted value of 2.7 Mpc, the error in the derived mass due to this uncertainty is not more than about a factor of two. The derived value is subject to uncertainties in the carbon abundance but not to those in the distance. The values listed in Table 6 imply for Maffei 2 an /CO conversion ratio mol cm-2/, so that the same comment made for IC 342 also applies to Maffei 2.
5 Conclusions
-
1.
Maps of the central arcminute of the nearby starburst galaxies IC 342 and Maffei 2 in various transitions of and , and in [CI] confirm the compact nature of the central molecular gas emission in both galaxies. Most of this gas is within a 200 parsec from the nucleus. In both galaxies, the molecular gas seems to reside in bright inner spiral arms, rather than a disk or torus.
-
2.
Relative 12CO line intensities observed in matched beams are virtually identical in IC 342 and Maffei 2. However, relative 13CO intensities, as well as the intensities of the [CI] and [CII] lines differ significantly, indicating different physical conditions for the molecular gas in the two galaxies. The observed line ratios require modelling with a multi-component molecular medium in both galaxies.
-
3.
In IC 342, a dense component with and 10 K is present together with a less dense and hotter 100 K component. Total carbon column densities are about 1.5 times the CO column density. The modelling solution for IC 342 is reasonably well-defined.
-
4.
In Maffei 2, the parameters of the two components minimally required are less clearly defined. The more tenuous component has and 100 - 150 K, whereas the denser component has and = 20 – 60 K. Maffei 2 seems to be more affected by CO dissociation as it has a C/CO ratio of two to three.
-
5.
In both starburst centers a significant fraction of the molecular mass (about half to two thirds) is associated with the hot PDR phase.
-
6.
With an estimated gas-phase [C]/[H] abundance of order 4 , the centers of NGC 6946 and M 83 contain within = 0.25 kpc similar (atomic and molecular) gas masses of about . Peak face-on gas mass densities are typically 70 pc-2 for IC 342 and 35 pc-2 for Maffei 2, but the results for the latter are subject to relatively large errors caused by uncertainties in its distance and its carbon abundance.
Acknowledgements.
We are indebted to Ewine van Dishoeck and David Jansen for providing us with their detailed radiative transfer models. We thank the JCMT personnel for their support and help in obtaining the observations discussed in this paper.References
- (1) Buta R.J. McCall M.L., 1999, ApJS 124, 33
- (2) Crawford M.K., Genzel R., Townes C.H. Watson D.M., 1985 A&A 291, 755
- (3) Dahmen G., Hüttemeister S., Wilson T.L. Mauersberger R., 1998 A&A 331, 959
- (4) Downes D., Radford S.J., Guilloteau S., et al., 1992, A&A 262, 424
- (5) Dressel L.L., Condon J.J. 1976, ApJS 31, 187
- (6) Eckart A., Downes D., Genzel R., et al., 1990, ApJ 348, 434
- (7) Garnett D.R., Shields G.A., Skillman E.D., Sagan S.P. Dufour R.J., 1997, ApJ 489, 63
- (8) Garnett D.R., Shields G.A., Peimbert M., et al. 1999 ApJ 513, 168
- (9) Güsten R., Serabyn E., Kasemann C., et al., 1993 ApJ 402, 537
- (10) Harris A.I., Hills R.E., Stutzki J., et al. 1991. ApJL 382, L75
- (11) Henkel C., Mauersberger R. Schilke P., 1988, A&A 201, L23
- (12) Henkel C., Chin Y.-N, Mauersberger R. Whiteoak J.B., 1998 A&A 329, 443
- (13) Henkel C., Mauersberger R., Peck A.B., Falcke H. Hagiwara Y., 2000, A&A 361, L45
- (14) Ho P.T.P., Turner J.L. Martin R.N., 1987, ApJL 322, L67
- (15) Ho P.T.P., Martin R.N., Turner J.L. , Jackson J.M., 1990, ApJL 355, L19
- (16) Huchtmeier W.K., Karachentsev I.D. Karachentseva V.E., 2000 in: Small Galaxy Groups, IAU Symp. 174; ASP Conference Series Vol. 209, Eds. M.J. Valtonen C. Flynn; p. 158
- (17) Hummel E. Gräve R., 1990 A&A 228, 315
- (18) Hurt R.L. Turner J.L., 1991, ApJ 377, 434
- (19) Hurt R.L., Turner J.L., Ho, P.T.P. Martin R.N., 1993, ApJ 404, 602
- (20) Hurt R.L., Turner J.L. Ho P.T.P, 1996 ApJ 466, 135
- (21) Hüttemeister S., Henkel C., Mauersberger R., et al., 1995, A&A 295, 571
- (22) Hüttemeister S., Mauersberger R. Henkel C., 1997, A&A 326, 59
- (23) Irwin J.A. Avery L.W., 1992, ApJ 388, 328
- (24) Ishiguro M., Kawabe R., Morita K.-I., et al., 1989, ApJ 344, 763
- (25) Ishizuki S., Kawabe R., Ishiguro M., et al., 1990 Nature 344, 224
- (26) Israel F.P., White G.J. Baas F., 1995, A&A 302, 343
- (27) Israel F.P. Baas F., 1999 A&A 351, 10
- (28) Israel F.P. Baas F., 2001 A&A 371, 433
- (29) Jackson J.M., Paglione T.A.D., Carlstrom J.E. Rieu N.-Q., 1995, ApJ 438, 695
- (30) Jansen D.J., 1995, Ph.D. thesis, University of Leiden (NL)
- (31) Jansen D.J., van Dishoeck E.F. Black J.H., 1994, A&A , 282, 605
- (32) Kaufman M.J., Wolfire M.G., Hollenbach D.J. Luhman M.L., 1999 ApJ 527, 795
- (33) Madore B.F. Freedman W.L., 1992 PASP 104, 362
- (34) Martin R.N., Ho P.T.P. Ruf K., 1982 Nature 296, 632
- (35) Martin R.N. Ho P.T.P., 1985 ApJL 308, L7
- (36) Mauersberger R. Henkel C., 1989 A&A 223, 79
- (37) Mauersberger R. Henkel C., 1991 A&A 245, 457
- (38) Mauersberger R. Henkel C., 1993 Rev. Mod. Astron. 6, 69
- (39) Mauersberger R., Henkel C. Chin Y.N., 1995, 294, 23
- (40) Mauersberger R., Henkel C., Wilson T.L. Harju J., 1989 A&A 226, L5
- (41) Mauersberger R., Henkel C., Walsh W. Schulz A., 1999 A&A 341, 256
- (42) McCall M.L., 1989, AJ 97, 1341
- (43) Meier D.S., Turner J.L. Hurt R.L., 2000, ApJ 531, 200
- (44) Meier D.S. Turner J.L., 2001 ApJ 551, 687
- (45) Morris M. Lo K.Y., 1978 ApJ 223, 803
- (46) Newton K., 1980, MNRAS 191, 169
- (47) Oka T., Hasegawa T., Hayashi M., Handa T. Sakamoto S., 1998 ApJ 493, 370
- (48) Paglione T.A.D., Jackson J.M., Ishizuki S. Rieu, N.-Q., 1995 AJ 109, 1716
- (49) Paglione T.A.D., Jackson J.M. Ishizuki S., 1997 ApJ 484, 656
- (50) Petit-Pas G.R. Wilson C.D., 1998 ApJ 503, 219
- (51) Rickard L.J, Palmer P., Morris M., Turner B.E. Zuckerman B., 1977 ApJ 213, 673
- (52) Rickard L.J Blitz L., 1985 ApJL 292, L57
- (53) Rickard L.J Palmer P.M., 1981 A&A 102, L13
- (54) Rieu, N.-Q., Henkel C., Jackson J.M. Mauersberger R., 1991, A&A 241, L33
- (55) Rieu, N.-Q., Jackson J.M., Henkel C., Bach T. Mauersberger R., 1992, ApJ 399, 521
- (56) Rots A.H., 1979 A&A 80, 255
- (57) Sage L.J., Shore S.N. Solomon P.M., 1990, ApJ 351, 422
- (58) Sage L.J. Isbell D.W., 1991 A&A 247, 320
- (59) Sakamoto K., Okumura S.K., Ishizuki S. Scoville N.Z., 1999 ApJS 124, 403
- (60) Sandage A. Tammann G.A., 1987, A Revised Shapley-Ames Catalog of Bright Galaxies, second edition, Carnegie Institution of Washington Publication 635 (Washington, D.C.: Carnegie Institution of Washington).
- (61) Sargent A.I., Sutton E.C., Masson C.R., Lo, K.Y. Phillips T.G., 1985, ApJ 289, 150
- (62) Sodroski T.J., Odegard N., Dwek E., et al. 1995 ApJ 452, 262
- (63) Stacey G.J., Geis N., Genzel R., et al. 1985 A&A 373, 423
- (64) Steppe H., Mauersberger R., Schulz A. Baars J.W.M., 1990, A&A 233, 410
- (65) Stutzki J., Graf U.U., Honingh C.E., et al. 1997, ApJL 477, 33
- (66) Takano S., Nakai N., Kawaguchi K. Takano T., 2000, PASJ , 52, L67
- (67) Turner J.L. Ho P.T.P., 1983 ApJ 268, L79
- (68) Turner J.L. Ho P.T.P., 1994 ApJ 421, 122
- (69) Turner J.L. Hurt R.L., 1992, ApJ 384, 72
- (70) Turner J.L., Hurt R.L. Hudson D.Y., 1993, ApJL 413, L19
- (71) van Dishoeck E.F. Black J.H., 1988, ApJ 334, 771
- (72) Vila-Costas M.B. Edmunds M.G. 1992 MNRAS 259, 121
- (73) Wall W.F. Jaffe D.T., 1990, ApJL 361, L45
- (74) Wall W.F., Jaffe D.T., Israel F.P., Bash F.N., Maloney P.R. Baas F., 1993 ApJ 414, 98
- (75) Weliachew L., Casoli F. , Combes F., 1988, A&A 199, 29
- (76) White G.J., Ellison B., Claude S., Dent W.R.F. Matheson D.N., 1994, A&A 284, L23
- (77) Wright M.C.H., Ishizuki S., Turner J.L., Ho P.T.P Lo K.Y., 1993 ApJ 406, 470
- (78) Xie S., Young J.S. Schloerb F.P., 1994, ApJ 421, 434
- (79) Young J.S. Sanders D.B., ApJ 302, 680
- (80) Young J.S. Scoville N.Z., 1982 ApJ 258, 467
- (81) Zaritsky D., Kennicutt R.C. Huchra J.P., 1994, ApJ 420, 87