email: Georges.Meynet@obs.unige.ch
email: Andre.Maeder@obs.unige.ch
Stellar evolution with rotation X:
We examine the properties of Wolf–Rayet (WR) stars predicted by models of rotating stars taking account of the new mass loss rates for O–type stars and WR stars (Vink et al. Vink00 (2000), Vink01 (2001); Nugis & Lamers NuLa00 (2000)) and of the wind anisotropies induced by rotation. We find that the rotation velocities of WR stars are modest, i.e. about 50 km s-1, not very dependant on the initial and masses. For the most massive stars, the evolution of is very strongly influenced by the values of the mass loss rates; below 12 M⊙ the evolution of rotation during the MS phase and later phases is dominated by the internal coupling. Massive stars with extreme rotation may skip the LBV phase.
Models having a typical for the O–type stars have WR lifetimes on the average two times longer than for non–rotating models. The increase of the WR lifetimes is mainly due to that of the H–rich eWNL phase. Rotation allows a transition WN/WC phase to be present for initial masses lower than 60 M⊙. The durations of the other WR subphases are less affected by rotation. The mass threshold for forming WR stars is lowered from 37 to 22 M⊙ for typical rotation. The comparisons of the predicted number ratios WR/O, WN/WC and of the number of transition WN/WC stars show very good agreement with models with rotation, while this is not the case for models with the present–day mass loss rates and no rotation. As to the chemical abundances in WR stars, rotation brings only very small changes for WN stars, since they have equilibrium CNO values. However, WC stars with rotation have on average lower C/He and O/He ratios. The luminosity distribution of WC stars is also influenced by rotation. tars: evolution – rotation – Wolf–Rayet
Key Words.:
S1 Introduction
Wolf–Rayet stars play an important role in Astrophysics, as signatures of star formation in galaxies and starbursts, as injectors of chemical elements and of the radioactive isotope 26Al, as sources of kinetic energy into the interstellar medium and as progenitors of supernovae and maybe as progenitors of –ray bursts. As rotation affects all outputs of stellar models (Meynet & Maeder MMV (2000)), the main purpose of the present paper is to examine some consequences of rotation on the properties of Wolf–Rayet (WR) stars.
Let us recall some difficulties faced by non–rotating stellar models of WR stars. A good agreement between the predictions of the stellar models for the WR/O number ratios and the observed ones at different metallicities in regions of constant star formation was achieved provided the mass loss rates were enhanced by about a factor of two during the MS and WNL phases (Meynet & al. Mey94 (1994)). This solution, which at that time appeared reasonable in view of the uncertainties pertaining to the mass loss rates, is no longer applicable at present. Indeed, the estimates of the mass loss rates during the WR phase are reduced by a factor of 2 to 3, when account is taken of the clumping effects in the wind (Nugis and Lamers NuLa00 (2000); Hamann and Koesterke Ha99 (1999)). Also, the mass loss rates for O–type stars have been substantially revised (and in general reduced) by the new results of Vink et al. (Vink00 (2000), Vink01 (2001)), who also account for the occurrence of bi–stability limits which change the wind properties and mass loss rates. In this new context, it is quite clear that with these new mass loss rates the predicted numbers of WR stars by standard non–rotating models would be much too low with respect to the observations.
A second difficulty of the standard models with mass loss was the observed number of transition WN/WC stars. These stars simultaneously show some nitrogen characteristics of WN stars and some carbon of the further WC stage. The observed frequency of WN/WC stars among WR stars is around 4.4 % (van der Hucht Hu01 (2001)), while the frequency predicted by the standard models without extra mixing processes are lower by 1–2 orders of magnitude (Maeder & Meynet MaeMey94 (1994)). A third difficulty of the standard models as far as WR stars were concerned was that there were relatively too many WC stars with respect to WN stars predicted (see the review by Massey Mas03 (2003)). These difficulties are the signs that some process is missing in these models.
We explore here the effects of rotation on the WR stars and their formation. Rotation already improved many predictions of the stellar models, bringing better agreement with the observations. In particular, star models with rotation have at last enabled us (Maeder & Meynet MMVII (2001)) to solve the long–standing problem of the large number of observed red supergiants at low metallicities in the SMC, while current models with any kind of reasonable mass loss usually predicted almost no red supergiants at low . Also, in addition to several other points, the new models also show significant He– and N–enhancements in O–type stars on the MS (Heger and Langer He00 (2000); Meynet & Maeder MMV (2000)), as well as in supergiants at various metallicities, as required by observations.
Sect. 2 summarizes the physics of these models. The evolution of the inner and surface rotation is discussed in Sect. 3. The evolutionary tracks are shown in Sect. 4. The effects of rotation on the WR star formation process and on the WR lifetimes are discussed in Sect. 5. Comparisons with the observed WR populations are performed in Sect. 6. Finally the predicted abundances in WR stars are discussed in Sect. 7.
2 Physics of the models
The present grid of models at solar metallicity is based in general on the same physical assumptions as in the grid by Meynet & Maeder (MMV (2000), paper V). However, in addition we include here several improvements that have appeared since. These are:
-
•
As reference mass loss rates in the case of no rotation, we use the recent data by Vink et al. (Vink00 (2000); Vink01 (2001)). A bi–stability limit intervenes at T K and produces some steep changes of the mass loss rates during MS evolution. For the domain not covered by these authors we use the results by de Jager et al. (Ja88 (1988)). Since the empirical values for the mass loss rates employed for non–rotating stars are based on stars covering the whole range of rotational velocities, we must apply a reduction factor to the empirical rates to make them correspond to the non–rotating case. The same reduction factor as in Maeder & Meynet (MMVII (2001)) was used here.
-
•
During the Wolf–Rayet phase we apply the mass loss rates proposed by Nugis and Lamers (NuLa00 (2000)). These mass loss rates, which account for the clumping effects in the winds, are smaller by a factor 2–3 than the mass loss rates used in our previous non–rotating stellar grids (Meynet et al. Mey94 (1994)).
-
•
The significant increases of the mass loss rates with rotation are taken into account as explained in Maeder & Meynet (2000a ). This treatment, in contrast to the one usually used (Friend and Abbott Fr86 (1986)), accounts for the non–uniform brightness of rotating stars due to the von Zeipel theorem and for the fact that the Eddington factor is also a function of the rotation velocity. Due to the non–uniform brightness of a rotating star, the stellar winds are anisotropic. The rotation–induced anisotropy of the stellar winds is also accounted for during the Main Sequence (MS) phase according to the prescription of Maeder (Ma02 (2002)). For O–type stars, the polar winds are enhanced and this means that these stars lose a lot of mass, but a moderate amount of angular momentum. For stars cooler than T K, the equatorial ejection becomes significant and leads to a larger ejection of angular momentum. After the MS phase, the ratios of the surface angular velocity to the break–up velocity are in general much too low for the anisotropies to be important. Interestingly enough, in cases of extreme mass loss such as in WR stars, the timescale for the transmission of the extra torque applied at the stellar surface by the anisotropies is longer than the timescale for the mass removal of the considered layers, so that the effects of the anisotropies of the stellar winds on the internal rotation are rather limited (Maeder Ma02 (2002)).
-
•
In paper V, we did not account for the effects of horizontal turbulence on the shears (Talon & Zahn TaZa97 (1997)). We account for it in the present work in the same manner as we did in paper VII (Maeder & Meynet MMVII (2001)). Let us recall that the horizontal turbulence, expressed by a diffusion coefficient , tends to reduce the shear mixing in regions of steep –gradients, making the diffusion coefficient proportional to rather than to , the thermal diffusivity. The difference can be large and it leads to smaller surface enhancements in the products of CNO burning. In regions of low –gradients, the horizontal turbulence moderately increases the shear diffusion coefficient, making it proportional to rather than to only, with little consequence for the surface enrichments.
-
•
A moderate overshooting is included in the present rotating and non–rotating models. The radii of the convective cores are increased with respect to the values obtained by the Schwarzschild criterion by a quantity equal to 0.1 Hp, where Hp is the pressure scale height evaluated at the Schwarzschild boundary.
-
•
As in paper VIII (Meynet & Maeder MMVIII (2002)), the opacities are from Iglesias & Rogers (IR96 (1996)), complemented at low temperatures with the molecular opacities of Alexander (http://web.physics.twsu.edu/alex/wwwdra.htm). The nuclear reaction rates are also the same as in paper VIII and are based on the new NACRE data basis (Angulo et al. Ang99 (1999)).
-
•
The initial composition is changed with respect to paper V: the mass fraction of hydrogen is X = 0.705, the mass fraction of helium Y = 0.275. For the heavy elements, we adopt the same mixture as the one used to compute the opacity tables for solar composition.
The effect of rotation on the transport of the chemical species and the angular momentum are accounted for as in our papers VII and VIII. All the models were computed up to the end of the helium–burning phase.
3 Evolution of the rotation
3.1 Global view: the effects of coupling and mass loss
The evolution of the rotation velocities at the stellar surface depends mainly on 2 factors, the internal coupling and the mass loss.

1.– The coupling mechanisms transport angular momentum in the stellar interiors. The extreme case of strong coupling is the classical case of solid body rotation. In this case when mass loss is small, the star reaches the critical velocity during the MS phase more or less quickly depending on the initial rotation as shown by Sackman & Anand (Sa70 (1970); see also Langer La97 (1997)). In that case, coupling ensures that increases when the radius of the star increases. Let us recall that for to increase when the radius of the star increases, its suffices that decreases less steeply with the radius than (), or expressed in another way, if then increases with the radius when . In the case of no coupling, i.e. of local conservation of the angular momentum, rotation becomes more and more subcritical (). In the present models, the situation is intermediate, with a moderate coupling due mainly to meridional circulation, which is more efficient (Meynet & Maeder MMV (2000)) than shear transport, as far as transport of angular momentum is concerned.
2.– For a given degree of coupling, the mass loss rates play a most critical role in the evolution of the surface rotation. As shown by the comparison of the models at and (Maeder & Meynet MMVII (2001)), for masses greater than 20 M⊙ the models with solar composition have velocities that decrease rather rapidly, while at the velocities go up. Thus, for the most massive stars with moderate or strong coupling, the mass loss rates are the main factor influencing the evolution of rotation.

Below a mass of about 12 M⊙, the mass loss rates are smaller and the internal coupling plays the main role in the evolution of the rotational velocities. This provides an interesting possibility of tests on the internal coupling by studying the differences in rotational velocities for stars at different distances of the ZAMS. In particular, such a study could allow us to test the role of magnetic coupling in radiative envelopes, which is now a major open question in stellar rotation studies (Spruit spruit02 (2002)).
Figs. 1 and 2 show the evolution of the rotational velocities and of the fraction of the angular velocity to the critical angular velocity at the surface of star models of different initial masses between 9 and 120 M⊙ with account taken of anisotropic mass loss during the MS phase. Globally these figures are rather similar to those of previous models (Meynet & Maeder MMV (2000)), except for the fact that the mass loss rates by Vink et al. (Vink00 (2000), Vink01 (2001)) are used here. These rates meet a bi–stability limit at . Below this value there is a sudden increase of the mass loss rates, which makes the rotation velocities rapidly decrease, as for the most massive stars. This is clearly visible for the models below 40 M⊙ in Figs. 1 and 2. Thus, for these models with a rapidly decreasing velocity of rotation, we again stress that any comparison between observed and predicted rotation for these domains of mass is really much more a test of the mass loss rates than a test on the internal coupling and evolution of rotation. We may mention that for an initial velocity km s-1, the account taken of the anisotropic wind does not play a major role (see Sect. 4).
Thus, the uncertainties on the mass loss rates and bi–stability limits prevent us from making significant tests on the internal physics and coupling in the massive stars for models with initial masses above about 12 M⊙. Mass loss uncertainties dominate the problem. From the rather large differences between the values of the mass loss rates published over recent years, we know that these uncertainties are still great. Fortunately, below 12 M⊙ the comparisons may be meaningful and may reveal whether our models have the right kind of internal coupling.
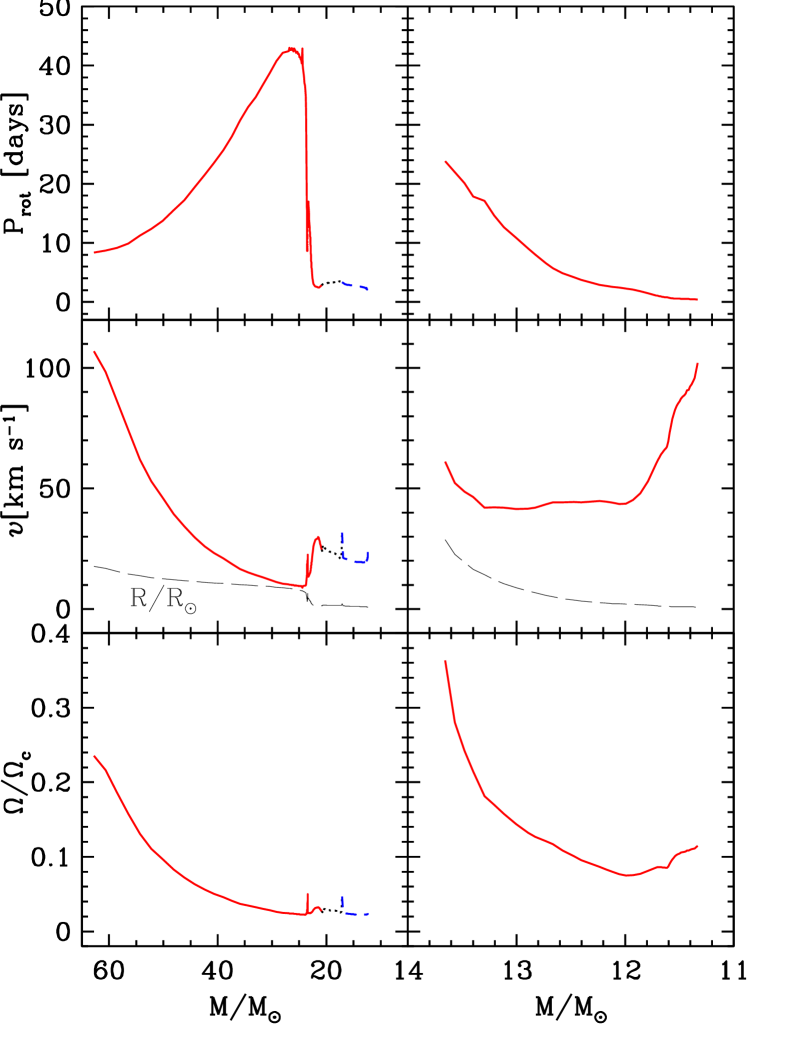
3.2 Evolution of the rotational velocities during the WR stages
Fig. 3 (left) shows the evolution of the rotation period , of the rotation velocities and of the fraction of the angular velocity to the critical angular velocity at the surface during the WR stages of a star model with an initial mass of 85 M⊙ with km s-1 typical of a star which has both a WN and WC phase. During the WN stage of the 85 M⊙ model, until the actual mass of the star reaches a value near 23 M⊙, the angular velocity decreases by a factor of , correspondingly the period grows by the same factor and the rotation velocity decreases much more since the equatorial radius also decreases during this phase (by a factor of ). The fraction also decreases very much, because the sensitivity to the decrease of the radius is larger than that to the mass (which decreases by a factor of ).
We adopt here the definition of the WN phases given by Foellmi et al. (Fo03 (2003)), putting a prefix “e” when the class is assigned by composition properties of the evolutionary models. Thus, eWNE means WN stars without hydrogen, while eWNL means WN stars with hydrogen, (see also Sect 5 below). When the H–content goes to zero (i.e. just before the star enters the eWNE stage), we see a dramatic increase of (or decrease of ), due to the strong contraction of the surface layer because the opacity of the surface layers becomes much smaller. This transition is fast, thus the transfer of angular momentum by meridional circulation is limited and the evolution of the rotation at the surface is dominated by the local conservation of angular momentum, which explains the rapid and large increase of . However, we see that despite the strong decrease of , the velocity and the ratio do not change very much, since the radius is much smaller in the eWNE stage. When the star becomes a WC star with an actual mass of 17.3 M⊙, there is very little change in the velocity, since rotation is already very low and the radius no longer decreases significantly.
Fig. 3 (right) shows the same for a star of 25 M⊙ with km s-1, which does not enter the eWNE and WC stages. We see that decreases (or increases) during the WN stage. This is because the star model moves from 4.29 to 4.70. The decrease of the radius makes the star rotate faster, slightly overwhelming the mass loss effects from 13.65 to 11.33 M⊙. The increase of and the decrease of nearly compensate for each other so that does not vary much during most of the WN phase, except at the very end. There the increase of is more rapid than the decrease of the radius and an increase in the velocity is obtained. The reason for this behaviour is that in this model the stellar winds uncovers the layers, where the –gradient is steep, and we start seeing layers which were deep inside and rotating rapidly.
Globally, we note that the rotational velocities of WR stars are modest in the 2 cases examined above, despite the very different masses and evolution stages. This is firstly the result of the strong mass loss necessary to produce the WR stars and also of the mass loss during the WR stages. We note however that, for a given initial velocity, the velocities obtained at the end of the He–burning phase for the WR stars decrease when the initial mass increases (see Table 1). This results from the simple fact that the higher the initial mass, the larger the quantity of mass (and thus of angular momentum) removed by the stellar winds.
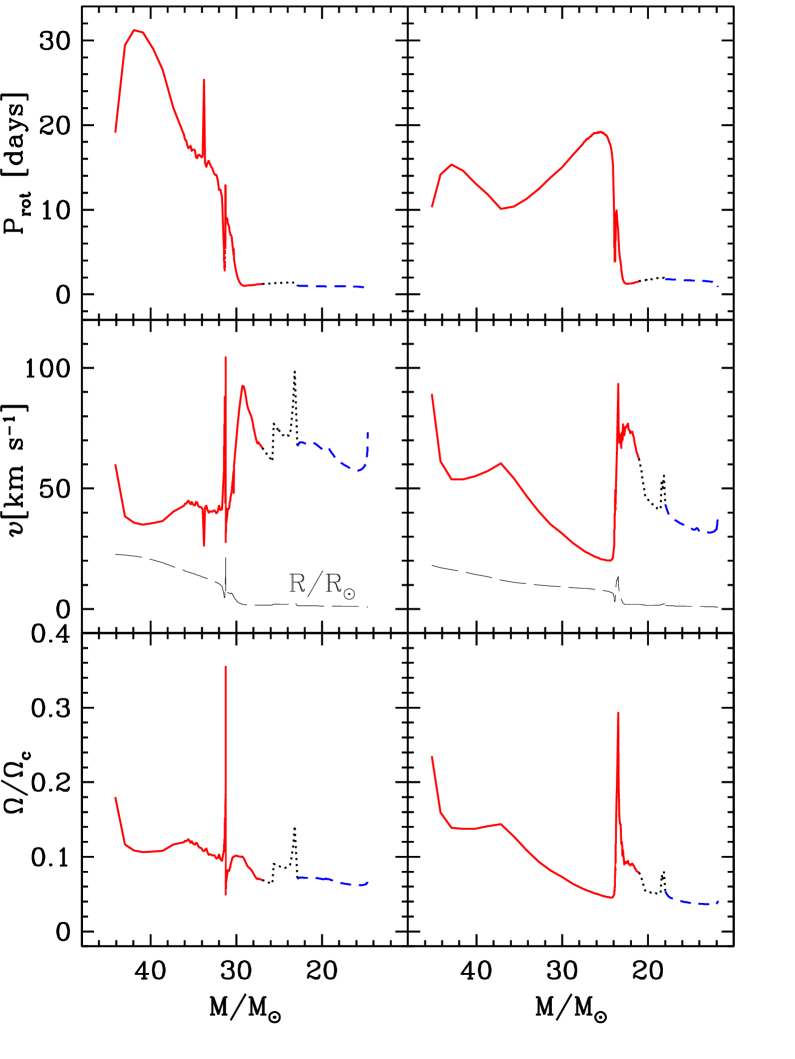
Figs. 4 shows the evolution of rotation properties for a 60 M⊙ model with km s-1 (left) and with km s-1 (right). On the whole, these two cases are not very different from the case of the 85 M⊙ model shown above. In Fig. 4 (left), we firstly see an increase of and a corresponding decrease of and of ; this decrease of the rotation is due, as before, to the high mass loss rates. Then, when the actual mass is about 38 M⊙, increases again due a decrease of the stellar radius as the star is moving to the left in the HR diagram (Fig. 7). The velocity does not change very much since the stellar radius is decreasing. When the actual mass of the star approaches 30 M⊙, at an age of yr, and the outer stellar layers become more transparent, so that the star brightens rapidly above for a short time until an age of yr. The corresponding variations in radius produce a sharp oscillation in and velocity. Then at an age of yr. until yr., the star becomes an He–star (eWNE stage). The angular velocity remains nearly constant (cf. the evolution of the period) while the velocity and present some more variations linked to changes in the radius. Then, the star enters the WC stage, the mass loss rates are so large that despite the decrease of the radius, the rotation remains small. As was the case before, the presence of steep gradients of at the surface, may result in some cases in an increase of when the star is peeled off by the stellar winds.
The case of 60 M⊙ with km s-1 (right) contains features similar to the previous cases. The beginning of the curve, with the first bump of , behaves like the case of km s-1 of 60 M⊙. After the dip of at an age of yr (actual mass of 37 M⊙), the further evolution of is like the case of an 85 M⊙ star, marked by a large decrease of the angular velocity . Later, when the star becomes an He–star at an age yr (actual mass 24 M⊙), we see a sharp increase in , in the velocity and in the ratio . During the WC phase, the velocity remains between 30 and 40 km s-1, surprisingly, this is a factor 2 below the velocity reached during this phase by the 300 km s-1 stellar model. The lower value obtained for the initially faster rotating star results from the greater quantity of mass and thus of angular momentum lost during the previous evolutionary stages.

The main conclusion of this Section is that the predicted surface rotation velocities of WR stars are relatively low, of the order of 50 km s-1. Also, in the stellar interiors, rotation is modest with ratios of the angular velocity at the center to that at the surface which are only of the order of a few unities. This is the result of the very strong mass loss peeled off the star to make it a WR star. It is to be examined whether the further evolution and strong central contraction to the pre–supernova stage is able to accelerate enough to account for the observed rotation periods of pulsars and maybe also, for rotations fast enough, for enabling the collapsar model to work (Woosley Woo03 (2003)). A word of caution is necessary, since there are many paths leading to WR stars and we cannot exclude that some, possibly rare paths, may lead to WR stars with very high rotation.
4 Evolutionary tracks, masses and lifetimes
Fig. 5 presents the tracks for non–rotating and rotating evolutionary models for the whole mass range considered. As a result of the change of the opacities (slightly enhanced) and of the initial abundances ( = 0.275, instead of 0.30), the non–rotating tracks are shifted to lower effective temperatures with respect to paper V. The tracks also extend towards lower effective temperatures during the MS phase. This is a well known consequence of overshooting. Overshooting and core extension by rotation are also generally responsible for shorter extensions of the blue loops in the He–burning phase. This is what we observe in Fig. 5: the extension of the blue loops is further reduced by rotation in the case of the 9 M⊙ model, and the blue loops are even suppressed in the rotating model of 12 M⊙.
| M | End of H–burning | End of He–burning | |||||||||||||
| M | Ys | N/C | N/O | M | Ys | N/C | N/O | ||||||||
| 120 | 0 | 0 | 2.738 | 1.970 | 42.662 | 0 | 0.96 | 46.0 | 47.0 | 0.356 | 16.293 | 0 | 0.27 | 0 | 0 |
| 300 | 200 | 3.138 | 2.153 | 26.235 | 9.5 | 0.93 | 50.8 | 43.6 | 0.407 | 11.297 | 13.9 | 0.30 | 0 | 0 | |
| 85 | 0 | 0 | 3.089 | 2.329 | 45.380 | 0 | 0.70 | 60.0 | 33.5 | 0.368 | 17.265 | 0 | 0.26 | 0 | 0 |
| 300 | 206 | 3.678 | 2.681 | 23.578 | 13.2 | 0.93 | 52.0 | 41.1 | 0.402 | 12.362 | 23.6 | 0.30 | 0 | 0 | |
| 60 | 0 | 0 | 3.622 | 2.930 | 33.510 | 0 | 0.57 | 71.0 | 19.9 | 0.385 | 14.617 | 0 | 0.29 | 0 | 0 |
| 300 | 189 | 4.304 | 3.928 | 31.452 | 55.3 | 0.88 | 47.4 | 26.8 | 0.371 | 14.669 | 73.3 | 0.29 | 0 | 0 | |
| 300I | 182 | 4.297 | 3.901 | 31.283 | 52.5 | 0.88 | 47.0 | 26.7 | 0.373 | 14.526 | 59.3 | 0.29 | 0 | 0 | |
| 500 | 323 | 4.447 | 3.787 | 23.944 | 27.0 | 0.93 | 51.1 | 37.1 | 0.407 | 11.879 | 40.0 | 0.32 | 0 | 0 | |
| 500I | 308 | 4.440 | 3.785 | 24.139 | 28.2 | 0.94 | 50.8 | 37.8 | 0.405 | 11.933 | 38.3 | 0.32 | 0 | 0 | |
| 40 | 0 | 0 | 4.560 | 3.848 | 35.398 | 0 | 0.27 | 0.31 | 0.11 | 0.483 | 14.090 | 0 | 0.98 | 44.2 | 43.9 |
| 300 | 214 | 5.535 | 4.723 | 32.852 | 70.0 | 0.45 | 5.30 | 1.56 | 0.424 | 12.737 | 96.5 | 0.28 | 0 | 0 | |
| 500 | break–up limit reached | ||||||||||||||
| 500I | 327 | 5.700 | 4.449 | 32.085 | 165.5 | 0.49 | 5.97 | 1.76 | |||||||
| 25 | 0 | 0 | 6.594 | 5.132 | 24.209 | 0 | 0.27 | 0.31 | 0.11 | 0.688 | 16.611 | 0 | 0.46 | 10.8 | 1.73 |
| 300 | 239 | 8.073 | 5.566 | 21.547 | 47.0 | 0.34 | 1.75 | 0.51 | 0.633 | 11.333 | 102 | 0.98 | 25.1 | 26.4 | |
| 20 | 0 | 0 | 8.286 | 5.168 | 19.682 | 0 | 0.27 | 0.31 | 0.11 | 0.871 | 15.745 | 0 | 0.39 | 3.61 | 0.85 |
| 300 | 243 | 10.179 | 5.059 | 18.074 | 82.7 | 0.31 | 1.24 | 0.35 | 0.816 | 11.787 | 0.7 | 0.41 | 3.33 | 0.85 | |
| 300I | 240 | 10.1782 | 5.082 | 18.149 | 75.0 | 0.31 | 1.24 | 0.35 | |||||||
| 15 | 0 | 0 | 11.778 | 0.0003 | 14.818 | 0 | 0.27 | 0.31 | 0.11 | 1.351 | 13.274 | 0 | 0.32 | 1.72 | 0.44 |
| 300 | 241 | 14.527 | 0.000 | 14.140 | 145 | 0.29 | 0.90 | 0.25 | 1.107 | 10.203 | 0.2 | 0.36 | 2.40 | 0.58 | |
| 12 | 0 | 0 | 16.345 | 0.000 | 11.872 | 0 | 0.27 | 0.31 | 0.11 | 2.025 | 11.599 | 0 | 0.32 | 1.80 | 0.45 |
| 300 | 235 | 20.377 | 0.000 | 11.500 | 183 | 0.28 | 0.77 | 0.22 | 1.503 | 10.535 | 0.8 | 0.37 | 2.71 | 0.62 | |
| 9 | 0 | 0 | 26.964 | 0.000 | 8.919 | 0 | 0.27 | 0.31 | 0.11 | 3.491 | 8.664 | 0 | 0.30 | 1.55 | 0.38 |
| 300 | 234 | 33.739 | 0.000 | 8.790 | 222 | 0.28 | 0.73 | 0.21 | 3.367 | 8.397 | 1.5 | 0.35 | 2.63 | 0.58 | |
| 300I | 234 | 30.962 | 0.000 | 8.840 | 197 | 0.28 | 0.69 | 0.20 | |||||||
| 1 The symbol I after the velocity indicates that the model was computed assuming isotropic stellar winds. | |||||||||||||||
| 2 This model was computed until the mass fraction of hydrogen at the center is 0.000348. | |||||||||||||||
| 3 The minimum initial mass star of O–type star is 15.9 M⊙ for non–rotating models and 17 M⊙ for the rotating stellar models. | |||||||||||||||
The present non–rotating 12 M⊙, with overshooting, presents a blue loop, while the non–rotating model of paper V, without overshooting, shows no blue loop. This is at first sight surprising because, as said above, more massive He–cores tend to reduce the extension of the blue loops, if not suppressing them (Lauterborn et al. la71 (1971); see also the discussion in Maeder & Meynet ma89 (1989)). As explained in paper V, this particular situation, at the limit where the loops generally disappear, results from the higher luminosity of the model having the more massive He–cores (either as a result of overshooting or as a result of rotation). The higher luminosity implies that the outer envelope is more extended, and is thus characterized by lower temperatures and higher opacities at a given mass coordinate. As a consequence, in the model with higher luminosity, during the first dredge–up, the outer convective zone proceeds much more deeply in mass, preventing the He–core to grow too much during the further evolutionary phases and enabling the apparition of a blue loop.
The effects of rotation on the tracks have already been discussed in previous works (Heger he98 (1998); Meynet & Maeder MMV (2000)), thus we shall be very brief here. Let us just list the main effects:
-
•
On and near the ZAMS, the atmospheric effects of rotation produce a small shift of the tracks towards lower . The effective temperature considered here is an appropriate averaged over the stellar surface (see Meynet & Maeder MMI (1997)).
-
•
Tracks with rotation become more luminous than for no rotation.
-
•
For stars with initial masses inferior to 30 M⊙, the MS bandwidth is enlarged by rotation. This is a consequence of the larger He–core produced during the H–burning phase in rotating models. As a numerical example, in the 20 M⊙ model with = 300 km s-1, the He–core at the end of the MS is about 38% more massive than in its non–rotating counterpart. In the models of paper V the enhancement due to rotation was only 20%. Likely most of the difference results from the inclusion here of a small overshooting. In the present models, the core enhancement due to rotation adds its effects to an already more extended core, having a higher central temperature, and thus this larger core reacts more strongly to further supplies of fuel by rotational diffusion.
-
•
For initial masses superior to about 50 M⊙, the rotating tracks show drastically reduced MS bandwidths. This was already the case in Meynet & Maeder (MMV (2000)). For instance, the reddest point reached at the end of the MS phase by the 60 M⊙ non–rotating stellar model is log 4.15 , while for the = 300 km s-1 model, it is 4.6 , due to the fact that the surface He–enhancement leads to a bluer track, as a consequence of the reduced opacity. In this mass range, the rotating stellar models enter into the WR phase during the H–burning phase (see Sect. 5). The MS phase, identified here with the OV–type star phase, is thus considerably reduced. Since the stars, here as in any mass range, have different initial rotational velocities, one expects to find in the HR diagram stars corresponding to a variety of tracks with various initial velocities. Particularly, in the upper hot part of the HR diagram, for log superior to about 5.8–5.9 and log between 4.7 and 4.2, one may find in the same area of the HR diagram stars in very different evolutionary stages, which may also correspond to different types of massive stars: MS O–type stars, Of stars, transition stars, blue supergiants and WR stars.
For higher rotation velocities, the actual masses at the end of both the H– and He–burning phases become smaller (cf. Tables 1). For an initial velocity of 300 km s-1 and for stars with masses below 60 M⊙, the actual masses at the end of the core H–burning phase are decreased by less than 11% with respect to the non–rotating models. For higher initial mass models, the decreases are much more important, because these stars enter the WR phase already at an early stage during the H–burning phase (see Sect. 5).
The evolutionary masses of a star can be determined by searching the mass of the evolutionary track passing through its observed position in the HR diagram. As can be seen from Fig. 5, the mass determined from the non–rotating evolutionary track is always greater than the one deduced from rotating models. Thus the use of non rotating tracks tends to overestimate the mass, and this might be a cause of a large part of the long–standing mass discrepancy problem (see e.g. Herrero et al. He20 (2000)).

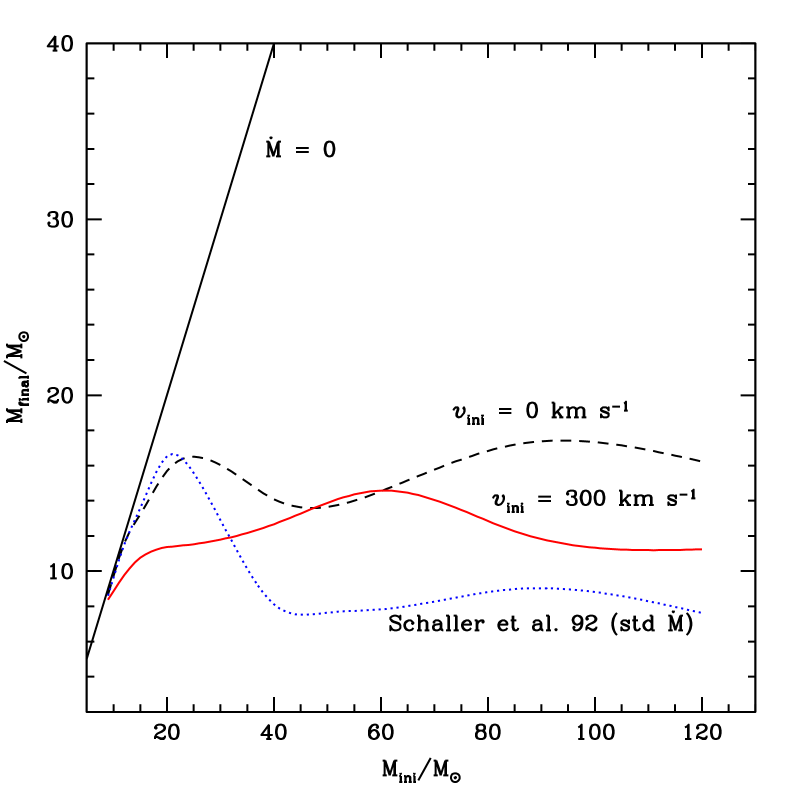
Fig. 6 shows the final masses obtained for different initial masses and velocities. One notes that the new mass loss rates used in the present computations are smaller than those used in the stellar grids of Schaller et al. (Sch92 (1992)). For stars with initial masses above 40 M⊙, rotating models produce final masses between 11.3 and 14.7. For comparison, non–rotating models end with final masses between 14.1–17.3 M⊙. Interestingly, the average mass of WC stars, estimated on the basis of the 6 WC stars belonging to double–line spectroscopic binaries, is 12 3 M⊙ (van der Hucht Hu01 (2001)), nearer to the rotating model results than the non–rotating ones. However we cannot discard the possibility that for these stars mass transfer in a Roche lobe overflow may have occurred, in which case this observation cannot be used to constrain single star models. The fact that the models with and without rotation near 50 M⊙ lead to about the same final masses, despite the increased mass loss rates for rotating models, is due to the differences in the evolutionary stages followed by each model (see Sect. 5).

Table 1 presents some properties of the models. Columns 1 and 2 give the initial mass and the initial velocity respectively. The mean equatorial velocity during the MS phase is indicated in column 3. This quantity is defined as in paper V. The H–burning lifetimes , the lifetimes as an O–type star on the MS (we assumed that O–type stars have an effective temperature superior to about 31 500 K as suggested by the new effective temperature scale given by Martins et al. Mart02 (2002)), the masses M, the equatorial velocities , the helium surface abundance and the surface ratios (in mass) N/C and N/O at the end of the H–burning phase are given in columns 4 to 10. The columns 11 to 16 present some characteristics of the stellar models at the end of the He–burning phase, is the He–burning lifetime. The letter I attached to the value of the initial velocity (column 2) indicates that the model was calculated assuming isotropic stellar winds. These models were calculated until the end of the MS phase, except in the case of the 60 M⊙ model for which the evolution was pursued until the end of the core He–burning phase.
From Table 1 one sees that for the lifetimes are increased by about 15–25% when the initial rotational velocity on the MS increases from 0 to 300 km s-1. Similar increases were found in paper V. The lifetimes of O–type stars are increased by similar amounts. As we shall see below, the increase due to rotation of the WR lifetimes is much greater and thus rotation predicts larger number ratios of WR to O–type stars than non–rotating stellar models.
Except for the models with initial masses superior to 85 M⊙, the He–burning lifetimes are decreased by rotation. Thus the ratio of the He–burning lifetimes to the H–burning lifetimes are in general decreased by rotation. Typically for the 20 M⊙ model, this ratio passes from 0.11 to 0.08 when the initial velocity considered increases from 0 to 300 km s-1. The particular behaviour of the extremely massive stars results from the lower luminosities in the WC stage, which favour longer He–lifetimes.
The anisotropy of the wind induced by rotation has little impact when the initial velocity is equal or inferior to 300 km s-1. This can be seen by comparing the data presented in Table 1 for the two 60 M⊙ models with = 300 km s-1 computed with and without the account of the anisotropy. They are indeed very similar. On the other hand, as has been shown by Maeder (Ma02 (2002)), for higher initial velocities, in the mass range between 20 and 60 M⊙, the anisotropies of the mass loss may significantly influence the evolution of the stellar velocities and may lead many stars to break–up.
5 Rotation and the properties of Wolf–Rayet stars
Here we consider the following question: what are the effects of rotation on the evolution of massive single stars into the Wolf–Rayet phase ? This subject has been discussed by Maeder (Maeder87 (1987)), Fliegner and Langer (Fl95 (1995)), Maeder & Meynet (2000b ) and Meynet (Me00 (2000)). We present here for the first time an extensive grid of models, accounting for the effects of the wind anisotropy, going through the WR phase. It is important to cover the whole mass range of star progenitors of WR stars in order to quantitatively assess the importance of rotation in the interpretation of the WR number statistics (see Sect. 6 below).
Let us reconsider the criteria which have been chosen to decide when a stellar model enters into the WR phase. Ideally, of course, the physics of the models should decide when the star is a WR star. However our poor knowledge of the atmospheric physics involved, as well as the complexity of models coupling stellar interiors to the winds, are such that this approach is not yet possible. Instead, it is necessary to adopt some empirical criteria for deciding when a star enters the WR phase. In this work the criteria are the following: the star is considered to be a WR star when and the mass fraction of hydrogen at the surface is . Reasonable changes to these values (for instance adopting instead of 0.4) do not affect the results significantly.
The correspondence between the WR–subclasses and the surface abundances is established as follows: the stars enter the WR phase as WN stars i.e. as stars presenting strong He and N enrichments at their surface and strong depletion in carbon and oxygen as expected from CNO processed material. We call eWNL stars all the WN stars showing hydrogen at their surface (“e” stands for evolutionary, as recommended by Foellmi et al. Fo03 (2003)). The eWNE stars, on the other hand, are WN stars showing no hydrogen at their surface. The transitional WN/WC phase is characterized by the simultaneous presence at the surface of both H– and He–burning products (typically N and C or Ne). Here we suppose that this transition phase begins when the mass fraction of carbon at the surface becomes superior to 10% of the mass fraction of nitrogen. The phase is supposed to end when the mass fraction of nitrogen at the surface becomes inferior to 10% of the mass fraction of carbon. The WC phase corresponds to the stage where He–burning products appear at the surface. This phase begins when the transition WN/WC phase ends.
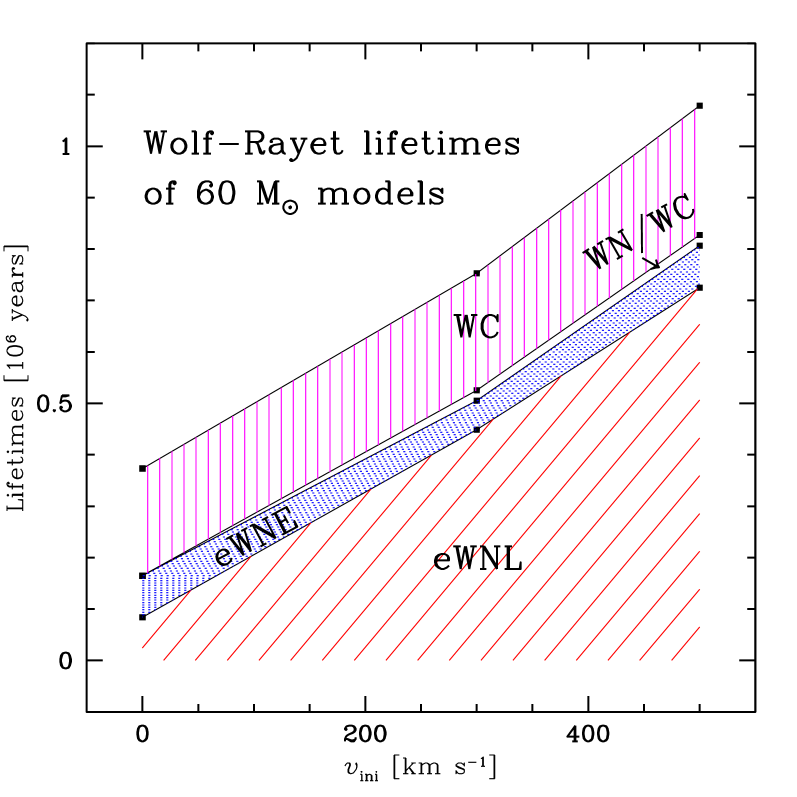
Figure 7 shows the evolutionary tracks and the evolution of the structure in a non–rotating and a rotating 60 M⊙ model. The rotating model has a time–averaged equatorial velocity on the Main Sequence (MS) of about 190 km s-1, not far from the mean equatorial velocity observed for O–type stars. Inspection of Fig. 7 shows the following features:
-
•
The non–rotating 60 M⊙ star goes through an intermediate Luminous Blue Variable (LBV) phase before becoming a WR star, while the rotating model skips the LBV phase and goes directly from the O–type star phase into the WR phase. One also notes that during the O–type star phase, the rotating track is bluer than its non–rotating counterpart. This is due to the diffusion of helium into the outer radiative zone (see Heger & Langer He00 (2000); Meynet & Maeder MMV (2000)). This fact may slightly change the number of O–type stars deduced from the number of ionizing photons, a technique used to estimate the number of O–type stars from the spectral analysis of the integrated light of distant starburst regions (e.g. Schaerer Sc96 (1996)).
-
•
There is no luminosity difference during the WC phase between the rotating and the non–rotating models. Since these stars follow a mass–luminosity relation (Maeder Maeder87 (1987); Schaerer & Maeder Sc92 (1992)), this implies that the masses of these two stars at this stage are about equal (see Fig. 6). At first sight this may be surprising. One would expect the rotating star to lose more mass than its non–rotating counterpart. However, in this particular case there are some compensating effects. Indeed, the non–rotating model enters into the WR phase later, but becomes redder during the MS phase and then becomes a LBV star. During these two last phases, the star undergoes strong mass loss (see the left panels of Fig. 7). The rotating model, on the other hand, enters the WR phase at an earlier stage, reaching at the end an identical mass to the non–rotating model. In general, however, the final masses obtained from the rotating models are smaller than those obtained from the non–rotating ones (see Fig. 6), leading to lower luminosities during the WC phase (see Fig. 8).
-
•
From the lower panels of Fig. 7, we see that the non–rotating star enters the WR phase at the beginning of the core He–burning phase with a mass of about 27 M⊙. Nearly the whole H–rich envelope has been removed by stellar winds during the previous phases (more precisely at the end of the MS phase and during the LBV phase). In this case, the main mechanism for making a WR star is mass loss by stellar winds. For the rotating model, on the other hand, the entry into the WR phase occurs at an earlier stage (although not at a younger age!), while the star is still burning hydrogen in its core. The mass of the star at this stage is about 45 M⊙ and a large H–rich envelope is still surrounding the convective core. The main effect making a WR star in this second case is rotationally induced mixing (Maeder Maeder87 (1987); Fliegner & Langer Fl95 (1995); Meynet Me00 (2000)).
In Fig. 8, the evolutionary tracks for a non–rotating and a rotating 120 M⊙ stellar model are shown. The beginning and the end of the various WR subphases are indicated along the tracks. The range of luminosities spanned by the rotating eWNL stars is considerably increased. This directly results from the point underlined just above, i.e. a rotating star enters the WR phase still with a large H–rich envelope. This considerably increases the duration of the eWNL phase and the star will cover during this stage a greater range of masses and luminosities. The rotating models also enter the further WR subclasses with smaller actual masses and lower luminosities. From Fig. 8, one sees that the rotating eWNE, WN/WC and WC stars have luminosities decreased by about a factor of two.
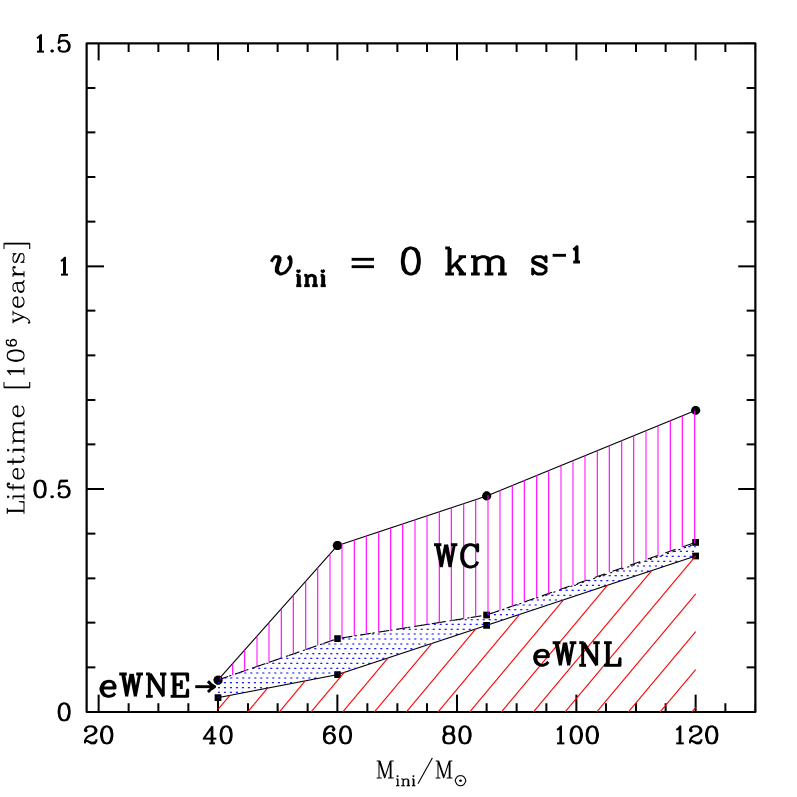
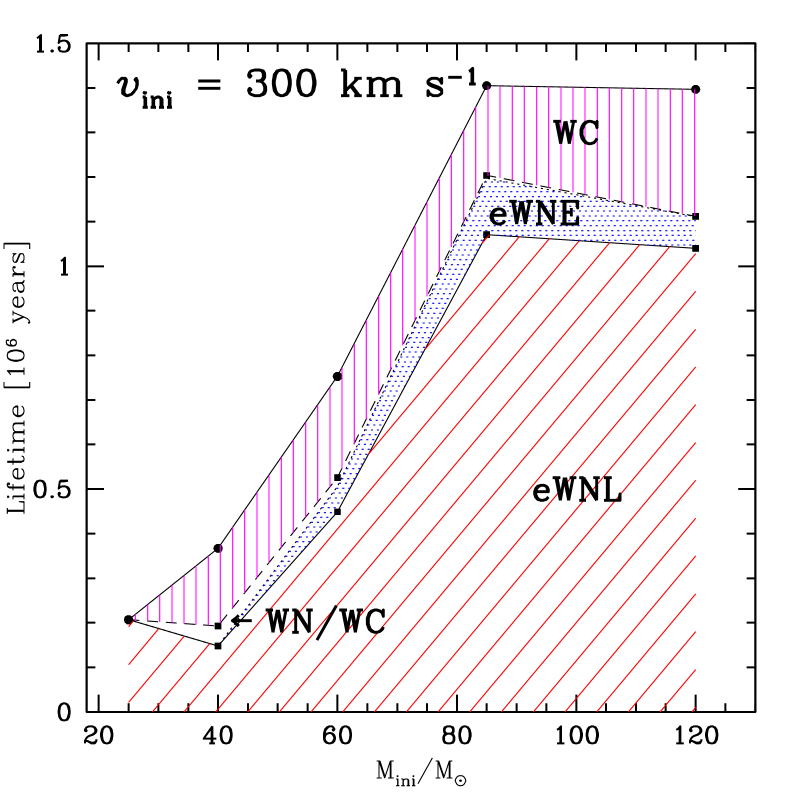
The differences between the behaviours of the rotating and non–rotating models have important consequences for the duration of the WR phase as a whole and for the lifetimes spent in the different WR subtypes, as can be appreciated from Figs. 9 and 10.
-
•
Firstly, one notes that the WR lifetimes are enhanced. Typically for the 60 M⊙ model, the enhancement by rotation amounts to nearly a factor of 2.
-
•
Second, the eWNL phase is considerably lengthened as explained just above. The duration of this phase increases with the initial velocity as can be seen from Fig. 11. When the initial velocity passes from 300 to 500 km s-1 (or when the time–averaged equatorial velocity during the O–type phase goes from 190 to 330 km s-1), the eWNL phase duration is increased by a factor of about 1.7. The durations of the eWNE and WC phases are, on the other hand, much less affected.
-
•
Thirdly, in the rotating stellar model a new phase of modest, but of non–negligible duration, appears: the so–called transitional WN/WC phase. This phase is characterized by the simultaneous presence at the surface of both H– and He–burning products. The reason for this is the shallower chemical gradients that build up inside the rotating models. These shallower gradients inside the stars also produce a smoother evolution of the surface abundances as a function of time (or as a function of the remaining mass, see Figs. 16 and 18). For a transitional WN/WC phase to occur, it is necessary to have—for a sufficiently long period—both a He–burning core and a CNO–enriched envelope. In the highest mass stars, mass loss removes too rapidly the CNO–enriched envelope to allow a transitional WN/WC phase to appear. In the low mass range, the time spent in the WR phase is too short and the H–rich envelope too extended to allow He–burning products to diffuse up to the surface. Consequently, the transitional WN/WC phase only appears in the mass range between 30 and 60 M⊙ for km s-1.
-
•
Finally, the minimum mass for a star to become a WR star (through the single star channel) is lowered by rotation. In the present case, the minimum mass is reduced from about 37 M⊙ for km s-1 to about 22 M⊙ for km s-1.
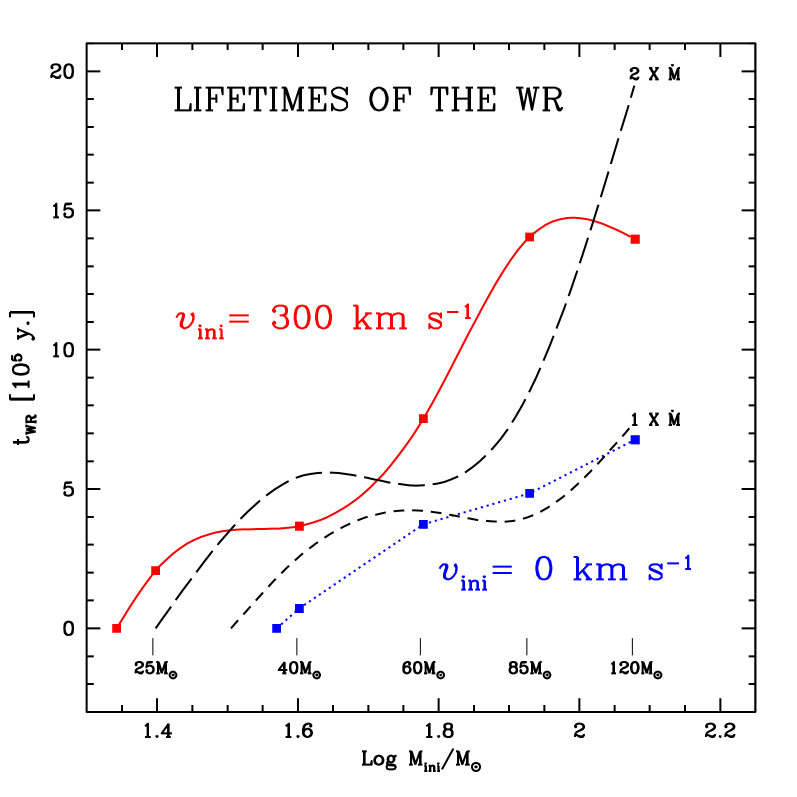
Of course, this applies to solar metallicity. At very different , the effects of rotation on the various subphases may be different. It is interesting to compare the present WR–lifetimes with those we obtained with our previous non–rotating stellar models (Meynet et al. Mey94 (1994); Maeder and Meynet MaeMey94 (1994)). This is done in Fig. 12. We see that the present non–rotating models follow more or less the behaviour we obtained with our normal mass loss rate models of 1994, although, due to smaller mass loss rates in the present grid, the WR lifetimes are in general reduced and the minimum mass for WR star formation from single stars is enhanced. Our rotating models, on the other hand, reproduce qualitatively the changes brought by an enhancement of the mass loss rates: an increase of the WR lifetimes and a decrease of the minimum mass for a single star to go through a WR phase.
From the above considerations, one can conclude that, compared to non–rotating models, stellar models including rotation will predict higher values of: (a) the numbers of WR stars relative to O–type stars, (b) the relative number of WN to WC stars, and (c) the relative number of transition WN/WC stars to WR stars. As shown in the next Section, the predictions of the rotating models are in better agreement with the observed number ratios at solar metallicity.
6 Comparison with the observed properties of Wolf–Rayet star populations
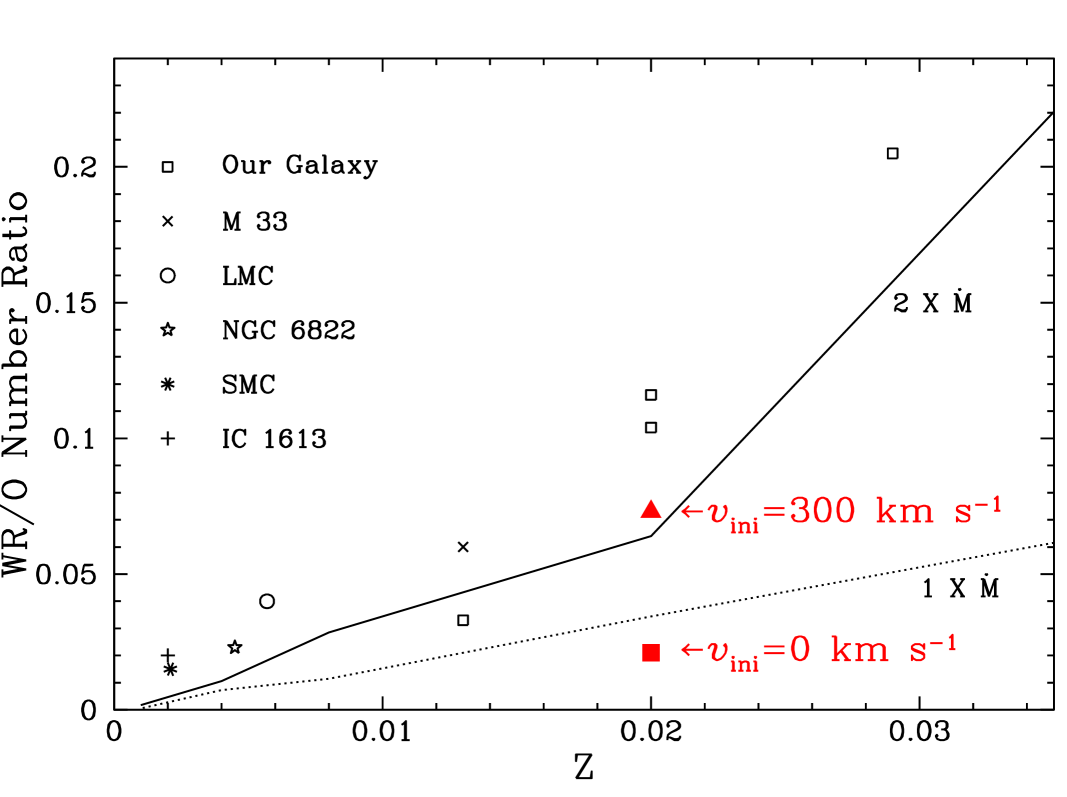
Following Maeder (Maeder91 (1991)) and Maeder & Meynet (MaeMey94 (1994)), one can easily estimate the theoretical number ratio of WR to O–type stars in a region of constant star formation. This ratio is simply given by the ratios of the mean lifetime of a WR star to that of an OV–type star. The averages are computed using an initial mass function as the weighting factor over the respective mass intervals considered. Assuming a Salpeter Initial Mass Function slope of 1.35, considering the O–type and WR star lifetimes given in tables 1 and 2, we obtain the predicted ratios given at the bottom of this last table.
| M | ||||||
|---|---|---|---|---|---|---|
| 120 | 0 | 0.6767 | 0.3499 | 0.0265 | 0.0038 | 0.2965 |
| 300 | 1.3969 | 1.0402 | 0.0706 | 0.0010 | 0.2851 | |
| 85 | 0 | 0.4846 | 0.1941 | 0.0231 | 0.0000 | 0.2674 |
| 300 | 1.4050 | 1.0707 | 0.1263 | 0.0065 | 0.2015 | |
| 60 | 0 | 0.3732 | 0.0838 | 0.0808 | 0.0000 | 0.2086 |
| 300 | 0.7527 | 0.4489 | 0.0562 | 0.0202 | 0.2274 | |
| 300I | 0.7779 | 0.4734 | 0.0346 | 0.0343 | 0.2356 | |
| 500 | 1.0787 | 0.7250 | 0.0816 | 0.0206 | 0.2515 | |
| 500I | 1.0703 | 0.7312 | 0.0628 | 0.0211 | 0.2552 | |
| 40 | 0 | 0.0714 | 0.0317 | 0.0397 | 0.0000 | 0.0000 |
| 300 | 0.3670 | 0.1478 | 0.0000 | 0.0447 | 0.1745 | |
| 251 | 0 | 0.0000 | 0.0000 | 0.0000 | 0.0000 | 0.0000 |
| 300 | 0.2068 | 0.2068 | 0.0000 | 0.0000 | 0.0000 | |
| Predicted number ratios | ||||||
| 0 | 0.02 | 0.35 | 0.16 | 0.00 | 0.49 | 0.97 |
| 300 | 0.07 | 0.66 | 0.05 | 0.04 | 0.25 | 0.35 |
| 1 Mmin for WR star formation from a single star is 37 and 22 | ||||||
| for , 300 km s-1 respectively. | ||||||
| 2 WC/WN = WC/(WNL+WNE). | ||||||
Comparisons with observed number ratios are shown in Figs. 13 and 14. Obviously, unless most of the WR stars at solar metallicity are formed through Roche lobe overflow in a close binary system, which seems quite unrealistic (see the discussion in Maeder Maeder96 (1996); see also Foellmi et al. Fo03 (2003)), models with rotation are in much better agreement with observations. Of course a more refined estimate of the effects of rotation will require account of the initial distribution of the rotational velocities. However, since the initial velocity chosen here corresponds to a mean rotational velocity on the Main Sequence almost equal to the observed mean, we can hope that the present result is not too far from what one would obtain with a more complete analysis. The conclusion is that at solar metallicity, rotating models are in much better agreement with the observed statistics of WR stars than the non–rotating models. Interestingly a similar conclusion could be reached based on the results of our paper V, and this shows that the present results depend weakly on overshooting or on the inclusion of the effects of horizontal turbulence in the coefficient of shear diffusion.
In Fig. 14, the predicted values for the WC/WN number ratios are compared with observations. One sees that the WC/WN ratio increases with the metallicity along a relatively well defined relation. The observed point for the solar neighborhood is however well above the general trend. According to Massey (Mas03 (2003)) this may result from an underestimate of the number of WN stars.
Comparing with the theoretical predictions at solar metallicity, one obtains that the non–rotating models predict too few WN stars, while the rotating models give a value in the observed trend. This confirms the conclusion already reached above on the basis of the WR/O number ratio: rotating models much better account for the characteristics of the WR populations than non–rotating models.
There are 10 WN/WC stars listed in the VIIth catalogue of galactic WR stars of van der Hucht (Hu01 (2001)). Compared to the total number of known galactic WR stars (226) this represents a fraction of 4.4%. The present models predict for this fraction a value equal to 4% in good agreement with the observed ratio. We recall that models without mild mixing processes in radiative zones are unable to predict correctly the number of transition WN/WC stars. This was first shown by Langer (La91 (1991)).
In future work, it has to be checked by further computations at different metallicities that the rotating models, with reduced mass loss rates due to clumping, will account for the observed variation of the number ratios WR/O and WC/WN with metallicity.
7 Surface abundances in WR stars
We have already presented and discussed the effects of rotation on the surface abundance of massive stars at solar composition (Meynet & Maeder MMV (2000)). The main point is the enhancement of He and N during the MS phase due to the internal transport by shear mixing. However, we note that the enhancements in He and CNO products found here are in general smaller that those found in Meynet & Maeder (MMV (2000)). The situation is illustrated in Fig. 15 which compares the evolution of the N/C ratios for models with masses between 9 and 40 M⊙ of the above quoted paper and of the present work. We see that a difference in the enhancement of N/C is created during MS evolution and that the present ratios are smaller on average by a factor of about 1.5 for masses below 25 M⊙. This is due to the fact that in the present models we are accounting for the effects of the horizontal turbulence on the shear mixing according to the study by Talon & Zahn (TaZa97 (1997)). The horizontal diffusion substantially reduces the effects of the shear mixing. In the higher mass range, the difference between the two sets of models is smaller, as can be seen by comparing the two 40 M⊙ tracks in Fig. 15. In this domain of masses, the large effects of mass loss by stellar winds are added to those of rotational mixing. Close comparisons with observations will be undertaken on the basis of these two sets of models to see whether the treatment by Talon & Zahn leads to a better agreement or not. However, the problem is intricate both observationally, because the scatter of the observations is large, and also theoretically because other effects may enter into the game, such as magnetic fields (Spruit spruit02 (2002)) or a higher horizontal turbulence. Let us also recall that the enhancements in He and N are much larger at lower metallicities (Maeder & Meynet MMVII (2001)), because stars with lower have in general steeper –gradients, which favour internal mixing.


Fig. 16 shows the evolution of the surface abundances in a rotating and a non–rotating model with initial masses of 60 M⊙. The progressive changes of the abundances of CNO elements between the initial cosmic values and the values of the nuclear equilibrium of the CNO cycle are much smoother for the rotating model than for the case without rotation. This is due to the internal mixing which makes flatter internal chemical gradients for rotating models. The rotational mixing also makes the change of abundances to occur much earlier in the peeling–off process. This is also true for the changes of H and He. Another significant difference for the 60 M⊙ model with rotation is the absence of an LBV phase as shown in Sect. 5. Without rotation, most of the change of CNO abundances occurs in the LBV phase, while in the case with rotation, the transition from cosmic to CNO equilibrium abundances occurs partly during the MS phase and partly during the eWNL phase which immediately follows it. We note that the nuclear equilibrium CNO values are essentially model independent as already stressed a long time ago (Smith & Maeder SmithM91 (1991)). This is true whether H is still present or not.
We see that at the end of the assumed eWNE phase, the transition to the WC abundances is very sharp in the absence of rotational mixing. This is because there is a strong chemical discontinuity in the classical models due to the fact that the convective core is usually growing during some part of the He–burning phase (Maeder Maeder83 (1983)). In the rotating case, the transitions are smoother, so that there are some stars observed with abundances in the transition regime, with simultaneously some 12C and some 14N present. As stated above, these correspond to the so–called WN/WC stars (Conti & Massey Co89 (1989); Crowther et al. Cr95 (1995)). These transition stars are likely to also have some 22Ne excess. Since the attribution of spectral types is a complex matter, it may even be that some of the stars in the transition stage are given a spectral type eWNE or WC, thus we might well have a situation where a WN star would have some 22Ne excess or a WC star would still have some 14N present.
Fig. 17 compares the predicted relation between the C/N and C/He ratios with some recent observations by Crowther et al. (Cr95 (1995)). During the eWNL phase, C/He and C/N decreases, but remain around the CNO equilibrium value equal to 0.015. Then during the transitional WN/WC phase, there is a huge increase of carbon, while nitrogen and helium remain constant. This is the reason why the lower part of the curve shows that when C/N changes by a factor , C/He changes by the same amount. Then, when the star evolves towards the WC stage, C/He changes only slowly, while C/N grows very rapidly, since N quickly disappears. The comparison with the observations by Crowther et al. (Cr95 (1995)) shows a good agreement. However this agreement may be somewhat misleading here, in the sense that a 60 M⊙ non–rotating model would follow a similar track in the C/N versus C/He plane. The good correspondence here is not a real constraint on the models. What is more constraining is the expected number of stars in the transitional WN/WC phase. As seen in Sect. 5, the rotating models in this respect are much better than the non–rotating ones.
In the WC stage, the abundances of chemical elements are very much model dependent as was first shown by Smith & Maeder (SmithM91 (1991)). This is because in the WC stars, we see the products of partial He-burning. At the entry in the WC phase, the 12C and 16O abundances are lower, and that of He is higher in the models with rotation, due to their smooth chemical gradients. Also, the fraction of the WC phase spent with lower C/He and O/He ratios is longer in models with rotation. However, rotation does not affect the high 22Ne abundance during the WC phase. This is a consequence of the fact that most of this 22Ne results from the transformation of the 14N produced by the CNO cycle in the previous H–burning core. The value of the 14N and therefore that of the 22Ne is fixed by the characteristics of the CNO at equilibrium, which in turn depends on the nuclear physics and not on the pecularities of the stellar models. It is interesting to mention here that the high overabundance of 22Ne at the surface of the WC star predicted by the models is confirmed by the observations (Willis Wi99 (1999); Dessart et al. De00 (2000)). In the core, the abundance of 22Ne will stay at this equilibrium value until eventually it is turned into 25,26Mg with production of neutrons (through 22Ne(,n)25Mg) and of s–elements.
Fig. 18 shows the same for models of 40 M⊙ with and without rotation. The enhancements of He and N only appear in the blue and yellow supergiant stage in the case without rotation, while they occur during the MS and blue supergiant phase when rotation is included; also in this case the changes are more progressive. The non–rotating model has almost no WNL phase and does not enter the WC stage. The model with rotation is very different, it has an extended WNL phase and then a remarkably large transition phase, where 14N is present with a significant abundance, while 12C, 16O and 22Ne are also there. Most of this transition phase is likely spent in the transition WN/WC phase, but probably not the whole, so that some peculiar WN stars with products of He–burning are possible. Also some WC stars with an unusual occurrence of 14N are very likely. Globally, we see that the transition phase where both characteristics of H– and He–burning phases are present is longer for stars of lower masses (see Sect. 5).
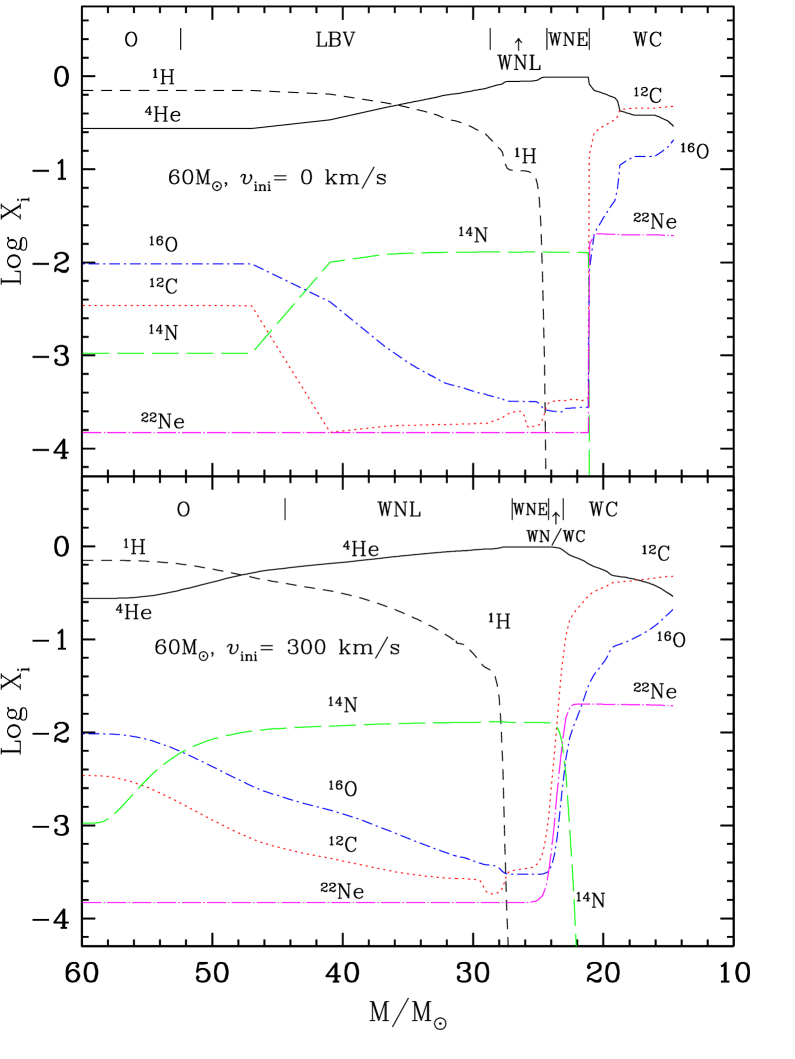
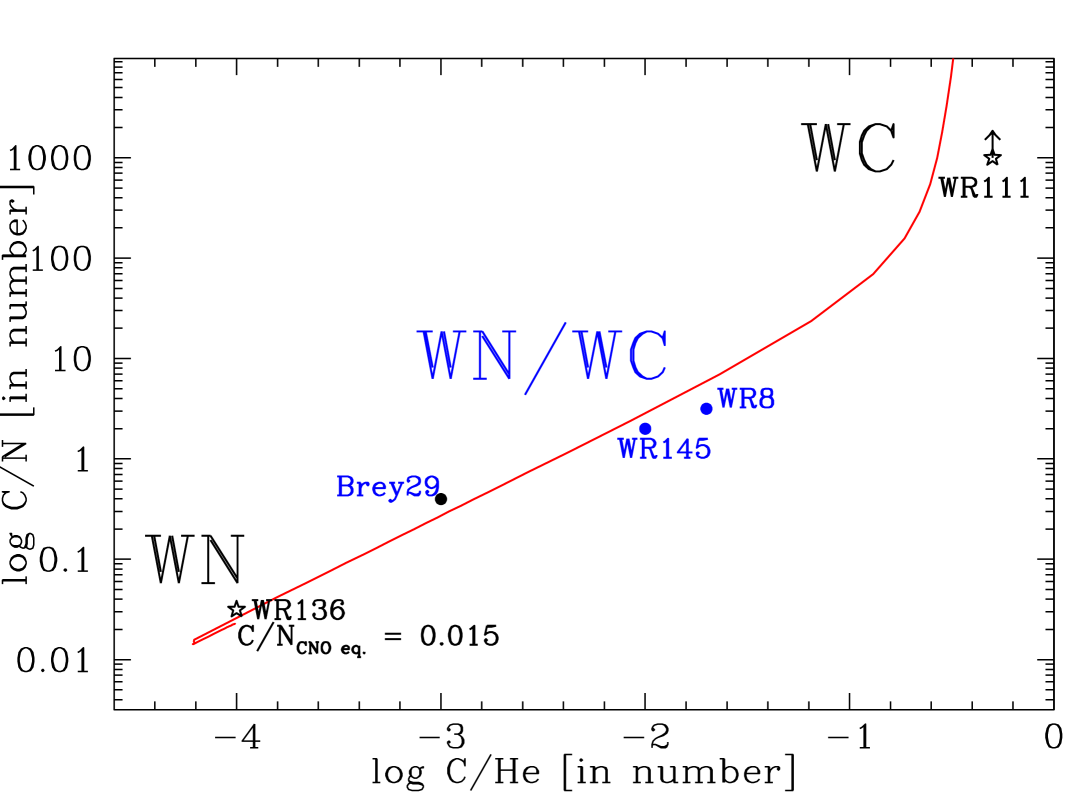
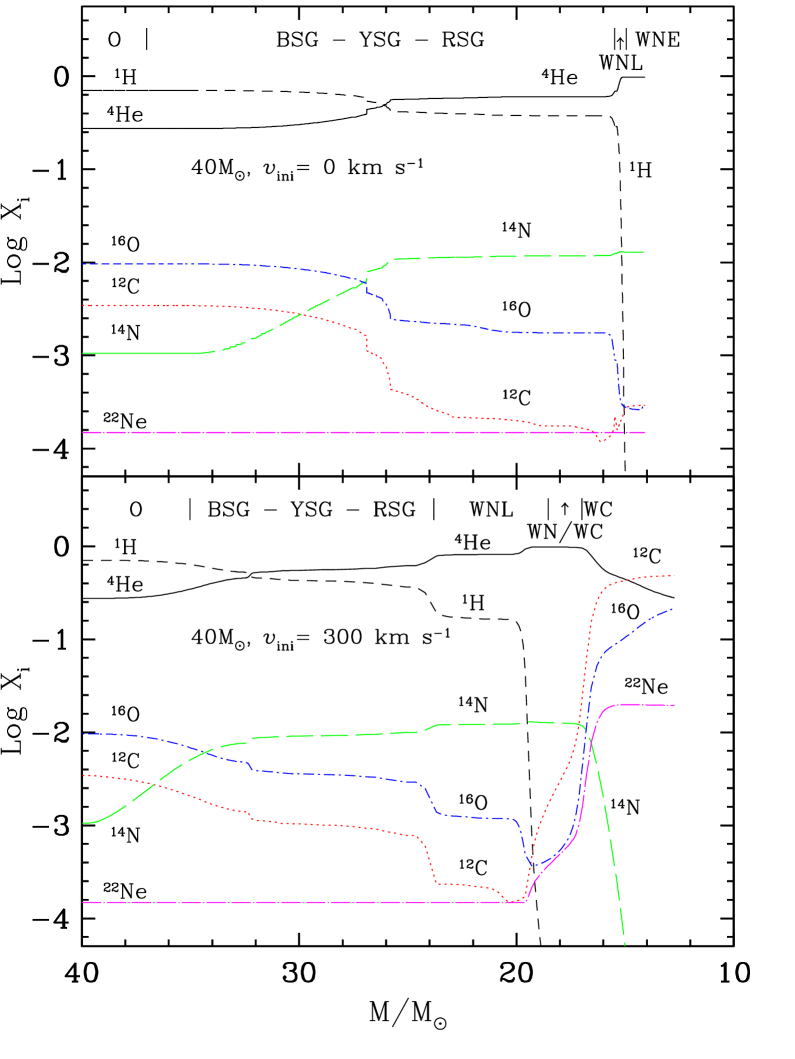
Fig. 19 shows an interesting diagram for the study of so–called “slash stars” of type Ofpe/WN, of the LBV and of the WN stars. It presents the evolution of the surface H–content as a function of the luminosity. The tracks go downwards in this diagram; first there is an initial brightening due to MS evolution, then the luminosity is about constant, except for if the mass loss is very high. Thus for stars above or equal to 25 M⊙, this diagram is sensitive to both mass loss and mixing. Since WN subtypes are sensitive to the optical thickness of the winds, while is sensitive to both mixing and mass loss, one should try to define the domains of this diagram where ”slash stars”, LBV, WN late and WN early are each located on average. Ideally this should also be attempted for stars in different galaxies. For masses below 25 M⊙, this diagram indicates up to which stage mixing is proceeding for stars of different luminosities, which is also a useful indication.
The evolution of the (C+O)/He ratio as a function of luminosity is shown in Fig. 20, which is the key diagram for WC stars as shown by Smith & Maeder (SmithM91 (1991)). The evolution for a given mass is upwards, the luminosity decreases as the stellar masses decreases. At the same time, as a result of mass loss and mixing, the (C+O)/He ratio goes up, since there are more and more products of He–burning at the stellar surface. Rotation drastically modifies the tracks of WC stars in this diagram, as well as the lifetimes. The tracks of the models of 85 and 120 M⊙ are shifted to lower luminosities by rotation. As there is a tight mass–luminosity relation for He, C, O stars (Maeder Maeder83 (1983)), this is the result of the smaller mass at the entrance of the WC phase for models with rotation. The smaller mass is due mainly to the much longer WN phase of rotating models. (As a minor remark, we see that the (C+O)/He ratio goes slightly higher in models without rotation, this is due to the fact that the He– and C–burning proceeds a bit farther in non rotating models that have a higher mass). For the models of 60 M⊙, there is a small difference at the beginning of the WC phase and this difference quickly disappears. The 40 M⊙ models enter the WC phase only if rotation is significant. In a previous work (Smith & Maeder SmithM91 (1991)), we have shown that metallicity strongly shifts the tracks in this diagram. Thus, we now see that rotation is also producing great shifts. The location of WC stars of different subtypes and composition should be attempted; it would be particularly worth considering WC stars of galaxies of different .


8 Conclusion
The good agreement obtained here between the observed WR star populations and the predictions of the rotating stellar models reinforces the general conclusion, already obtained in previous works, namely that rotation is a key physical ingredient of massive star evolution. Population synthesis for galaxies and starbursts should also be based on stellar models with rotation. The same is true for nucleosynthetic models.
Rotation, in addition to making the models more realistic, opens new ways to explore very interesting questions. Among them let we cite the possible relations between rotation and the ring nebulae observed around some WR stars, the relation between rotation and the LBV phenomenon, the rotation of pulsars and the link to –ray bursts.
References
- (1) Angulo, C, Arnould, M., Rayet, M. et al. 1999, Nucl. Phys. A, 656, 3
- (2) Conti, P.S., & Massey, P. 1989, ApJ, 337, 251
- (3) Crowther, P.A., Smith, L.J., & Willis, A.J. 1995, A&A, 304, 269
- (4) Dessart, L., Crowther, P.A., Hillier, J.D., Willis, A.J., Morris, P.W., & van der Hucht, K.A. 2000, MNRAS, 315, 407
- (5) Fliegner, J., & Langer, N. 1995, IAU Symp. 163, ed. K. A van der Hucht & P.M. Williams, (Dordrecht: Kluwer), 326
- (6) Foellmi, C., Moffat, A.F.J., & Guerrero, M.A. 2003, MNRAS, 338, 1025
- (7) Friend, D.B., & Abbott, D.C. 1986, A&A, 311, 701
- (8) Hamann, W.R., & Koesterke, L. 1999. IAU Coll. 169, eds. B. Wolf, O. Stahl, & A.W. Fullerton, (Berlin: Springer). Also Lecture Notes in Physics, 523, 1999, p. 239
- (9) Heger, A. 1998, phD, Max–Planck–Institut für Astrophysik, München
- (10) Heger, A., & Langer, N. 2000, ApJ, 544, 1016
- (11) Herrero, A., Puls, J., & Villamariz, M.R. 2000, A&A, 354, 193
- (12) van der Hucht, K.A. 2001, New Astronomy Reviews, 45, 135
- (13) Iglesias, C.A., & Rogers, F.J. 1996, ApJ, 231, 384
- (14) de Jager, C., Nieuwenhuijzen, H., & van der Hucht, K.A. 1988, A&AS, 72, 259
- (15) Langer, N. 1991, A&A, 248, 531
- (16) Langer, N. 1997, The Eddington Limit in Rotating Massive Stars. In: Nota A., Lamers H. (eds.) Luminous Blue Variables: Massive Stars in Transition. ASP Conf. Series, 120, p. 83
- (17) Lauterborn, D., Refsdal, S., & Weigert, A. 1971, A&A, 10, 97
- (18) Maeder, A. 1983, A&A, 120, 113
- (19) Maeder, A. 1987, A&A, 178, 159
- (20) Maeder, A. 1991, A&A, 242, 93
- (21) Maeder, A. 1996, in Wolf-Rayet stars in the framework of stellar evolution, ed. J.M. Vreux et al. (Université de Liège, Institut d’Astrophysique), 39
- (22) Maeder, A. 2002, A&A, 392, 575
- (23) Maeder, A., & Meynet, G. 1989, A&A, 210, 155
- (24) Maeder, A., & Meynet, G. 1994, A&A, 287, 803
- (25) Maeder, A., & Meynet, G. 2000a, A&A, 361, 159, (paper VI)
- (26) Maeder, A., & Meynet, G. 2000b, ARAA, 38, 143
- (27) Maeder, A., & Meynet, G. 2001, A&A, 373, 555, (paper VII)
- (28) Martins, F., Schaerer, D., & Hillier, D.J. 2002, A&A, 382, 999
- (29) Massey, P. 2003, ARAA, in press
- (30) Massey, P., & Johnson, O. 1998, ApJ, 505, 793
- (31) Massey, P., & Duffy, A.S. 2001, ApJ, 550, 713
- (32) Massey, P., & Holmes, S. 2002, ApJ, 580, L35
- (33) Meynet, G. 2000. In Massive Stellar Clusters, ASP Conf. Ser. 211,, eds A. Lançon & C. M. Boily, p. 105
- (34) Meynet, G., & Maeder, A. 1997, A&A, 321, 465, (paper I)
- (35) Meynet, G., & Maeder, A. 2000, A&A, 361, 101, (paper V)
- (36) Meynet, G., & Maeder, A. 2002, A&A, 390, 561, (paper VIII)
- (37) Meynet, G., Maeder, A., Schaller, G., Schaerer, D., & Charbonnel, C. 1994, A&A Suppl., 103, 97
- (38) Nugis, T., & Lamers, H.J.G.L.M. 2000, A&A, 360, 227
- (39) Sackman, I.J., & Anand, S.P.S. 1970, ApJ, 162, 105
- (40) Schaerer, D. 1996, ApJ, 467, L17
- (41) Schaerer, D., & Maeder, A. 1992, A&A, 263, 129
- (42) Schaller, G., Schaerer, D., Meynet, G., & Maeder, A. 1992, A&A Suppl., 96, 269
- (43) Schild, H., Crowther, P.A., Abbott, J.B., & Schmutz, W. 2003, A&A, 397, 859
- (44) Spruit, H. 2002, A&A, 381, 923
- (45) Smith, L.F., & Maeder, A. 1991, A&A, 241, 77
- (46) Talon, S., & Zahn, J.P. 1997, A&A, 317, 749
- (47) Vink, J.S., de Koter, A., & Lamers, H.J.G.L.M. 2000, A&A, 362, 295
- (48) Vink, J.S., de Koter, A., & Lamers, H.J.G.L.M. 2001, A&A, 369, 574
- (49) Willis, A.J. 1999, IAU Symp. 193, K.A. van der Hucht, G. Koenigsberger, and P.R.J. Eenens eds., p. 1
- (50) Woosley, S. 2003, IAU Symp. 215, Eds. A. Maeder & P. Eenens, in press.