Narrow band survey for intragroup light in the Leo HI cloud,††thanks: Based on observations carried out at the ESO MPI 2.2m telescope, La Silla, and at the VLT - UT4, Paranal, Chile.
We have observed emission line objects located in a 0.26 deg2 field in the M96 (Leo) group, coincident with the intergalactic HI cloud. The emission line objects were selected using the same procedure as used for the search for intracluster planetary nebulae in the Virgo cluster. 29 emission line objects were identified, with [OIII] filter magnitudes brighter than . Their luminosity function has a bright cut-off magnitude fainter than for the luminosity function of the planetary nebulae (PN) associated with the elliptical galaxies in the M96 group. Therefore the vast majority of these emission line objects are compatible with not being intragroup planetary nebulae at the Leo group distance of 10 Mpc. Spectroscopic follow-up of two emission line objects in this Leo field showed that indeed these do not have the [OIII] Å doublet expected for a real PN. The brighter source is identified as a starburst object at redshift , because of a second emission in the near infrared, identified as FeII ( Å).
From these data we derive three main results: (i) from the absence of PN we can determine a more stringent upper limit to the surface brightness in any old stellar population associated with the Leo HI cloud at the surveyed position, . (ii) This translates to an upper limit of for the fraction of luminosity in a diffuse intragroup component in the densest area of the Leo group, relative to the light in galaxies. (iii) Using this Leo field as a blank field, we derive an average fraction of 13.6% background emission line objects that enter in surveys of Virgo intracluster PN. This is in agreement with an earlier estimate (15%) obtained from the Ly break galaxy population at . The small fraction confirms the validity of the selection criteria for intracluster PN candidates in Virgo.
Key Words.:
Planetary nebulae, Galaxies: groups: M96, Intergalactic medium, Galaxies: ISM1 Introduction
Very little is known about the fraction of the diffuse stellar component in low density environments, such as in galaxy groups. If most of the intracluster light (ICL) originated by being removed from galaxies through collisions (Moore et al. 1996), the fraction of intragroup light (IGL) could be significantly less than that seen in rich clusters. Numerical simulations of mass stripping in compact groups of galaxies predict a fraction of , depending on the initial conditions (Gómez-Flechoso & Domínguez-Tenreiro 2001). So far, the only observational evidence for the IGL in the intragroup region is for the M81 group, and results in less than 3 of the total stellar luminosity in the group galaxies (Feldmeier et al. 2002).
Recently, significant samples of photometric intracluster planetary nebulae (ICPNe) candidates in nearby clusters were obtained (Ciardullo et al. 1998; Feldmeier et al. 1998; Feldmeier 2000; Arnaboldi et al. 2002, 2003; Okamura et al. 2002; Aguerri et al. 2003), based on their strong emission in the [OIII] Å line. Subsequent spectroscopic surveys (Freeman et al. 2000; Ciardullo et al. 2002b; Arnaboldi et al. 2003) confirmed that the majority of these PN candidates are true ICPNe, based on the presence of the [OIII] doublet in these spectra. In the Virgo surveyed fields, the diffuse light may represent 10-40 of the total light of the cluster galaxies (Feldmeier et al. 1998; Ferguson, Tanvir & von Hippel 1998; Okamura et al. 2002; Arnaboldi et al. 2003; Aguerri et al. 2003).
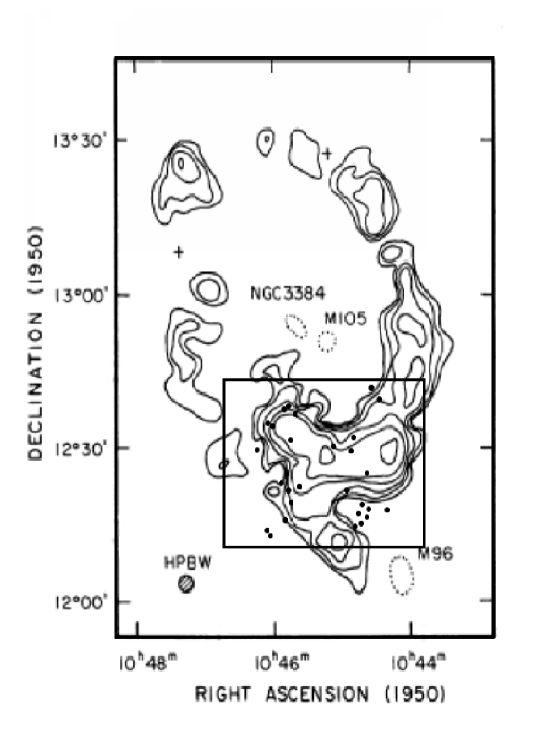
In the present work we report on the results of a narrow band imaging survey for emission line objects in the Leo group. The Leo group consists of early-type galaxies, among which NGC 3379 (M105) and NGC 3384, and the spiral galaxies NGC 3368 (M96) and NGC 3351 (M95) (Schneider 1989). Our surveyed field is centred on the peak of the intergalactic HI emission, which was discovered by Schneider et al. (1983), and later shown to be part of the HI ring in rotation around M105 and NGC 3384 (Schneider et al. 1989).
The survey in the Leo group was carried out with the same instrumental set-up as for the Virgo surveys. Emission line objects were identified following the same procedure adopted for ICPN candidates in Virgo (Arnaboldi et al. 2002; Aguerri et al. 2003). We find that no ICPNe are present in the Leo field, as we will show in the following Sections. Thus we can set upper limits for the amount of old stellar light associated with the HI ring, and for the amount of intragroup light in Leo. In addition, this field can be used as a blank field, to derive estimates on the density of background emission line objects, which would fall in the narrow filter bandwidth used for the detection of ICPNe in Virgo.
This paper is organized as follows: in Section 2 we present the photometric observations, and summarize the extraction procedure of the emission line objects. The spectroscopic follow-up of two emission line candidates are presented and discussed in Section 3. The implications for the luminosity associated with the HI cloud in Leo, the diffuse intragroup light in the Leo group, and the number density of Ly emitters in Virgo-related surveys are discussed in Section 4. Conclusions are given in Section 5.
2 WFI survey in the Leo cloud
2.1 Observations
We observed a field in the Leo group centered at (J2000)=10h47m36s and (J2000)=+12 (see Figure 1) in March 1999, during the Observatory of Capodimonte guaranteed time at the WFI mosaic camera, mounted on the ESO MPI 2.2 meter telescope at La Silla, Chile. The camera is mounted at the Cassegrain focus of the telescope, giving a field of view of . It consists on a mosaic of 8 CCD detectors with narrow inter-chip gaps, yielding an area covering factor of 95.9 % and a pixel size of . The CCDs have read-out noise of 4.5 e- pix-1 and a gain of 2.0 e- ADU-1, on average.
To search for planetary nebulae in the intragroup region, we adopted the “on-off band” technique. This technique was developed by Ciardullo et al. (1989a,b) and Jacoby et al. (1990) for the detection of PNe in elliptical galaxies. Theuns & Warren (1997), Arnaboldi et al. (2002) and Feldmeier et al. (2003) adapted it for automatic detection on large mosaic images to search for ICPNe in nearby clusters. The Leo intragroup field was imaged in the broad band filter and in a 28.2 Å wide narrow band filter, centered at 5026.1 Å. The central wavelength and the bandwidth of this narrow band filter correspond to the redshifted [OIII] Å emission and the distribution of systemic velocities in the Leo group. The exposure time for each individual frames was 300 sec in the V band and 3000 sec in the narrow band [OIII] filter. A set of 6 frames were taken in each filter, so that the total exposure time is 1800 sec and 18000 sec for the off and on-band, respectively. These sequences were acquired in a dithered elongated-rhombi pattern. This strategy ensures the removal of CCD gaps in the final co-added image, a better flat fielding correction, and bad pixel/column removal. The atmospheric seeing was on the final combined images.
2.2 Data Reduction
The data reduction was carried out using standard IRAF tasks from the MSCRED package (see Arnaboldi et al. 2002 for further details). The CCD mosaic frames were de-biassed, dark corrected, and flat-fielded. Flat-field images were constructed by combining a series of twilight sky and dome flat images, taken during each observing night. After flat-fielding we noticed that some residual structures were still present in the sky background, which had to be removed before the final co-added image would be produced. A “super-flatfield” image was constructed from the Leo science images, using a 3 rejection algorithm for the removal of all sources in the field. The astrometric solution was computed for each image, and then they were corrected for geometric distortions111This effect is very important at the image borders because of their large size., sky subtracted, transparency corrected, and then combined (see Arnaboldi et al. 2002).
Landolt fields of standard stars were acquired for flux calibration in the V band: Landolt 98 and Landolt 107 (Landolt 1992); a spectrophotometric standard star – Hiltner 600 (Hamuy et al. 1992, 1994) was used for the calibration of the narrow band filter. The zero points for the narrow and broad band filters in the AB magnitude system are: Z[OIII]=20.38 and ZV=23.97 for a 1 s exposure. The integrated flux from the [OIII] line of a PN is usually expressed in the magnitude system defined by Jacoby (1989); the AB system is defined by the flux per unit of frequency (Oke 1990). Hereafter we will refer to the [OIII] magnitude in the AB system as . The relation between these two systems depends on the filter characteristics (Arnaboldi et al. 2002), and in our case we have:
| (1) |
Because the WFI is mounted at the Cassegrain focus of the ESO MPI 2.2m telescope (f/8), the effects of the converging beam on the trasmission properties of our interference filter can be neglected.
2.3 Catalog of emission line candidate objects
We have used SExtractor (Bertin & Arnouts 1996) to carry out the photometry of all sources in the field. This program is optimized to detect, measure and classify sources (star vs. galaxy) on astronomical images. It is very useful for the analysis of large extragalactic surveys. Monte-Carlo simulations were used to set the SExtractor parameters and optimize source detection. A background sky image for the [OIII] image was computed following Arnaboldi et al. (2002). A population of 1000 point-like objects, with a given luminosity function (LF), were then added on this image, at random positions. We then measured how many objects were detected, the number of spurious objects due to noise, and the faintest magnitude reached, for a given detection threshold. This procedure was repeated several times, with different SExtractor detection thresholds between 0.7 and 1.3, where is the count RMS of the background sky image222 Detection is performed once the image is convolved with a Gaussian kernel reproducing the bright star PSF, and at least 5 pixels must be above threshold to trigger detection..
| Low Threshold | Objects Retrieved | Spurious Objects | Limiting Magnitude (mOIII) |
| 0.7 | 435 | 404 | 24.14 |
| 0.8 | 385 | 79 | 24.09 |
| 0.9 | 341 | 33 | 23.99 |
| 1.0 | 310 | 20 | 23.95 |
| 1.1 | 277 | 11 | 23.84 |
| 1.2 | 254 | 8 | 23.75 |
| 1.3 | 230 | 7 | 23.67 |

Table 1 shows the fraction of spurious vs. real objects retrieved in this field, and the corresponding [OIII] limiting magnitude, for several detection thresholds. This limiting magnitude is defined as the magnitude at which 50 of the input simulated objects are retrieved. Figure 2 shows a plot of the ratio of spurious vs. real objects, for different values of the detection threshold. For thresholds lower than 0.9, the fraction of spurious objects increases rapidly. In the following analysis we will adopt a conservative threshold of 1.0 for the source detection in our catalogs. With this adopted detection threshold, the limiting magnitude of the [OIII] narrow band image is 23.95 (in the AB system), which corresponds to m5007= 27.49. Figure 3 shows both the input and recovered LF of the simulated objects, the spurious and real objects detected, and the limiting magnitude at the 1.0 threshold.
Once the catalog of the [OIII] detected sources is obtained, we measure the V band flux at the [OIII] source position. Figure 4 shows the color-magnitude diagram (CMD) for the [OIII] detected sources in the Leo intragroup field. The limiting magnitude in the final V band mosaic image was calculated using the expression
| (2) |
where is the radius of the seeing disk, represents the RMS of the sky background in the V band333 CCD gaps and regions were the background RMS in the V and [OIII] images were high are masked. The masked total area is a negligible fraction of the area in the final images.. With this equation, the limiting magnitude is 24.73.

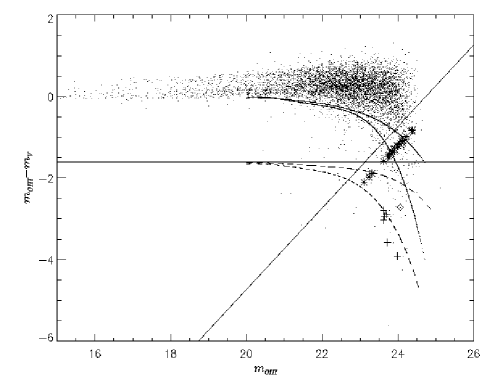
The selection of the most reliable emission line candidates was carried out following the same criteria as in Arnaboldi et al. (2002), i.e. these are point-like objects with Å (including the photometric errors), and with broadband emission fainter than the V limiting magnitude. The final candidates are indicated with crosses and asterisks in the CMD in Figure 4. A total sample of 29 objects was obtained in the Leo field.
| RA (J2000) | DEC (J2000) | mOIII | errOIII | ||
|---|---|---|---|---|---|
| (h m s) | (∘ ’ ”) | () | |||
| 10:48:41.024 | 12:09:32.27 | 23.10 | 0.17 | 26.55 | |
| 10:48:37.555 | 12:02:40.58 | 23.23 | 0.14 | 26.77 | |
| 10:48:26.158 | 11:58:38.18 | 23.32 | 0.17 | 26.86 | |
| 10:47:20.454 | 12:06:39.48 | 23.61 | 0.21 | 27.15 | 509 |
| 10:47:00.162 | 12:01:24.95 | 23.61 | 0.19 | 27.15 | 402 |
| 10:48:30.937 | 11:59:23.40 | 23.62 | 0.18 | 27.16 | |
| 10:48:26.944 | 12:15:37.48 | 23.64 | 0.23 | 27.18 | 457 |
| 10:47:26.160 | 12:21:44.82 | 23.72 | 0.16 | 27.26 | 847 |
| 10:48:48.120 | 12:22:40.25 | 23.72 | 0.21 | 27.26 | |
| 10:48:42.686 | 12:24:36.55 | 23.75 | 0.23 | 27.29 | |
| 10:47:30.498 | 12:15:14.04 | 23.77 | 0.19 | 27.31 | |
| 10:47:05.694 | 11:58:56.78 | 23.82 | 0.23 | 27.36 | |
| 10:48:19.028 | 12:05:15.02 | 23.85 | 0.19 | 27.39 | |
| 10:47:24.579 | 12:14:51.43 | 23.88 | 0.20 | 27.42 | 336 |
| 10:48:25.801 | 12:13:15.26 | 23.89 | 0.21 | 27.43 | |
| 10:48:31.084 | 12:03:31.83 | 23.91 | 0.22 | 27.45 | |
| 10:47:07.751 | 12:17:22.55 | 23.91 | 0.23 | 27.45 | |
| 10:47:25.932 | 12:01:39.90 | 23.98 | 0.21 | 27.52 | 1169 |
| 10:47:30.899 | 12:20:52.38 | 23.98 | 0.25 | 27.52 | |
| 10:47:29.315 | 12:03:20.04 | 23.99 | 0.24 | 27.53 | |
| 10:47:01.458 | 12:13:18.74 | 24.04 | 0.21 | 27.58 | |
| 10:47:38.868 | 12:06:27.66 | 24.09 | 0.19 | 27.63 | |
| 10:48:30.602 | 12:00:59.27 | 24.10 | 0.21 | 27.64 | |
| 10:47:23.065 | 12:21:27.01 | 24.12 | 0.23 | 27.66 | |
| 10:47:10.454 | 12:17:30.28 | 24.12 | 0.22 | 27.66 | |
| 10:48:52.168 | 12:01:43.69 | 24.21 | 0.27 | 27.66 | |
| 10:48:07.852 | 12:14:24.17 | 24.35 | 0.33 | 27.89 | |
| 10:47:26.305 | 12:06:12.09 | 24.36 | 0.25 | 27.90 | |
| 10:48:36.234 | 12:01:07.16 | 24.38 | 0.26 | 27.92 |
2.4 Luminosity function and nature of the candidates
The PN luminosity function (PNLF) has been used extensively as distance indicator in late and early-type galaxies (Ciardullo et al. 2002a). Observations in ellipticals, spirals, and irregular galaxies have shown a PNLF truncated at the bright end. The shape of this LF is given by the semi-empirical fit
| (3) |
where is a positive constant, and the cutoff (Ciardullo et al. 1989b). In Figure 5, we plot the PNLF for NGC 3379, NGC 3384, NGC 3377 (Ciardullo et al. 1989a), NGC 3351 (Ciardullo et al. 2002b) and NGC 3368 (Feldmeier et al. 1997) which are located in the Leo group, near the HI cloud, at a distance of 10 Mpc. The LF of the spectroscopically confirmed ICPNe located in Virgo (from the FCJ field; Arnaboldi et al. 2002) is also reported in this Figure; its bright cutoff places the front edge of the Virgo cluster at 12.8 Mpc444All distances quoted have been determined using the PNLF, cf. Ciardullo et al. (1989a).. These PNLFs are then compared with the LF of the selected candidates in the Leo intragroup field. The bright edge of this LF is magnitudes fainter than the PNLFs in Leo galaxies and mag fainter than the PNLF for the spectroscopically confirmed ICPNe in our Virgo fields. Both values are much larger than the photometric errors, see Table 2. Given the well-studied properties of the PNLF in galaxies, this Figure shows that these emission line candidates are not a population of PNe at the distance of 10 Mpc, and are not associated with the HI cloud in the Leo intragroup region.

.
2.5 Comparison with the LF of field Ly emitters
The bright edge of the LF for the point-like emission line candidates in the Leo field at rules out PNe at a distance of 10 Mpc as a possible explanation for these sources. These objects must therefore be background emitters, either [OII] emitters at , or Ly emitters at . Our criteria will select preferentially Ly galaxies at , while [OII] emitters at are unlikely because of the EW Å requirement (Hammer et al. 1997; Hogg et al. 1998). We must then compare the LF of our selected emission line objects with the LF of Ly galaxies at .
There is no well-sampled Ly LF of such objects at in the literature. Very recent results for the Subaru deep field were obtained for the Ly population at (Ouchi et al. 2003), but Arnaboldi et al. (2002) derived it from the work by Steidel et al. (2000). The resulting LF, scaled to our effective volume here555The filter FWHM for the Leo survey is a factor 2.83 narrower than for the Virgo survey by Arnaboldi et al. (2002)., is shown as full line in Figure 6. We have also added data points constructed from the Ly blank field search done by Cowie & Hu (1998), and the spectroscopically confirmed Ly sample from Kudritzki et al. (2000). Table 3 gives the data obtained for the different LF plotted on Figure 6. The resulting LFs for the field Ly emitters at agree very well with that computed from Steidel et al. (2000).
In these works (Cowie & Hu 1988; Steidel et al. 2000; Kudritzki et al. 2000) Ly emitters are identified via their narrow line excess, regardless of whether their emission is point-like or resolved. Therefore we have produced a catalog of all objects with line excess ( Å), both point-like and extended, to be compared with the composite field Ly LF at . The LF of emission line candidates in the Leo field agrees well with both the inferred and the observed LF of Ly emitters at ; however, the brightest Ly emitters with are not present in the surveyed Leo region.
From visual inspection of the candidate distribution in Figure 1, it seems poorly correlated with the HI density contours of the Leo gas cloud, and given the properties of their LF, which strengthen their association to Ly emitters at , their clustering properties should be compared with the results of Ouchi et al. (2003). Unfortunately the clustering signal from a sample of 29 objects is very noisy; see Aguerri et al. (2003) for additional details.
| log(N) | source | |
| (objects/mag) | ||
| 26.80 | 1.10 | Leo emitters |
| 27.12 | 1.34 | |
| 27.44 | 1.75 | |
| 27.76 | 1.50 | |
| 26.15 | 1.16 | Cowie Hu (1998) |
| 27.11 | 1.49 | |
| 27.66 | 1.57 | |
| 28.21 | 1.32 | |
| 26.35 | 1.38 | Kudritzki et al. (2000) |
| 26.85 | 1.69 | |
| 27.35 | 1.39 | |
| 27.85 | 1.99 |

3 Spectroscopic follow-up
3.1 Observations with FORS2 at UT4-VLT
The spectroscopic follow-up of two the emission line candidates in the Leo field was carried out in a subregion, centred at , , as a backup program at UT4 of the VLT at Paranal, on the nights of the 13-14 of April 2002, with FORS2 in MOS mode. The FORS2 field of view covers an area of in standard resolution.
Our selected targets were each assigned a MOS slitlet (in MOS mode, up to 19 movable slitlets can be allocated within the field). Observations were carried out with GRISM-150I and the order separation filter GG435+81, giving a wavelength coverage of Å and a dispersion of Å pix-1. The angular scale across the dispersion is pix-1. The nights were clear, but not photometric. The mean seeing was better than despite strong northerly winds. Because the observations were done in blind offset mode, the slitlet width was chosen to be . Slitlets were positioned on the two objects listed in Table 4; IG1 and IG2. Three stars in the field were selected for pointing checks, and two stars were used to obtain the correct mask position and alignment, via the acquisition of their “through slit” image. The total exposure time was . Spectrophotometric standard stars were observed at the beginning and end of the nights, but the conditions made the flux calibration uncertain.


| Name | (J2000) | (J2000) | OIII | V |
|---|---|---|---|---|
| (h m s) | (∘ ’ ”) | |||
| IG1 | 10 48 37.56 | +12 02 40.58 | 23.2304 | 99.0000 |
| IG2 | 10 48 47.92 | +12 02 23.74 | 24.0590 | 26.7774 |
IG1 is the second brightest object listed in Table 2. IG2 was not selected as a PN candidate for Table 2, because of its position in the CMD above the 97.5% line for EW. Its position in the CMD is caused by errors in the narrow band photometry, see Figure 4.
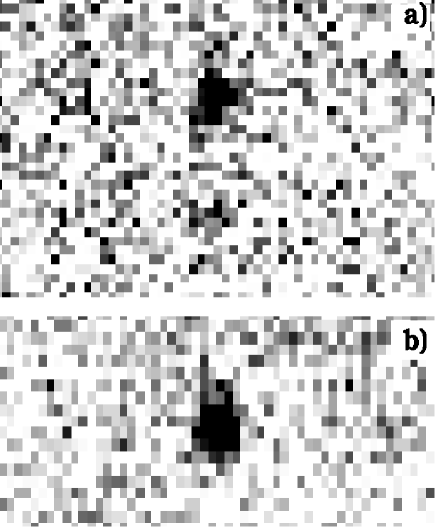
Two-dimensional (2D) spectra of the selected targets are shown in Figure 7; IG2 turns out to be a multi-component emission, with an additional fainter source near the strongest emission source detected in our imaging survey. 1D-spectra for IG1 and IG2, wavelength and flux-calibrated, are shown in Figure 8 and 9.
In Table 5 we report on the parameters determined for the emission lines detected for IG1, IG2A, and IG2B, via a Gaussian fit. All detected lines near Å have a FWHM of several times the instrumental resolution.
3.2 Results
In the spectrum associated with IG2A, there is no emission at Å, which would correspond to the redshifted Å emission of the [OIII] doublet, had the strongest emission been the [OIII] Å PN emission. We can also exclude that this strong emission is a redshifted [OII] Å line of a starburst emitter at redshift , because the redshifted H and [OIII] Å emissions should then be visible in the red part of the spectrum (respectively at and Å), and we can similarly exclude [MgII] Å at . In addition, the observed line is broad and asymmetric. This object is most likely a Ly emitter at ; see also Kudritzki et al. (2000), where similar findings are discussed for emission line objects in Virgo.
The 1D spectrum of the second (weaker) emission, labeled IG2B, is centred at Å. Similar considerations to those for IG2A suggest that this is also a Ly emitter, at redshift .
For IG1, again there are no additional lines in the optical, excluding redshifted [OIII] Å, [OII] Å, and [MgII] Å as identification for the observed emission at Å. This, and the fact that the observed line is broad and asymmetric, argue that we are seeing a Ly line. The near-infrared part of the spectrum shows an additional weak emission line at Å. Both observed lines can be explained if the emission line object is a Ly emitter at redshift , in which case the second line is from red-shifted, Ly fluorescent FeII UV emission at Å (Sigut & Pradhan 1998). The other strong lines then expected at longer wavelengths from fluorescent FeII are not detected in our spectrum. They would fall in the region of strong OH sky emission. These FeII UV multiplets are observed in the spectra of active galactic nuclei (AGN) with broad line regions, and the Ly fluorescent excitation can more than double the FeII flux in the UV, producing ultrastrong UV FeII emission (Graham, Cloves & Campusano 1996). IG1 must then be an AGN at and therefore be different from the metal-poor, almost dust-free Ly galaxies observed by Kudritzki et al. (2000).
4 Discussion
The main conclusion of the present work is that there is no population of PNe at 10 Mpc associated with the intragroup HI cloud in the Leo group, because (i) the bright edge of luminosity function (LF) for the emission line objects in this field is magnitude fainter than the bright cut-off of PNLF for the main elliptical galaxies in Leo; (ii) the LF of the emission line candidates in the field agrees with the LF for Ly emitters at ; and (iii) the spectra taken for two emission line candidates showed that they are Ly objects. None of the acquired spectra showed the typical [OIII] doublet expected in real PNe.
4.1 Limits on the surface brightness of the Leo HI cloud
We can set an upper limit to the number of PNe at 10 Mpc, associated with the HI cloud, of PN in the first 2 magnitudes fainter than the PNLF bright cut-off:
-
•
The bright cut-off in the LF for a PN population at 10 Mpc would be at . The brightest object out of our list of 29 objects down to has . Given the shape the PNLF, we would expect more than 10 PN brighter than if the objects we see were PNe. The absence of bright PNe is also not a consequence of absorption by dust in the HI cloud. With a typical column density of and the Galactic relation between absorption and column density (Bohlin, Savage & Drake 1978) we expect a typical absorption of mag.
-
•
In addition, the comparison of the LF of the emission line objects in the Leo field with the Ly LF at and the spectroscopic follow-up both indicate that our emission candidates are most likely Ly emitters.
Thus we conclude that no PN are detected in the range .
We can use the upper limit of PN in the Leo field to set an upper limit to the luminosity of an old stellar population associated with the Leo HI cloud. The relation between the two is contained in the luminosity-specific PN density . This measured quantity depends on the age and metallicity of the stellar population (Hui et al. 1993). The best estimate for an old bulge population comes from measurements of the PNLF in M31 (Ciardullo et al. 1989b), resulting in , where is the ratio of the number of PN in the first two magnitudes from the bright cutoff to the B-band luminosity of the population. From this, we obtain an upper limit to surveyed B-band luminosity in the field, which depends on the value assumed for .
From observations of early-type galaxies, the luminosity-specific PN density can vary by a factor five (Hui et al. 1993), and the number adopted here is the average value. The upper limit on the surveyed luminosity is then . The corresponding surface brightness limit is or . Previous estimates of the HI cloud surface brightness were based on CCD photometry, and provided upper limits in the optical and NIR band. Skrutskie, Shure & Beckwith (1984) gave upper limits to mag arcsec-2 and mag arcsec-2. Then Pierce & Tully (1985) provided tighter limit in the B band, down to mag arcsec-2. Adopting this upper limit for the surface brightness in the B band, we can compute the associated luminosity in our surveyed field, and compare it with our new estimate. From Pierce & Tully (1985), the total B luminosity in our survey field would be . The fact that no PNe is found 2 magnitudes down the PNLF bright cut-off, implies a stronger limit on the total luminosity, i.e , which is an order of magnitude fainter than the Pierce & Tully (1985) estimates.
The mass estimates of Schneider et al. (1983) for the HI cloud can be combined with our surface brightness upper limit and provide a lower limit to the ratio. Our surface brightness limit at the position of the HI peak correspond to L⊙pc-2. The HI surface density at this position is at least M⊙pc-2, which gives a lower limit of M⊙/L⊙. This number is significantly higher than the values of dwarf galaxies, so the Leo HI cloud cannot be interpreted as a tidally disrupted gas rich dwarf galaxy, and may not have formed stars yet.
4.2 Upper limits on the diffuse stellar population in the Leo group
The upper limit on the B-band luminosity in our survey field also gives a constraint on the fraction of diffuse light in the Leo group. As described in Section 4.1, we have in the surveyed field, implying that the surface brightness of the diffuse stellar population in the field is mag arcsec-2. We can take this limit as characteristic for the inner deg2 region of the Leo group centred on the HI intragroup cloud, as discussed by Schneider (1989). There is evidence that ICL is not uniformly distributed in clusters, but the field-to-field fluctuations related the non-uniform distribution of ICPNe are smaller than the uncertainty in the observed values. The total luminosity from individual galaxies in this Leo region amounts to ; if this flux was distributed uniformly on the deg2 area, this would give a surface brightness of mag arcsec-2. Comparing with the current limit of , we obtain an upper limit for the fraction of diffuse light in the inner Leo group of %.
This upper limit for the fraction of diffuse IGL is at least ten times smaller than recent measurements of the fraction of intracluster light in the Virgo cluster (Arnaboldi et al. 2002, 2003; Ciardullo et al. 2002b). This is an interesting result because the inner region of the Leo group consists of predominantly early-type galaxies, which during their possible merger formation might have lost a fraction of the progenitor stars.
4.3 The Leo field as a blank field: density of background sources
Given the absence of any intragroup PN at 10 Mpc, the Leo field can be used as a blank control field for computing the number of background line emitters which fall in the spectral range of the narrow band filters used for the detection of ICPNe in Virgo. The instrumentation and the selection criteria implemented for the Leo survey are the same as adopted by Arnaboldi et al. (2002) and Aguerri et al. (2003) for their study of the ICPN samples in Virgo. Their ICPN samples were obtained for three Virgo fields, which we shall refer to hereafter as RCN1, CORE and FCJ. The atmospheric seeing in the final combined images for all Virgo and Leo fields is . Also, the limiting magnitude in the off-band V photometry is very similar in all fields. Area covered, filter characteristics (, and FWHM) and limiting magnitude of the ICPN samples in these fields are summarized in Table 6.
| Field Id. | Area of Field | Limiting | Filter | N. of Sources | Extrapolated N. | Contamination Rate |
|---|---|---|---|---|---|---|
| (arcmin2) | Magnitude | and FWHM (Å) | in Leo Field | of Contaminants | (%) | |
| RCN1 | 943 | 26.71 | 5023, 80 | 1 | 3 | 5 |
| CORE | 943 | 27.21 | 5023, 80 | 7 | 20 | 26 |
| FCJ | 265 | 27.01 | 5027, 44 | 3 | 2 | 10 |
| Average | 13.6 |
We can scale the Leo results to the effectively surveyed volumes and limiting magnitudes of the Virgo fields, and derive the expected fraction of background emitters in the ICPN samples. From Table 6, the average fraction is 13.6%. Given the large EW criterium adopted in our Leo and Virgo surveys, the background line emitters are most likely Ly emitters at z. Arnaboldi et al. (2002) computed the LF of Ly emitters in their sample from the work of Steidel et al. (2000). The fraction of the expected contamination by Ly emitters in the first magnitude of their ICPN sample was . This value is in agreement with the results from the Leo blank field.
Previous studies have investigated the fraction of background emission-line objects in the ICPN samples in Virgo. Freeman et al. (2000) provided an estimate of 26% based on the spectroscopic follow-up for an ICPN sample from Feldmeier et al. (1998). Ciardullo et al. (2002b) carried out a survey at Å for emission-line sources in a “blank-field” . Once their results are scaled to the Feldmeier et al. (1998) and Ciardullo et al. (1998) surveys, the reported fraction of high-redshift contaminants in their ICPN samples is 20%.
These independent estimates are all consistent with a range of for the fraction of background emitters in the Virgo ICPN samples in different fields. The mean value appears to be ; the range of values might be due to clustering of the background objects (Ouchi et al. 2003).
5 Conclusions
We have carried out a wide field (0.26 deg2) survey for emission line objects at Å associated with the intragroup HI cloud in the Leo group. A total sample of 29 unresolved emission line objects were selected according to the criteria adopted for ICPNe in Virgo. The luminosity function (LF) of these point-like sources shows a bright cut-off which is magnitude fainter than the bright cutoff of the planetary nebulae LF (PNLF) from the galaxies located in the Leo group. Therefore these emission-line objects cannot be associate with an intragroup PNe (IGPNe) population at the Leo cloud distance (10 Mpc). Most likely they are emission line objects at high redshift. The subsequent spectroscopic follow-up of two of these objects showed that they are Ly emitters at .
The absence of PNe in this field constrain the amount of light associated with the Leo HI cloud. For an old stellar population, the upper limit to the B-band surface brightness is mag arcsec-2, about a factor of ten in flux fainter than previous limits. The corresponding lower limit on the HI mass to B-band luminosity ratio is M⊙/L⊙, much larger than for dwarf galaxies. This indicates that the intergalactic gas in Leo is primordial.
The absence of PNe in the Leo intragroup region, down to , also allows us to set an upper limit for the amount of intragroup light in the Leo group. Our data give in this field. Assuming that this upper limit applies to the inner of the Leo group, the corresponding upper limit to the ratio of diffuse intragroup to galaxy light is .
This survey can therefore be used as a blank field survey for high redshift emitters. We can compute the number of background emission line objects which lies in the spectral range of the narrow band filters used for the detection of ICPNe in the Virgo cluster. When scaled to the number density of ICPN candidates in the Virgo ICPN samples, the average fraction of high-z galaxies in these samples is 13.6, in agreement with the estimate of 15% by Arnaboldi et al. (2002) based on the Lyman break galaxy population at . Including estimates from spectroscopic surveys, the fraction of background emitters in the Virgo ICPN samples in different fields ranges from , with a mean value of about . The range of values might be due to clustering of the background objects (Ouchi et al. 2003).
Acknowledgements.
The authors wish to thank the referee, Dr. J. Feldmeier, whose comments have helped them to strengthen the paper. The authors thank the ESO 2.2m telescope team for their help and support during observations. M.A. and O.G. thank R. Scarpa for efficient help at UT4. N.C. wish to thank Francisco Garzón for his support and Norberto Castro-Rodríguez for his help in the computational part of this work. This article has made use of data products from NED and the CDS public catalogs. J.A.L.A was supported by Spanish DGC (Grant AYA2001-3939). This work has been supported by the Schweizerischer Nationalfonds and the Universidad de La Laguna-Cajacanarias fellowship (Canary Islands, Spain).References
- (1) Aguerri, J. A. L., et al. 2003, in preparation
- (2) Arnaboldi, M. et al. 2003, AJ, 125, 514
- (3) Arnaboldi, M., Aguerri, J. A. L., Napolitano, N., Gerhard, O., Freeman, K., Feldmeier, J., Capaccioli, M., Kudritzki, R. & Méndez, R. 2002, AJ, 123, 760
- (4) Bertin, E., & Arnouts, S. 1996, A&AS, 117, 393
- (5) Bohlin, R.C., Savage, B.D., Drake, J.F. 1978, ApJ, 224, 132
- (6) Ciardullo, R., Feldmeier, J. J., Jacoby, G. H., Kuzio de Naray, R., Laychak, M. B., & Durrell, P. R. 2002a, ApJ, 577, 31
- (7) Ciardullo, R., Feldmeier, J. J., Krelove, K., Jacoby, G. H., & Gronwall, C. 2002b, ApJ, 566, 784
- (8) Ciardullo, R., Jacoby, G. H., Feldmeier, J. J., & Barlett, R. 1998, ApJ, 492, 62
- Ciardullo, Jacoby, & Ford (1989) Ciardullo, R., Jacoby, G. H., & Ford, H. C. 1989a, ApJ, 344, 715
- (10) Ciardullo, R., Jacoby, G. H., Ford, H. C., & Neill, J. D. 1989b, ApJ, 339, 53
- (11) Cowie L. L. & Hu E. M. 1998, AJ, 115, 1319
- (12) Feldmeier, J.J., Ciardullo, R., Jacoby, G.H., & Durrell, P.R. 2003, ApJS, 145, 65
- (13) Feldmeier, J.J., Durrell, P.R., Ciardullo, R., & Jacoby, G.H. 2002, “A Search for Intra-group Planetary Nebulae in the M81 Group” IAU Symposium No. 209 Planetary Nebulae: Their Evolution and Role in the Universe, Canberra, Australia November 19 - 23, 2001.
- (14) Feldmeier J. J. Mihos, C., Morrison, H.L., Rodney, S., & Harding, P 2000, AAS, 19710601
- (15) Feldmeier J. J. 2000, Ph.D. thesis, Pennsylvania State Univ.
- (16) Feldmeier, J. J., Ciardullo, R. & Jacoby, G. 1998, ApJ, 503, 109
- Feldmeier, Ciardullo, & Jacoby (1997) Feldmeier, J. J., Ciardullo, R., & Jacoby, G. H. 1997, ApJ, 479, 231
- (18) Ferguson, H., Tanvir, N.R., & von Hippel, T., 1998, Nature, 391, 461
- (19) Freeman, K.C. et al., 2000, ASP Conf. Ser. 197, 389
- (20) Gómez-Flechoso, M. A., & Domínguez-Tenreiro, R. 2001, ApJ, 549, L187
- (21) Graham, M. J., Clowes, R.G., & Campusano, R. 1996, MNRAS, 279, 1349
- (22) Hammer, F., et al. 1997, ApJ, 481, 49
- (23) Hamuy, M., Suntzeff, N. B., Heathcote, S. R., Walker, A. R., Gigoux, P., & Phillips, M. M. 1994, PASP, 106,566
- (24) Hamuy, M., Walker, A. R., Suntzeff, N. B., Gigoux, P., Heathcote, S. R., & Phillips, M. M. 1992, PASP, 104, 533
- (25) Hogg, D.W., Cohen, J.G., Blandford, R., & Pahre, M.A. 1998, ApJ, 504, 622
- (26) Hui, X., Ford, H.C., Ciardullo, R., & Jacoby, G.H. 1993, ApJ, 414, 463
- (27) Jacoby, G. 1989, ApJ, 339, 39
- (28) Jacoby, G., Ciardullo, R. & Ford, H. 1990, ApJ,356, 332
- (29) Kudritzki, R-P., et al. 2000, ApJ, 536, 19
- (30) Landolt, A. U. 1992, AJ, 104, 340
- (31) Moore, B., Katz, N., Lake, G., Dressler, A. & Oemler, A., 1996, Nature, 379, 613
- (32) Okamura, S., et al. 2002, PASJ, 54, 883
- (33) Oke, J. B., 1990, AJ, 99, 1621
- (34) Ouchi, M., et al. 2003, ApJ, 582, 60
- (35) Pierce, M. J., & Tully, R. B. 1985, AJ, 90, 450
- (36) Schneider, S.E. 1989, ApJ, 343, 94
- (37) Schneider, S.E., et al. 1989, AJ, 97, 666
- (38) Schneider, S.E., Helou, G., Salpeter, E. E., & Terzian, Y. 1983, ApJ, 273, 1
- (39) Sigut, T.A.A., & Pradhan, A.K. 1998, ApJ, 499, L139
- (40) Skrutskie, M. F., Shure, M. A., & Beckwith, S. 1984, ApJ, 282, 65
- (41) Steidel, C. C., Adelberger, K. L., Shapley, A. E., Pettini, M., Dickinson, M., & Giavalisco, M. 2000, ApJ, 532, 170
- (42) Theuns, T. & Warren, S. J., 1997, MNRAS, 284, 11