The quest for hot gas in the halo of NGC 1511
XMM-Newton observations of the starburst galaxy NGC 1511 reveal the presence of a previously unknown extended hot gaseous phase of its ISM, which partly extends out of the disk plane. The emission distribution is asymmetric, being brightest in the eastern half of the galaxy, where also radio continuum observations suggest the highest level of star formation. Spectral analysis of the integral 0.2–12 keV X-ray emission from NGC 1511 indicates a complex emission composition. A model comprising a power law plus thermal plasma component, both absorbed by foreground gas, cannot explain all details of the observed spectrum, requiring a third spectral component to be added. This component can be a second thermal plasma, but other spectral models can be fitted as well. Its X-ray properties characterize NGC 1511 as a starburst galaxy. The X-ray-to-infrared luminosity ratio is consistent with this result. Together with the X-ray data, XMM-Newton obtained UV images of NGC 1511, tracing massive stars heating the ambient gas, which is then seen in H emission. UV, H and near-infrared imagery suggest that NGC 1511 is disturbed, most likely by its two small companions, NGC 1511a and NGC 1511b.
Key Words.:
galaxies: individual: NGC 1511 – galaxies: general – galaxies: ISM – galaxies: starburst1 Introduction
The most recent generation of X-ray satellites, XMM-Newton and Chandra, has a much higher sensitivity than previous X-ray missions. This enables us to conduct observations of fainter targets than before and to obtain a much more detailed picture of those known already. Increased sensitivity leads to significant progress in investigations of low surface-brightness emitters, such as for example hot gaseous halos around actively star-forming spiral galaxies. As part of the XMM-Newton Guaranteed Time program we have observed the edge-on galaxy NGC 1511. Here we report on the results from these observations.
The XMM-Newton observations of nearby starburst galaxies form part of a multi-wavelength study of all phases of extraplanar gas in external galaxies, which is conducted in order to assess the importance of halos as repositories of a metal-enriched medium and their significance in terms of galactic chemical evolution and possible metal enrichment of the intergalactic medium (IGM; e.g. Heckman et al. 1990; Dahlem et al. 1995, 1998; Weaver et al. 2000; Heckman 2001). Soft X-ray surveys of nearby spiral galaxies, including starburst systems, based on ROSAT data were published e.g. by Read et al. (1997) and Read & Ponman (2001).
| Distance | [Mpc] | 17.5 |
| IR luminosity | log() [erg s-1] | 43.66 |
| FIR flux ratio | 0.54 | |
| H luminosity | log() [erg s-1] | 40.56 |
| Absolute B magnitude | [mag] | –19.6 |
| Rotation velocity | [km s-1] | 112 |
| Star formation rate | SFRIR [ yr-1] | 2.7 |
NGC 1511 is an SAa pec: H II type galaxy with warm dust, as traced by its high far-infrared flux ratio. Its salient properties are collected in Table 1 (from Lehnert & Heckman 1995; scaled to Mpc). These values indicate that NGC 1511 is an intermediate-mass galaxy (more massive than M 82, but less massive than NGC 253) with a high star formation rate (SFR). Optical spectroscopy was published by Lehnert & Heckman (1995) and, recently, by Kewley et al. (2001), establishing its starburst nature. Two extraplanar gas phases were previously detected in NGC 1511: H emission from warm ionized gas (Lehnert & Heckman 1995) and nonthermal radio continuum emission from cosmic-rays and magnetic fields (Dahlem et al. 2001). These detections, together with the high surface brightness of tracers of star formation (SF) in its disk, indicate that it is an actively star-forming galaxy. It is amongst the first starburst galaxies observed with XMM-Newton, together with NGC 253 (Pietsch et al. 2001), NGC 3628 and M 82 (unpublished). Chandra observations of NGC 253, M 82 and NGC 3628 were published by Strickland et al. (2000, 2002), Kaaret et al. (2001) and Matsumoto et al. (2001).
For an overview of papers related to investigations of galactic gaseous halos, refer to Dettmar (1992) and Dahlem (1997). A description of the XMM-Newton observatory has been given by Jansen et al. (2001).
2 Observations and data reduction
Our observations of NGC 1511 were carried out in 2000, July 7–8. The total on-source integration time of the European Photon Imaging Camera (EPIC) pn camera (Strüder et al. 2001) is 40.0 ks. The pn camera performed the observation in extended full frame mode and the two MOS cameras (Turner et al. 2001) were put in full frame mode. For all cameras the thin filter position was chosen, offering the highest possible transmission for very soft X-ray emission. The data were calibrated using the XMM-Newton Science Analysis System (SAS), version 5.3.3, and the Current Calibration File (CCF) version of 2002-10-10. Good time intervals were defined when the total count rate, including background, was cts s-1. After removal of data from time intervals with high background count rates a net integration time of 32.1 ks remains (for the pn camera).
Corrections were applied to the data for the effects of gain variations of the preamplifier channels and charge transfer inefficiency (CTI), bad pixels, chip edges, split events etc. and the counts were converted to the pulse-height invariant (PI) energy scale. Also, in order to fill the gaps in the EPIC pn camera images, images in the corresponding energy bands were produced from the data of the two MOS cameras and all images aligned and superimposed onto each other. The final images presented here are a combination of data from all three EPIC cameras. Photons with energies below 0.2 keV were not used in the data analysis because of the calibration uncertainties in this very soft energy regime. Derived data products (images and spectra) were produced from the final event lists, after application of these corrections.
3 X-ray Results and discussion
In this paper we present only X-ray data from the European Photon Imaging Camera (EPIC; from the pn and both MOS cameras). No Reflection Grating Spectrometer (RGS, den Herder et al. 2001) results are used here, because the target is too faint and too extended for high-resolution X-ray spectroscopy.
3.1 Soft X-ray imaging
Our observations are the first dedicated X-ray observations of NGC 1511. Using the ROSAT All-Sky Survey (RASS) Browser we verified that it was not detected in the RASS. In the data reduction we followed roughly the procedure adopted by the XMM-Newton Survey Science Centre (SSC, Watson et al. 2001) to split up the total passband into several energy bands. The only difference is that we chose to split the 0.5–2.0 keV band into two bands, see Table 2. In one case we combined two SSC bands to show an image with energies ranging from 2.0 keV to 7.5 keV.
| Number | SSC energy range | Number | Energy ranges |
| definition (keV) | used here (keV) | ||
| 1 | 0.20–0.50 | 1 | 0.20–0.50 |
| 2 | 0.51–2.00 | 2a | 0.51–1.30 |
| 2b | 1.31–2.00 | ||
| 3 | 2.01–4.50 | 3 | 2.01–4.50 |
| 4 | 4.51–7.50 | 4 | 4.51–7.50 |
| 5 | 7.51–12.0 | 5 | 7.51–12.0 |
In Fig. 1 we display X-ray images of NGC 1511. The photon distributions which were received in the individual energy bands as defined above were smoothed with an adaptive filter so as to enhance low surface brightness features, while not smearing out the flux of strong point sources. Such images are not suitable for quantitative analyses. The left panel is an overlay of the adaptively-smoothed XMM-Newton 1.3–2.0 keV image on a second generation Digitized Sky Survey (DSS-2) red image. The right panel shows an overlay of the adaptively-smoothed XMM-Newton 2.0–7.5 keV image on the same DSS-2 image of NGC 1511. Contours start at the 2.5- confidence level above the background and are spaced by factors of . The 2.5- levels of the images displayed here are: cts s-1 arcmin-2 (0.5–1.3 keV), cts s-1 arcmin-2 (1.3–2.0 keV) and cts s-1 arcmin-2 (2.0–7.5 keV).
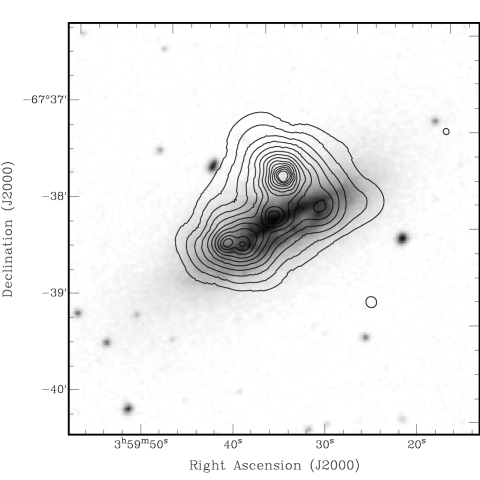

The X-ray emission from NGC 1511 comprises different components, namely hard point sources and also soft extended emission. Extended soft emission is visible across the disk of the galaxy, with a maximum at the position of a prominent SF region on its eastern edge. A weak secondary maximum is visible near the centre of the galaxy. In addition, the soft X-ray emission distribution is extended perpendicular to the disk plane. The strong X-ray point source about north of the centre of NGC 1511, which we will call–according to the IAU convention–XMMU J035936.6–673736, does not have an optical counterpart in either our XMM-Newton Optical Monitor (OM, Mason et al. 2001) images or the DSS. If associated with NGC 1511, it might be an ultra-luminous ( erg s-1) X-ray source (ULX, see e.g. Strickland et al. 2001, Foschini et al. 2002 and references therein). If not related to NGC 1511, it could be a background source, e.g. an AGN (see Sect. 3.2.4).
The emission distribution will be discussed in more detail below, in comparison with other wavebands.
3.2 Integral wide-band X-ray spectroscopy
3.2.1 Spectral extraction
Spectroscopy was performed based on the EPIC pn event list only. Extracting valid (filter #XMMEA_EP) single and double photon events from NGC 1511, an integral source spectrum was obtained. A separate spectrum was extracted for XMMU J035936.6–673736. The source photon extraction region for NGC 1511 is an ellipse with a major axis radius of , a minor axis radius of and a position angle of , centred on the nucleus of NGC 1511. From this, a circular region of radius around =03:59:36.6, =–67:37:36.8 was excised for separate spectral analysis of the emission from XMMU J035936.6–673736. A second, elliptical region was defined near NGC 1511, on a neighbouring pn chip, to determine the local background.111The background photon extraction region is an ellipse equal in size to that for the source photons, but centred at =03:59:05.40, =–67:41:09.9. Extracted spectra were grouped based both on a minimum number of counts (25) for each channel and on the maximum number of spectral channels sampling the pn energy resolution (3). An analysis of the background-subtracted integral spectrum of NGC 1511 over the energy range 0.2–12.0 keV was performed using Xspec v. 11.1.0.
3.2.2 The need for a multi-component fit
| (1) | (2) | (3) | (4) | (5) | (6) | (7) | (8) | (9) | (10) |
|---|---|---|---|---|---|---|---|---|---|
| Soft | Medium | Hard | |||||||
| Model | (c) | (w) | (h) | /d.o.f. | |||||
| MP | 4.3 | 0.24 | 1.0(f) | 2.4 | 1.84 | 0.973/87 | |||
| MMP | 4.1 | 0.19 | 1.0(f) | 1.8 | 0.59 | 1.0(f) | 1.8 | 1.95 | 0.912/83 |
Notes to Table 3:
M = Mekal plasma; P = power law; f = metallicity, , fixed at 1.0 .
a in units cm-2.
b in units keV.
c in units .
Our first attempts, with single emission components plus foreground absorption, for all different kinds of spectral models, provided statistically unacceptable fit results. Therefore, we subsequently tried a combination of a Mewe-Kaastra plasma with Fe-L lines by Liedahl (“Mekal”) model (Mewe et al. 1985, Mewe et al. 1986, Kaastra 1992) plus a power law, also allowing the two components to undergo different absorption. A thermal plasma was chosen to represent the diffuse emission component, while the power law approximates the expected spectrum of the point source(s), which, if associated with NGC 1511, are most likely to be binaries, otherwise background AGN. This improved the quality of the fit (see Table 3), but still some residual emission remained around 0.6, 1.0 and 2.0 keV. Adding to the spectral model a second thermal component leads to a statistically marginally better fit, but improved visibly the fit in the areas that showed residuals before. Thus, the spectrum of NGC 1511 clearly requires a multi-component fit. However, the one presented here is not necessarily the only possible good fit to the spectrum (Table 3). At this time, we can only state that a single thermal component plus power law spectral model cannot explain the entire soft X-ray spectrum of NGC 1511, demonstrating the complexity of the emission spectrum. The nature of the additional third component is as yet uncertain.
3.2.3 Best-fitting spectral model for NGC 1511
The three-component fit with two thermal components described in Table 3 is displayed in Fig. 2. Two thermal components, with their metallicities fixed at 1.0 , were fitted. Fitting the metallicities of the thermal components as a free fit parameter did not statistically improve the fit quality and the values are not constrained sensibly. Therefore, this fit is not shown here. In the fit with fixed metallicities, which we consider the simplest best-fitting model, the relative contribution of the two thermal components and the power law to the total flux are 12% (0.19 keV), 11% (0.59 keV) and 77%, respectively. These relative flux contributions conceal the fact that diffuse thermal emission dominates the total emission in the soft regime, while at hard energies the power-law component is dominant. We have verified by means of spatially resolved spectroscopy of subregions that the thermal emission corresponds with the extended soft component visible in our images. The best-fitting absorbing column densities are higher than the Galactic foreground ( cm-2, Dickey & Lockman 1990), suggesting additional internal absorption in NGC 1511. Based on this fit, we determine a total 0.2–12 keV flux of NGC 1511 of erg s-1 cm-2. This X-ray flux translates to a 0.2–12 keV X-ray luminosity of NGC 1511 of erg s-1. ¿From this value a far-infrared–to–X-ray luminosity ratio of log follows, which is typical for starburst galaxies (Heckman et al. 1990; Read & Ponman 2001). The total diffuse soft X-ray luminosity of NGC 1511 is erg s-1. This leads to a ratio of log. The amount of diffuse soft X-ray emission in NGC 1511, compared to other galaxies, is thus relatively low (Read & Ponman 2001; their Fig. 5, central panel). The temperatures of the thermal plasma components are in line with earlier measurements of other starburst galaxies, based on ROSAT and ASCA data (e.g. Dahlem et al. 1998; Weaver et al. 2000 and references therein). Components at about 0.2–0.3 keV and 0.6 keV were found by us in several starburst galaxies, with the 0.2–0.3 keV component dominant in the halos, while the hotter component is normally observed from gas in the disks. Similar results were also obtained based on previously published data from Chandra and XMM-Newton (see references in Sect. 1).

3.2.4 Model fit to the spectrum of XMMU J035936.6–673736
The best-fitting model spectrum of XMMU J035936.6–673736 (not displayed) is a power-law with and an absorbing column density of cm-2. The 0.2–12 keV X-ray flux of this source is erg s-1 cm-2. The fitted moderately low absorbing column density makes it unlikely that this source is a background AGN, which one would expect to have much higher intrinsic absorption.
3.3 UV imaging
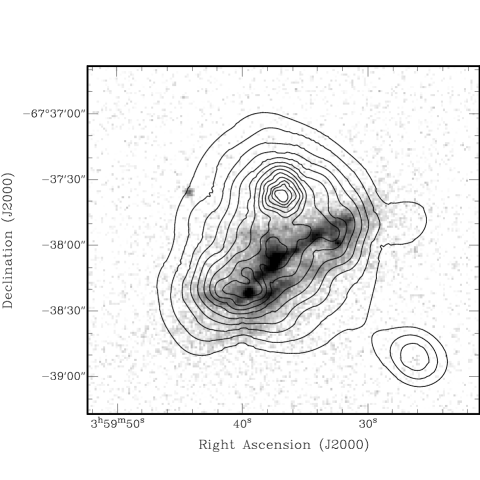
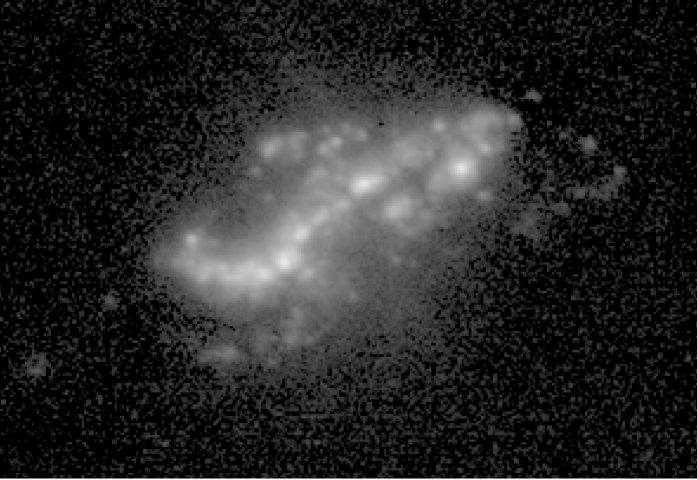
The OM onboard XMM-Newton, with its three UV filters in addition to a range of optical filters, opens a second window on the targets observed that is not accessible from the ground, in the UV. As an example, we present in the left panel of Fig. 3 a 230 nm image of NGC 1511 obtained with the UVM2 filter.
This image exhibits the UV emission from massive stars, which are the primary sources of energy heating the warm ionized gas in NGC 1511. This is the reason for the global correspondence between the emission maxima in the UV and H images. However, it is clear from a comparison of the two frames (Fig. 3 [left panel] and Fig. 4 [right panel]) that there is more diffuse H outside the H II-regions. The presence of such massive stars is yet another indicator of NGC 1511’s activity, as already suggested by its ratio and also by the presence of diffuse halo emission in various wavebands.
In the overlay with the EPIC 0.5–1.3 keV soft X-ray image in the right panel of Fig. 3 one can see that there is basically no spatial correspondence between UV and X-ray emitters in NGC 1511.
The UV point source south-east of the centre of NGC 1511 is probably an unrelated foreground star. It also shows up on an R-band image by Lehnert & Heckman (1995). Its position does not coincide with that of SN1935C or Nova Hydri 1935 (van den Bergh & Hazen 1988).
An OM image obtained with the UVW2 filter (central wavelength about 210 nm), exhibits the same general emission distribution as Fig. 3, however with a lower signal-to-noise ratio. Therefore, it is not displayed here.
4 A multi-wavelength picture of NGC 1511
The observations described here are part of a large project aiming at understanding the nature of gaseous halos around actively star-formating galaxies.
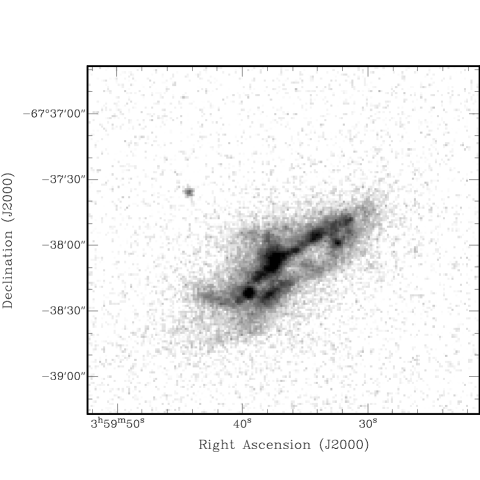
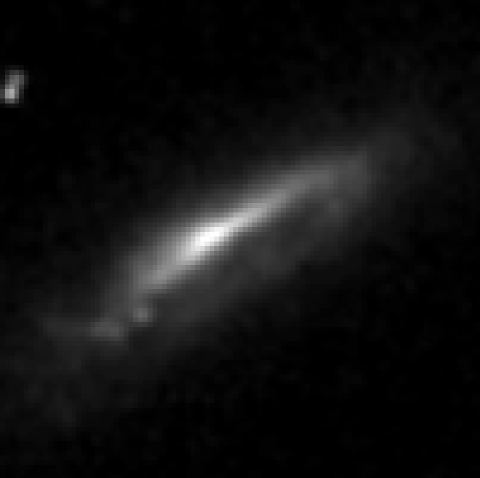
In the case of NGC 1511 it is interesting to compare the XMM-Newton images with others obtained in different wavebands. Especially a comparison of the OM image with H and 2 Micron All-Sky Survey (2MASS; Skrutskie 2001) near-infrared frames is useful. Both, the H frame by Lehnert & Heckman (1995) and the 2MASS J-H-Ks-band composite image are displayed in Fig. 4.
4.1 Extraplanar emission
The X-ray disk emission follows roughly that of H and radio continuum (Lehnert & Heckman 1995; Dahlem et al. 2001). In particular the correspondence between soft X-ray and radio emission is obvious. The axial ratio of both emission distributions is much smaller than that of the optically visible galaxy and there are two emission maxima in the disk, one near the centre and one in the south-eastern part of the disk. NGC 1511’s disk is disturbed and the disk plane not well-defined, as visible e.g. in the H by Lehnert & Heckman (1995). Also the NIR 2MASS images suggest disturbances of the stellar distribution. This makes it difficult to assess whether emission arises from inside or beyond the disk. Still, the soft X-ray emission to the north of the central region comes from an area beyond the optically visible galaxy, thus possibly from the halo. This corroborates our earlier finding (e.g. Dahlem 1997) that, once gaseous halos are detected around actively star-forming spirals, different phases of the ISM are present. H, radio continuum and diffuse soft X-ray emission (i.e., warm ionized gas, cosmic rays, magnetic fields and hot ionized gas) are found to be associated with each other, although not necessarily directly correlated.
4.2 Disturbances of NGC 1511
The H frame shows quite impressively how strong the starburst activity in NGC 1511 is and also how disturbed the galaxy is. This disturbance is most likely caused by its companions, NGC 1511a and NGC 1511b, which are observed at projected distances from NGC 1511 of 56.7 kpc and 38.7 kpc, respectively, with very small relative recession velocities of only 38(25) km s-1 with respect to NGC 1511. Using a high-contrast display of the corresponding red DSS-2 plate one can see a tidal tail connected to NGC 1511 (not visible in Fig. 1, because with such a grey-scale no contours could be seen), from the south-eastern end of the galaxy pointing roughly northwards, suggesting an ongoing tidal interaction.
The starburst nature of NGC 1511 is also corroborated by an updated radio spectral index calculation that we performed, using our earlier measurements (Dahlem et al. 2001), plus a 4.85 GHz measurement by Gregory et al. (1994) and an 843 MHz flux density measurement from the Sydney University Molonglo Sky Survey (SUMSS; Bock et al. 1999). mJy and mJy lead to a new, improved value of (), a value typical of actively star-forming galaxies (Condon 1992). This new value is, within the ample error bar of our earlier calculations, consistent with these. The Molonglo Telescope 843 MHz map (not displayed) also corroborates the emission distribution of our 1.43 GHz and 2.45 GHz maps (Dahlem et al. 2001) with a low major-to-minor axial ratio, indicating the presence of a synchrotron radio halo.
The 2MASS image suggests that NGC 1511’s appearance as a high-inclination ring system, as seen in the UV image in Fig. 3, might be caused not by such an emission distribution, but by absorption by a massive dust lane that is optically thick even in the NIR, creating a central emission depression.
This multi-wavelength approach demonstrates that NGC 1511 is a heavily disturbed starburst galaxy, which implies that it is not a good candidate for investigations of the dependence of its gaseous halos’ properties on the level and distribution of star formation in the underlying disk, for which one would prefer to study relatively undisturbed systems. Processes other than energy input from stellar sources (stellar winds and supernovae; see Leitherer & Heckman 1995) might influence the gas motions vertical to the disk, such as e.g. a gravitational potential modified by a tidal interaction with a companion galaxy. Still, NGC 1511 is one of a small number of starburst galaxies in which various components of the ISM are observed, within the same volume, above their disk planes. A significant contribution to the heating of its ISM from a hidden AGN can be excluded based on our X-ray data due to the absence of a hard central source, from optical spectra because of the absence of typical AGN emission lines and from our radio data, which also do not show any signatures of AGN activity at the centre.
4.3 Related observations
NGC 1511, amongst other objects, is also being observed by us in H I line emission with the Australia Telescope Compact Array to study the properties of its neutral atomic gas. This will lead to new information about the intrinsic absorbing gas distribution and its kinematics. It will, for example, also help to elucidate the issue whether the observed disturbances of NGC 1511’s disk can be explained by interactions with its companions, NGC 1511a and NGC 1511b.
XMM-Newton observations of several more nearby starburst galaxies, including NGC 1808, NGC 3628 and NGC 4666, have been conducted by us. These, together with data from the XMM-Newton archive, will be used to study systematically and in a self-consistent manner the soft X-ray emission properties of galaxies with kpc- to galaxy-scale outflows from their disks.
Acknowledgements: We thank Dr. M. Lehnert for making available to us his H and R-band images of NGC 1511 in digital form. This work is based on observations obtained with XMM-Newton, an ESA science mission with instruments and contributions directly funded by ESA Member States and the USA (NASA). This research has made use of the NASA/IPAC Infrared Science Archive, which is operated by the Jet Propulsion Laboratory, California Institute of Technology, under contract with the National Aeronautics and Space Administration. The Digitized Sky Surveys were produced at the Space Telescope Science Institute under U.S. Government grant NAG W-2166. The images of these surveys are based on photographic data obtained using the Oschin Schmidt Telescope on Palomar Mountain and the UK Schmidt Telescope. The plates were processed into the present compressed digital form with the permission of these institutions.
References
- (1) van den Bergh S. & Hazen M. L. 1988, PASP, 100, 1542
- (2) Bock D. C.-J., Large M. I. & Sadler E. M. 1999, AJ, 117, 1578
- (3) Condon J. J. 1992, ARA&A, 30, 575
- (4) Dahlem M. 1997, PASP, 109, 1298
- (5) Dahlem M., Lazendic J., Haynes R. F., Ehle M. & Lisenfeld U. 2001, A&A, 374, 42
- (6) Dahlem M., Lisenfeld U. & Golla G. 1995, ApJ, 444, 119
- (7) Dahlem M., Weaver K. A. & Heckman T. M. 1998, ApJS, 118, 401
- (8) Dettmar R.-J. 1992, Fund. Cosm. Phys., 15, 143
- (9) Dickey J. M. & Lockman F. J. 1990, ARAA, 28, 215
- (10) Foschini L., Di Cocco G., Ho L. C. et al. 2002, A&A, 392, 817
- (11) Gregory P. C., Vavasour J. D., Scott, W. K. & Condon J. J., 1994, ApJS, 90, 173
- (12) Heckman T. M. 2001, in “Gas and Galaxy Evolution”, ASP Conference Proceedings 240., J. E. Hibbard, M. Rupen, and J. H. van Gorkom (eds.), San Francisco, p. 345
- (13) Heckman T. M., Armus L. & Miley G. K. 1990, ApJS, 74, 833
- (14) den Herder J. W., Brinkman A. C., Kahn S. M. et al. 2001, A&A, 365, L7
- (15) Jansen F., Lumb D., Altieri B. et al. 2001, A&A, 365, L1
- (16) Kaaret P., Prestwich A. H., Zezas A. et al. 2001, MNRAS, 321, 29
- (17) Kaastra J. S. 1992, An X-ray Spectral Code for Optically Thin Plasmas, Internal SRON-Leiden Rep., updated version 2.0
- (18) Kewley L. J., Heisler C. A., Dopita M. A. & Lamsden S. 2001, ApJS, 132, 37
- (19) Leitherer C. & Heckman T. M. 1995, ApJS, 96, 9
- (20) Lehnert M. D. & Heckman T. M. 1995, ApJS, 97, 89
- (21) Mason K. O., Breeveld A., Much R. et al. 2001, A&A, 365, L36
- (22) Matsumoto H., Tsuru T. G., Koyama K. et al. 2001, ApJ, 547, L25
- (23) Mewe R., Gronenschild E. H. B. M. & van den Oord G. H. J. 1985, A&AS, 62, 197
- (24) Mewe R., Lemen J. R. & van den Oord G. H. J. 1986, A&AS, 65, 511
- (25) Pietsch W., Roberts T. P., Sako M. et al. 2001, A&A, 365, L174
- (26) Read A. M. & Ponman T. J. 2001, MNRAS, 328, 127
- (27) Read A. M., Ponman T. J. & Strickland D. K. 1997, MNRAS, 286, 626
- (28) Skrutskie M. F. 2001, AAS, 198, 3301
- (29) Strickland D. K., Colbert E. J. M., Heckman T. M. et al. 2001, ApJ, 560, 707
- (30) Strickland D. K., Heckman T. M., Weaver K. A. & Dahlem M. 2000, AJ, 120, 2965
- (31) Strickland D. K., Heckman T. M., Weaver K. A., Hoopes C. G. & Dahlem M. 2002, ApJ, 568, 689
- (32) Strüder L., Briel U., Dennerl K. et al. 2001, A&A, 365, L18
- (33) Turner M. J. L., Abbey A., Arnaud M. et al. 2001, A&A, 365, L27
- (34) Watson M. G., Auguères J.-L., Ballet J. et al. 2001, A&A, 365, L51
- (35) Weaver K. A., Heckman T. M. & Dahlem M. 2000, ApJ, 534, 684