The Role of Polycyclic Aromatic Hydrocarbons in Ultraviolet Extinction. I. Probing small molecular PAHs11affiliation: Based on observations made with the NASA/ESA Hubble Space Telescope, which is operated by the Association of Universities for Research in Astronomy, Inc., under NASA contract NAS 5-26555.
Abstract
We have obtained new STIS/HST spectra to search for structure in the ultraviolet interstellar extinction curve, with particular emphasis on a search for absorption features produced by polycyclic aromatic hydrocarbons (PAHs). The presence of these molecules in the interstellar medium has been postulated to explain the infrared emission features seen in the 3-13 m spectra of numerous sources. UV spectra are uniquely capable of identifying specific PAH molecules. We obtained high S/N UV spectra of stars which are significantly more reddened than those observed in previous studies. These data put limits on the role of small (30-50 carbon atoms) PAHs in UV extinction and call for further observations to probe the role of larger PAHs. PAHs are of importance because of their ubiquity and high abundance inferred from the infrared data and also because they may link the molecular and dust phases of the interstellar medium. A presence or absence of ultraviolet absorption bands due to PAHs could be a definitive test of this hypothesis. We should be able to detect a 20 Å wide feature down to a 3 limit of 0.02 AV. No such absorption features are seen other than the well-known 2175 Å bump.
1 Introduction
Because a large fraction of the photons passing through the interstellar medium (ISM) is absorbed and re-emitted in the infrared (IR), the intrinsic spectral energy distribution of reddened astrophysical objects (particularly in the ultraviolet) cannot be accurately determined without detailed knowledge of the absorbing medium. In particular, recent research suggests that ultraviolet (UV) extinction, particularly the rise toward shorter wavelengths, may be due to either very small grains or large molecules, or a combination of both. It is crucially important for studies of the chemistry and physics of the ISM to determine which it is.
While efforts have been made to study interstellar dust in various Galactic environments at wavelengths from the x-ray to the radio, a single line of sight is rarely subjected to observations over a wide wavelength range. This is particularly true for the UV and infrared regimes. In the UV, the amount of extinction due to dust rises rapidly toward shorter wavelengths and a moderate column density can easily lead to a paucity of photons. Consequently, the typical interstellar sightline used for UV studies has a small column of dust. These lines of sight probe the diffuse ISM and avoid all but the very outer edges of dark or molecular clouds. IR studies of dust, on the other hand, probe the dense regions of the ISM and concentrate on molecular bands of many different solid materials including mixed molecular ices, silicates and carbon grains associated with dense cloud environments. So, to a large extent, studies of interstellar dust in the UV and IR have been two “separate worlds.” Another important difference between the two is that UV and optical photons probe transitions between electronic levels and are uniquely capable of identifying specific atoms and molecules. IR photons, on the other hand, probe radiative transitions between states associated with molecular vibrations and are characteristic of functional molecular groups rather than specific molecules. The result of this dichotomy has been models of dust grains which are strongly biased toward fitting observations in one wavelength regime or the other. The absence of lines of sight for which both UV and IR data are available makes it difficult to reconcile the constraints derived separately from each wavelength regime.
Until fairly recently, the popular dust grain models were fairly simple, having two or three major grain components. The Mathis model consisted of power-law size distributions of separate populations of bare spherical silicate and graphite grains (Mathis, Rumpl, & Nordsieck 1977). The Greenberg model consisted of large grains with silicate cores surrounded by organic mantles and small carbonaceous grains, possibly polycyclic aromatic hydrocarbons (PAHs) 111We use the term PAH generically to describe the entire class that includes regular PAHs, ionized PAHs, dehydrogenated PAHS, PAHs with sidegroups, etc. (e.g., Greenberg 1989). This kind of simple model has been valuable and gives reasonable fits to the observed Milky Way dust extinction, polarization and spectral features, but empirical evidence indicates that interstellar grains are far more complex. Attempts are now being made to produce a unified model of interstellar dust to satisfy observational constraints across all wavelengths (Mathis 1996, 1998; Li & Greenberg 1997; Dwek 1997; Zubko 1999; Witt 2000). These much more complex and realistic models of interstellar dust are now possible through the use of improved observational constraints and the development of sophisticated (and efficient) numerical techniques. The abundance of each element available for grain formation provides important constraints (Sofia & Meyer 2001). Carbon is an important constituent in all major grain models and may be involved in some or all of the so-called unidentified infrared emission bands (UIBs) which are ascribed to PAHs, the diffuse interstellar absorption bands (DIBs), the near-IR emission continuum, the extended red emission (ERE), the 2175 Å absorption “bump”, and the continuous extinction in the visible and UV (Mathis 1998; Whittet 2003).
While the models cited above vary quite considerably in the grain types used, they all associate the production of the UIBs with PAHs. Over the past two decades, a combination of observational, laboratory and theoretical astrophysics has led to the suggestion that PAH molecules may be the carriers of the UIBs, which consist of a related series of emission features seen most strongly at wavelengths of 3.3, 6.8, 7.7, 8.6, and 11.3 m in the spectra of astronomical sources (Duley & Williams 1981; Puget & Léger 1989; Allamandola, Tielens, & Barker 1989). However, critical uncertainties remain regarding the amount of carbon needed: PAHs are estimated to require from 5% to almost 20% of the available carbon in the ISM (Boulanger et al. 1998; Tielens et al. 1999). Some grain models also suggest that PAHs are at least partially responsible for the 2175 Å bump and the far-UV extinction (Li & Greenberg 1997). These claims are driven in part by laboratory measurements which show that some PAHs absorb heavily at far-UV wavelengths, and some even show absorption bands near the position of the 2175 Å bump (Salama et al. 1996, Salama 1999). However, it is not likely that PAHs alone could produce the bump. The strength of the bump is not well correlated with the far-UV extinction strength, so neither PAHs nor any other single grain-type can be used to completely explain both extinction components (Mathis & Cardelli 1992).
Observations indicate that the carriers of the IR bands must be a ubiquitous and abundant component of the interstellar medium. The bands have been observed in a large variety of sources - the diffuse ISM, H II regions, reflection nebulae, planetary nebulae, and galactic nuclei - all characterized by the presence of dust and ultraviolet radiation (e.g., Tielens 1993; Mattila et al. 1996; Onaka et al. 1996; Schutte et al. 1998). PAH emission is most often associated with photo-dissociation regions (PDRs) which are characterized by fairly high densities and intense UV radiation fields. Such densities are often significantly higher than those seen along most of the diffuse ISM sightlines studied in the UV. Two exceptions are the reflection nebulae, NGC 2023 and NGC 7023. The central stars of these nebulae have moderate reddening (E(B-V)=0.4-0.5 mag) and have been studied with IUE. Here, PAH emission is seen primarily in filaments in these nebulae where there are density enhancements. No unusual structure is seen in the IUE UV extinction curves of the central stars (HD 37903 and HD 200775; Fitzpatrick & Massa 1990; Walker et al. 1980). However, the S/N in IUE data is not very high and, as we describe below, the predicted UV PAH band strengths are small for these values of E(B-V). Other attempts to detect and identify absorption features in the UV are detailed in Tripp, Cardelli, & Savage (1994). Successful detection of the UV electronic transitions would allow for the identification of specific species, something that is not possible through observations of the IR vibrational transitions, which probe only the presence of particular molecular bonding arrangements (e.g., aromatic vs. aliphatic hydrocarbons).
2 Observations and Analysis
We selected reddened stars whose dust columns are significantly higher than those of previous UV studies. Specifically, we observed three reddened stars, listed in Table 1, having E(B-V) between 1.3 and 1.7 mag. All three of these sightlines pass through relatively dense clouds; two, HD 194279 and HD 229059, in the Cyg OB2 cloud and one, HD 283809, in the Taurus dark cloud. They all show evidence for the 3.4 µm feature in absorption (Smith, Sellgren, & Brooke 1993; Pendleton et al. 1994; Gordon et al. 2003). The 3.4 µm feature is associated with a C-H stretching vibration in aliphatic hydrocarbons that are believed to be part of organic refractory grains made of aromatic and aliphatic units (Pendleton & Allamandola 2002). Relatively unreddened stars with spectral types well-matched to the reddened stars were also observed. The unreddened standards were selected to match the reddened stars to within one half of a spectral subtype (B1.5 versus B1). This minimizes the noise due to mismatch between the stellar features of the reddened and unreddened stars. There was some difficulty in finding lightly reddened stars of matching spectral types that were faint enough to observe with STIS without saturating the detector. For instance, we were forced to choose HD 151805 even though it has a significant reddening.
The five stars in this program were all observed with STIS/HST and the MAMA detectors with both the G140L (1150-1730 Å) and G230L (1570-3180 Å) gratings. These low resolution gratings provide two-pixel resolutions of 1.2 Å (G140L) and 3.2 Å (G230L). The observation dates, exposure times and apertures used are listed in Table 1 for each of the five stars. HD 283809 and HD 229059 were observed through the 52x2 slit and the data were reduced using the On-The-Fly calibration. However, the count rates for the other three stars required that a neutral-density slit be used. Neutral-density-slit modes are unsupported but good calibrations were possible using observations of the white dwarf, GD 153, made through both the standard slit (52x2) and the neutral-density slits (31x0.05NDB, 31x0.05NDC), which were available in the MAST archive. The GD 153 observations are also listed in Table 1. The conversions between the neutral-density slits and the standard slit were derived by dividing the 52x2 aperture spectrum by 31x0.05NDB and 31x0.05NDC spectra of GD 153. The ratio spectra were smoothed with a 31-pixel-width boxcar. These ratio spectra were essentially flat with smooth variations across the wavelength range of around 25%. These smoothed spectra were used to convert the measured counts for the neutral-density aperture observations to calibrated spectra.
The calibrated G140L and G230L spectra were coadded using weights defined by the pipeline-produced uncertainties to produce a single spectrum for each star. Extinction curves were constructed using the standard pair method (e.g., Massa, Savage, & Fitzpatrick 1983). The estimated uncertainties in the extinction curve contain terms that depend on the broadband photometric uncertainties as well as uncertainties in the STIS fluxes. For details of our error analysis, the reader is referred to Gordon & Clayton (1998). The uncertainty term which most affects our ability to search for new structure in extinction curves is that due to random uncertainties in the flux measurements. Uncertainty terms which affect the overall level of the extinction curve (e.g., B and V magnitude uncertainties) do not mask the presence of structure.
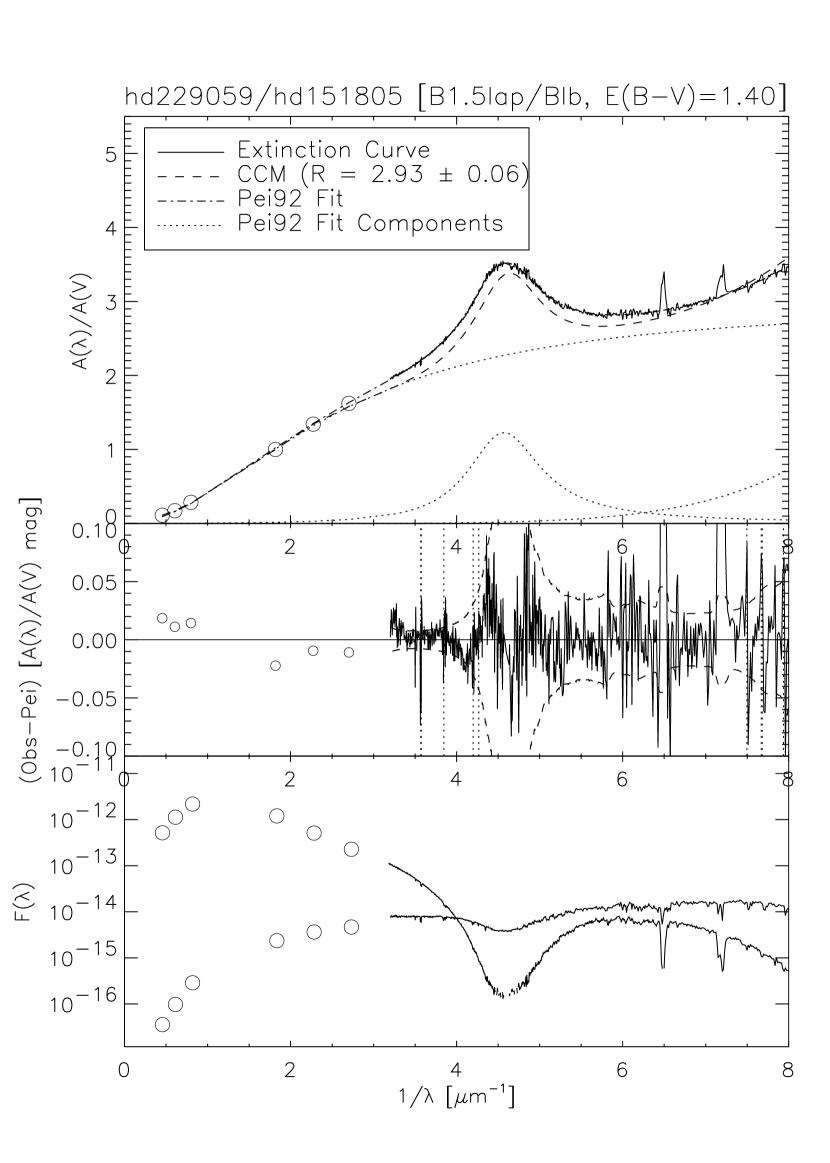
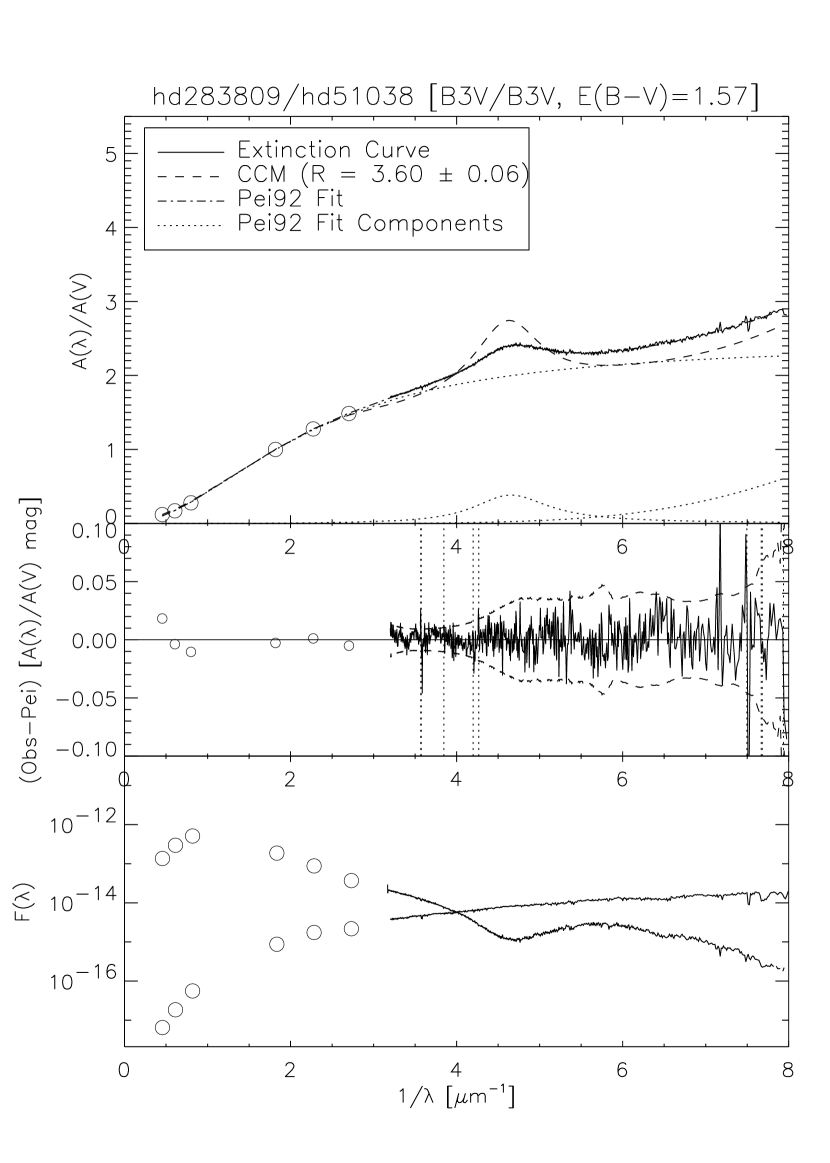
The extinction curves for the reddened/comparison star pairs, HD 229059/HD 151805 and HD 283809/HD 51038, are shown in the upper panels of Figures 1 and 2, respectively. We have not shown the extinction curve for the HD 194279/HD 151805 pair as it suffers from significant spectral mismatch (mainly luminosity mismatch). This results in an extinction curve dominated by mismatches in stellar lines which is unsuitable for our purposes. Therefore, the HD 194279 sightline is not included in the discussion below. The STIS/HST spectra of the stars are plotted in the lower panels of Figures 1 and 2 for HD 229059/HD 151805 and HD 283809/HD 51038, respectively.
In order to look for new structure in the extinction curves, we made fits to the full UV through near-IR extinction curves. These fits included the known structures of the 2175 Å bump and far-UV rise. The most commonly used fit to UV extinction curves is the Fitzpatrick & Massa (1990) parameterization. However, the Fitzpatrick & Massa fitting function is not valid to the red of 2700 Å (Fitzpatrick 2002, personal communication). Therefore, we adopted a function similar to that of eq. 20 of Pei (1992). This fitting function covers the entire range from X-ray to far-IR wavelengths and consists of 6 terms with a total of 19 free parameters. Restricting the function to just the near-IR to UV wavelength range reduces the fit to 3 terms (Background, Far-UV, and 2175 Å terms) with 9 free parameters. Pei (1992) used this function to fit, by eye, the average extinction curves in the Milky Way and Magellanic Clouds and found it to be accurate to . We used a numerical curve fitting routine in IDL (mpfitfun) to determine the 9 free parameters and find that the fitting function can reproduce the broad structure of the extinction curve quite accurately.
The fits were subtracted from the measured extinction curves and the resulting residuals are plotted in the middle panel of Figures 1 and 2. The uncertainties which limit our ability to detect new extinction curve structure are those associated with random uncertainties in the ultraviolet flux measurements and, to a lesser extent, spectral mismatch uncertainties. The random uncertainties are plotted in the middle panel of Figures 1 and 2. The uncertainties associated with spectral mismatches will occur at specific wavelengths (coincident with known stellar lines) and must be evaluated on a case-by-case basis.
The residuals were examined for previously unseen features above the uncertainties. A positive feature in the residuals would signify excess absorption. In the HD 229059 extinction curve, there are significant residuals at approximately 4.6, 6.5, and 7.2 . The 4.6 residual is at the center of the 2175 Å bump and is due to the absence of stellar flux in the middle of the 2175 Å feature where the absorption is strongest (see Figure 1 bottom panel). The resulting large uncertainties in the extinction curve for HD 229059 cause the bump fit parameters to be less certain. The oscillations seen in the residuals from 4 to 5 for this extinction curve are caused by the uncertain bump fit parameters. The 6.5 and 7.2 residuals are due to known stellar lines, C IV and Si IV, which are difficult to match exactly for supergiants (Cardelli, Sembach, & Mathis 1992). In the HD 283809 extinction curve, there is a residual feature at approximately 6.5 . This apparent feature is caused by a luminosity mismatch (Massa et al. 1983) . Well-known interstellar absorption lines such as Mg II 2798, 2803, Fe II 2344, 2382, 2600, C II 1334, O I 1302 and Si II 1260, 1304 are clearly present in the spectra of the reddened stars. These lines cause narrow mismatch features between the reddened and unreddened stars. Thus, we do not find any new features in the extinction curves of HD 229059 or HD 283809 at a 3 limit of . See further quantification below.
3 Discussion
The intensity ratios in the UIB emission imply that PAH molecules with 20-200 C atoms are responsible for most of the emission from the ISM (Allamandola et al. 1989; Schutte, Tielens & Allamandola 1993, Salama et al. 1996; Allain, Leach, & Sedlmayr 1996a,b). More recent modeling work, which had the benefit of having a much more extensive ISO data base available for comparison, also suggests minimum numbers of carbon atoms in PAH molecules of order 20 - 30 (Verstraete et al. 2001; Pech, Joblin & Boissel 2002; Peeters et al. 2002). Indeed, comparing the astronomical spectra with the laboratory spectra of mixtures of larger PAHs seems to do somewhat better. The detection of the IR bands in reflection nebulae, where the starlight energy densities are quite insufficient to produce equilibrium thermal emission, has led to the point of view that they are excited in a fluorescence process (Allamandola & Norman 1978; Allamandola, Greenberg, & Norman 1979; Sellgren 1984, Li & Draine 2002). Under the PAH hypothesis, the fluorescence is induced by the absorption of UV and visible photons, with the IR emission features being produced by vibrational relaxation of the excited molecule. PAH molecules and ions have absorption bands that span the UV-visible and near-IR ranges (e.g., Chillier et al. 1999).
The photodestruction of PAHs under interstellar conditions has been modeled (Jochims et al. 1994; Allain et al. 1996a,b; LePage, Snow, & Bierbaum 2003). The first group find a critical size in the range of 30 - 40 carbon atoms, below which PAHs are likely being destroyed. The second group concludes that the critical size is more likely around 50 atoms. LePage et al. (2003) suggest that PAHs with fewer than 15-20 atoms are mostly destroyed, those with 20-30 atoms are dehydrogenated, and larger PAHs are largely ionized. The apparent scarcity of small PAHs in the ISM is supported by the absence of any detection of dust luminescence associated with neutral PAHs shortward of 5400 Å in the spectra of reflection nebulae, which are known sources of UIB emission (Donn et al. 1989; Rush & Witt 1975). Other studies have suggested dominance by both neutral and ionic species in the ISM (Salama et al. 1996; Weingartner & Draine 2001).
UV absorption spectra of isolated PAH species at the low temperatures characteristic of the ISM have been obtained in the laboratory for PAHs ranging from naphthalene () up to dicoronene () (e.g., Salama, Joblin & Allamandola 1995; Salama et al. 1996; Chillier et al. 1999; Salama 1999; Ruiterkamp et al. 2002). These data constitute a representative dataset for the UV and visible spectra of PAHs. Figure 3 shows selected examples.
Earlier attempts to detect such features with IUE and Copernicus failed because the S/N was too low in the stellar spectra and the dust column was too small (Snow, York, & Resnick 1977; Seab & Snow 1985). The accuracy of the residuals of the two extinction curves plotted in A()/AV space in Figures 1 and 2, is inversely proportional to the amount of extinction and also depends on the quality of the spectral-type match. Of the two residual curves, HD 283809 has the best combination of high reddening and good spectral match. The residual curve for HD 229059 is not as smooth, but is good enough to put a similar limit on broad features. For narrow (a few Å, near the resolution limit of our data) stellar photopheric-type lines, the 3 limit is 0.03-0.04 AV. Laboratory spectra show that PAH features are considerably broader than our resolution. The detectability of a feature rises as it becomes broader, the detection limit goes down as the square root of the width of the feature. For example, we should be able to detect a 20 Å wide feature222 Recent gas-phase data indicate that PAH bands are broadened by a factor of 4 -5 in solid matrices (Biennier et al. 2003). down to a 3 limit of 0.02 AV. Looking at Figures 1 and 2, clearly, there are no broad PAH-like features with depths greater than 0.02 AV.
From this we can estimate the upper limit on the abundance of a PAH molecule. The absorption cross-section of the naphthalene molecule averaged over the strong 2120 Å band is about 4 x 10-16 cm2. The strong bands of the other PAH species have comparable strengths. We assume the average Galactic gas-to-dust ratio, NH/E(B-V) = 5.8 x 10²¹ atoms cm-2 mag-1 (Bohlin, Savage, & Drake 1978). So with AV = N/5.8 x 1021 mag, and taking 2.5 x 10⁻¹⁶ cm2 as a typical band strength, we find that the average optical depth in a strong PAH band would be: = 2.5 x 10⁻¹⁶(N(PAH)/N(H))(AV/RV)5.8 x 1021. The upper limit on our detection is (1.086)0.02AV so N(PAH)/NH (1.086) 0.02RV /((2.5 x 10-16)(5.8 x 10²¹)) = 4.6 x 10⁻⁸(RV/3.1). We assume here for simplicity that NH/E(B-V) is a constant for all RV (see Kim & Martin 1996).
The abundance of a single species of PAH could be given by N(single species of PAH)/NH =(the Cosmic carbon abundance, C/H) x (the fraction of C in all PAHs) x (the fraction of C in all PAHs in a single PAH species)/(the number of C atoms in this PAH molecule). The cosmic abundance of carbon is not well known (e.g., Sofia & Meyer 2001; Prieto, Lambert & Asplund 2002). We will assume C/H = 3 x 10⁻⁴. As discussed above, it has been estimated that 5 - 20% of the carbon is in the form of PAHs, and that PAHs with 20 - 200 C atoms best fit the UIB emission. So, using these ranges, assuming that the fraction of this one PAH species is 0.10, that the fraction of available C in PAHs is 0.05, and the number of C atoms in the PAH species is 20 then N(single species of PAH)/NH = 7.5 x 10⁻⁸. For a larger PAH species of 200 C atoms, we get N(single species of PAH)/NH = 7.5 x 10⁻⁹. For a fraction of available C in all PAHs of 0.20, we get N(single species of PAH)/NH = 3.0 x 10⁻⁷ for a 20-atom PAH species and 3.0 x 10⁻⁸ for a 200-atom species, respectively. ¿From these estimates, we would expect that 20-atom PAH species should be above our detection limit, while 200-atom species would only be detectable if they are very abundant.
The predicted UV spectral signatures of PAHs while weaker than the well-known 2175 Å absorption feature, nevertheless, were expected to be much stronger in the highly reddened sightlines of our sample than in those previously studied. However, individual PAH molecules whose absorption cross-sections are typical of those measured in the laboratory do not seem to be present in numbers large enough to produce measurable UV absorption bands. As described above, PAHs with fewer than 30-50 carbon atoms, thought to have strong UV absorptions, may be destroyed by the ambient interstellar radiation field. Another possibility is that many PAH species are present in small numbers each producing a small amount of absorption throughout the UV wavelength range, i.e., the absence of detectable PAH absorption does not, in and of itself, prove an absence of PAH molecules in the ISM. There is nothing known about the sightlines toward the Taurus cloud (HD 283809) or Cyg OB2 (HD 229059) that would imply that the abundance of PAH molecules would be low along these sightlines. The UIB emission seems to be ubiquitous in the Galaxy, even being present in the diffuse ISM (e.g., Chan et al. 2001).
These new STIS data provide a critical test of the PAH model. The results of this study serve to put upper limits on the abundance of individual PAH species in the ISM. They provide, in particular, constraints on the abundance of smaller PAHs (i.e., containing fewer than 30-50 carbon atoms) in these lines of sight. They also call for higher S/N observations (at the level or better) in the UV to search for absorption associated with larger molecular PAHs that are now thought to be representative of the interstellar PAH population.
This work was supported by STScI grant GO-08670.01-A.
References
- (1)
- (2) Allain, T., Leach, S., & Sedlmayr, E. 1996a, A&A, 305, 602
- (3) Allain, T., Leach, S., & Sedlmayr, E. 1996b, A&A, 305, 616
- (4) Allamandola, L. J., Greenberg, J.M, & Norman, C.A. 1979, A&A, 77, 66
- (5) Allamandola, L. J., & Norman, C.A. 1978, A&A, 66, 129
- (6) Allamandola, L. J., Tielens, A. G. G. M., & Barker, J. R. 1989, ApJS 71, 733
- (7) Biennier, L., Salama, F., Allamandola, L., Scherer, J. 2003, J. Chem. Phys., in press
- (8) Bohlin, R.C., Savage, B.D., & Drake, J.F. 1978, ApJ, 224, 132
- (9) Boulanger, F., Boissel, P., Cesarki, D., & Ryter, C. 1998, A&A, 339, 194
- (10) Cardelli, J. A., Clayton, G. C., & Mathis 1989, ApJ, 345, 245
- (11) Cardelli, J.A., Sembach, K.R., & Mathis, J.S. 1992, AJ, 104, 1916
- (12) Chan, K.-W. et al. 2001, ApJ, 546, 273
- (13) Chillier, X. D. F., Stone, B.M., Salama, F., & Allamandola, L.J. 1999, J. Chem. Phys., 111, 449
- (14) Cutri, R.M., et al. 2000, 2MASS Second Incremental Release Point Source Catalog
- (15) Donn, B.D., Allen, J.E., & Khanna, R.K. 1989, in Interstellar Dust, eds. L.J. Allamandola and A.G.G.M. Tielens, Kluwer Academic Publishers, p. 181
- (16) Du, P., Salama, F., & Lowe, G.H. 1993, J. Chem. Phys., 173, 421
- (17) Duley, W.W., & Williams, D.A. 1981, MNRAS, 196, 269
- (18) Dwek 1997, ApJ, 484, 779
- (19) Fitzpatrick, E.L, & Massa, D. 1990, ApJS, 72, 163
- (20) Gordon, K. D., & Clayton, G. C. 1998, ApJ, 500, 816
- (21) Gordon, K. D.,et al. 2003, in preparation
- (22) Greenberg, J.M. 1989, in IAU Symp. No. 135, 345
- (23) Jochims, H.W., Ruehl, E., Baumgaertel, H., Tobita, S.,& Leach, S. 1994, ApJ, 420, 307
- (24) Kim, S.-H. & Martin, P. G. 1996, ApJ, 462, 296
- (25) Leitherer, C. & Wolf, B. 1984, A&A, 132, 151
- (26) LePage, V., Snow, T.P., & Bierbaum, V.M. 2003, ApJ, in press
- (27) Li, A. & Draine, B.T. 2002, ApJ, 572, L232
- (28)
- (29) Li, A. & Greenberg, J.M. 1997, A&A, 323, 566
- (30) Massa, D., Savage, B. D., & Fitzpatrick, E. L. 1983, ApJ, 266, 662
- (31) Mathis, J. S. 1996, ApJ, 472, 643
- (32) Mathis, J. S. 1998, ApJ, 497, 824
- (33) Mathis, J. S., & Cardelli, J.A. 1992, ApJ, 398, 610
- (34) Mathis, J. S., Rumpl, W., & Nordsieck, K.H. 1977, ApJ, 217, 425
- (35) Mattila, K., Lemke, D., Haikala, L. K., Laureijs, R. J., Léger, A., Lehtinen, K., Leinert, C., & Mezger, P. G. 1996, A&A, 315, L353
- (36) Onaka, T., Yamamura, I., Tanabe, T., Roellig, T.L., Yuen, L. 1996, PASJ, 48, L59
- (37) Peaden, P.A., Lee, K.L., Hirata, Y., & Novotny, M. 1980, Anal. Chem. 52, 2268
- (38) Pech, C., Joblin C., & Boissel, P. 2002, A&A, 388, 639
- (39) Peeters, E., Hony, S., Van Kerckhoven, C., Tielens, A.G.G.M., Allamandola, L.J., Hudgins, D.M., & Bauschlicher, C.W. 2002, A&A, 390, 1089
- (40) Pei, Y. C. 1992, ApJ, 395, 130
- (41) Pendleton,Y.J. & Allamandola, L. J. 2002, ApJS, 138, 75
- (42) Pendleton, Y.J., Sandford, S. A., Allamandola, L. J., Tielens, A. G. G. M., & Sellgren, K. 1994, ApJ, 437, 683
- (43) Puget, J., & Léger, A. 1989, ARA&A, 27, 161
- (44) Ruiterkamp. R., Halasinski T., Salama, F., Foing, B. H., Schmidt, W., & Ehrenfreund, P. 2002, A&A, 390, 1153
- (45) Rush, W.F., & Witt, A.N. 1975, AJ, 80, 31
- (46) Salama, F. 1999, in Solid Interstellar Matter: The ISO Revolution, 458, ed. L. d’Hendecourt, C. Joblin, & A. Jones, EDP Sciences, Springer-Verlag, Les Ulis, p. 65
- (47) Salama, F., Bakes, E. L. O., Allamandola, L. J., & Tielens, A. G. G. M. 1996, ApJ, 458, 621
- (48) Salama, F., Joblin, C., & Allamandola, L. J. 1995, Planet. Space Sci., 43, 1165
- (49) Schutte, W.A. et al. 1998, A&A, 337, 261
- (50) Schutte, W.A., Tielens, A.G.G.M., & Allamandola, L.J. 1993, ApJ, 415, 397
- (51) Seab, C. G., & Snow, T. P. 1985, ApJ, 295, 485
- (52) Sellgren, K., 1984, Ap.J., 277, 623
- (53) Smith, R.G., Sellgren, K., & Brooke, T.Y. 1993, MNRAS, 263, 749
- (54) Snow, T. P., York, D. G., & Resnick, M. 1977, PASP, 89, 758
- (55) Sofia, U.J., & Meyer, D.M. 2001, ApJ, 558, L147
- (56) Tielens, A. G. G. M. 1993, in Dust and Chemistry in Astronomy, p. 103
- (57) Tielens, A. G. G. M., Hony, S., Van Kerckhoven, C., & Peeters, E. 1999, ESA SP-427, 579
- (58) Tripp, T.M., Cardelli, J.A., & Savage, B.D. 1994, AJ, 107, 645
- (59) Verstraete, L., Pech, C., Moutou, C., Sellgren, K., Wright, C. M., Giard, M., Léger, A., Timmermann, R., & Drapatz, S. 2001, A&A, 372, 981
- (60) Walker, G.A.H., Yang, S., Witt, A.N., & Fahlman, G.G. 1980, PASP, 92, 411
- (61) Whittet, D.C.B. 2003, Dust in the Galactic Environment, 2nd Ed. (IOP: Bristol)
- (62) Witt, A.N. 2000, in Astrochemistry: From Molecular Clouds to Planetary Systems, IAU Symp. No. 197, eds. Y.C. Minh & E.F. van Dishoeck, p. 317
- (63) Zubko, V.G. 1999, ApJ, 513, L29
| Star | Sp.T. | E(B-V) | Obs. date (UT) | Grating | Exposure (s) | Aperture |
|---|---|---|---|---|---|---|
| HD 194279 | B1.5Ia | 1.22 | 2001 April 22 | G140L | 850 | 31x0.05NDB |
| 2001 April 22 | G230L | 757 | 31x0.05NDB | |||
| HD 229059 | B1.5Ia | 1.73 | 2001 April 18 | G140L | 5318 | 52x2 |
| 2001 April 21 | G230L | 5311 | 52x2 | |||
| HD 283809 | B3V | 1.62 | 2000 December 8 | G140L | 5194 | 52x2 |
| 2000 December 9 | G230L | 5187 | 52x2 | |||
| HD 51038 | B3V | 0.05 | 2001 February 2 | G140L | 800 | 31x0.05NDC |
| 2001 February 2 | G230L | 714 | 31x0.05NDC | |||
| HD 151805 | B1Ia | 0.33 | 2001 April 3 | G140L | 850 | 31x0.05NDB |
| 2001 April 3 | G230L | 757 | 31x0.05NDB | |||
| GD 153aaThe observations of GD 153 were used to calibrate the STIS neutral density filters. | WD | 1997 July 13 | G140L | 187 | 52x2 | |
| 1997 July 13 | G230L | 187 | 52x2 | |||
| 1997 July 13 | G140L | 187 | 31x0.05NDB | |||
| 1997 July 13 | G230L | 279 | 31x0.05NDB | |||
| 1997 July 13 | G140L | 437 | 31x0.05NDC | |||
| 1997 July 13 | G230L | 714 | 31x0.05NDC |