An S2 Fluorescence Model for Interpreting High-Resolution Cometary Spectra. I. Model Description and Initial Results.
Abstract
A new versatile model providing S2 fluorescence spectrum as a function of time is developed with the aim of interpreting high resolution cometary spectra. For the S2 molecule, it is important to take into account both chemical and dynamic processes because S2 has a short lifetime and is confined in the inner coma where these processes are most important. The combination of the fluorescence model with a global coma model allows for the comparison with observations of column densities taken through an aperture and for the analysis of S2 fluorescence in different parts of the coma. Moreover, the model includes the rotational structure of the molecule. Such a model is needed for interpreting recent high spectral resolution observations of cometary S2. A systematic study of the vibrational-rotational spectrum of S2 is undertaken, including relevant effects, such as non-equilibrium state superposition and the number density profile within the coma due to dynamics and chemistry, to investigate the importance of the above effects on the scale length and abundance of S2 in comets.
1 Introduction
Although comets hold important clues to the formation of the solar system, there is no complete picture of where comets formed (Mumma al., 2000; Irvine et al., 2000). The mixing ratio of the minor constituents of frozen gases in the ice-dust conglomerate of the nucleus is a very important clue to the original composition of the frozen gases in the solar nebula, but it is not well understood. A detailed and comprehensive description of production of minor species, such as S2, and their sources, and the inner coma chemistry are prerequisites for unambigous characterization of the nucleus. Understanding comets, in turn, yields insights into the origin of the solar system.
Several sulfur species have been detected in comets, including S2 which has a short lifetime and is concentrated in the innermost coma. The proximity of Comet IRAS-Araki-Alcock 1983d (A’Hearn et al., 1983a) and Comet Hyakutake C/1996 B2 (Weaver et al., 1996; Laffont et al., 1998) to the Earth favored the detection of emission lines of such a short-lived species. Recently, S2 has been detected in Comet Lee C/1999 H1 (Feldman et al., 1999).
Up to now pure vibrational models were used to analyse these data. Kim et al. (1990), using a multicycle fluorescence model, derived an abundance of 2.5 relative to water in International Ultraviolet Explorer (IUE) spectra of Comet IRAS-Araki-Alcock. The model developed by Laffont et al. (1998) shows that there is a fast evolution of S2 fluorescence spectra with the age of the molecule as it undergoes the solar radiation and consequently with the distance to the nucleus. On the basis of this model, it was possible to retrieve an upper limit to the abundance of 10-4 relative to water from IUE observations of Comet Hyakutake which is consistent with the abundance derived from HST observations a few days later (Weaver et al., 1996; A’Hearn et al., 1999). The abundance of S2 in Comet Lee is 3-5 relative to water (Feldman et al., 1999).
Having applied a time-dependent model of the vibrational population of S2 to the fullest extent, it appeared that a more extensive model including the rovibrational structure of S2 was needed to provide additional clues about the physical and chemical nature of the inner coma of comets, especially since high spectral and spatial resolution cometary spectra containing S2 exist now. In this paper, we decribe such a model suitable for interpreting high resolution spectra of S2 and we combine the resulting spectra with a global coma model based on gas dynamics and chemistry. This is important for cometary applications and make it possible to follow the time evolution of S2 fluorescence in the inner coma.
Section 2.1 describes the model and presents our method of calculation. Synthetic S2 spectra at various age of the molecule are presented in section 3.1. In section 3.2, we compare this model with the pure vibrational model and point out important consequences of using a pure vibational model for analysing spectra of even moderate resolution. We apply our model to such observations, the IUE spectra of Comat IRAS-Araki-Alcock in which S2 was first detected and discuss the effects on the abundance and lifetime determination. In section 3.3, we explore the possible applications of this model for cometary observations, both with high spatial and spectral resolution. Finally, we summarize our conclusions and give directions for futur model enhancements in section 4.
2 Model Description
2.1 Time-Dependent Fluorescence Model
The - system of S2 has been analysed in detail in the laboratory (see, e.g. Ikenoue (1960); Heaven et al. (1984); Matsumi et al. (1984); Smith & Hopkins (1981)) but, up to now, there is no complete model of S2 rovibrational fluorescence. Previous models only took into acount the vibrational levels of the molecule. Kim et al. (1990) used a multi-cycle fluorescence approach whereas our previous model (Boice & Laffont, 1997; Laffont et al., 1998) gave the fluorescence spectrum at any time after the release of the molecule from the nucleus. This time-dependent method is quantitatively different from the multi-cycle fluorescence approach. At no time do we assume that a given level is in steady state. This allows us to calculate the spectrum of the molecule at any moment. The period of time elapsed since the molecule release can be very short, of the order of microseconds, or very long, up to the point where steady state is reached. An immediate difference is noted between our results and those of Kim et al. (1990). They argue that the “first-cycle” spectrum is achieved only after about 100 s but we find that this spectrum is obtained after a few seconds.
We now have enhanced our time-dependent model by considering the rotational levels. We calculate synthetic fluorescence spectra of the - system of S2 by solving the evolution equation of the population of the rovibrational levels as a function of time:
| (1) |
where is the transition probability between levels and . may be either in emission or in absorption. Stimulated emission was considered and found to be negligible. The Einstein coefficients and were calculated using the Franck-Condon factors from Anderson et al. (1979), the absolute lifetimes from Quick & Weston (1981), and the solar irradiance from A’Hearn et al. (1983b). The Hönl-London factors for - transitions are derived from Herzberg (1989) formulae. There is no Q-branch for such transitions. In addition to the main branches P and R, satellite branches can also appear with appreciable strength (Tatum & Watson, 1971; Meyer & Crosley, 1973). At the moment, we did not consider satellite branches in our calculations, but we are aware that this may cause discrepencies with observations at high spectral resolution.
The model was constructed to include a general source (sink) term, , for taking into account processes such as collisional excitation (deexcitation). An estimate of the role of collisions shows that they are likely to be important very close to the nucleus. At a distance of 3 km above the nucleus surface, the number density of water (the dominant gas) is roughly cm-3. This results in a collision frequency of 350 s-1, assuming a collisional cross section of cm-2. Collisional processes may dominate the excitation in this region. At a distance of 400 km which is the approximate range of the observed S2 emissions, the collision frequency is reduced to 8 s-1, but still comparable to the excitation rate by the solar radiation. The observed S2 intensity integrated along the line of sight will contain a contribution from the region near to the nucleus where collisions may be very important and a contribution from further out where collisions may also influence the emission process, but in a more moderate way. The relative weight of these two types of contributions will require a detailed investigation beyond the scope of the present study. It should be kept in mind that collision rates of S2 with other molecules are unknown at the low temperatures typical of the coma. Additional uncertainty in the model parameters would be introduced in order to include these collisional effects. Since the primary aim of this study is to calculate high-resolution, ro-vibrational synthetic spectra excited by solar fluorescence, collisional processes are outside the scope of these calculations. In a subsequent study, collisional processes will be investigated within the framework of the model outlined above.
We calculated the lines positions using the molecular constants for the and electronic states of S2 listed by Herzberg (1989). Molecular constants obtained from observations (Ikenoue, 1960) give no significant difference. We took into account the Swings effect due to the heliocentric velocity of the comet. The initial distribution is obtained with a Boltzmann temperature of 200 K, which is a typical temperature of the expanding gas at the surface of the nucleus, predicted by coma models (Boice & Benkhoff, 1996).
The model S2 molecule contains 34 vibrational levels in the electronic ground state and 10 in the excited state . The molecule predissociates above this level (Ricks & Barrow, 1969). We considered hundred rotational levels within each vibrational level. Since deexcitations due to collisions have been neglected, no constraints are imposed on the rotational temperature. We decided to use a large number of rotational levels even though the higher ones are not effectively populated. The nuclear spin of S2 being equal to zero, the anti-symmetric levels are not populated. Given the selection rules, we considered more than 2000 rovibrational levels. The problem is to solve the large number of rate equations in the coupled network of ordinary differential equations, subject to the constraint of a conservation equation. Therefore, the problem is overdetermined and one of the equations is redundant. In practice, we solve the complete set of equations and use the conservation equation to check the accuracy of the solution. The system is solved using the Gear method (Gear, 1971) for stiff differential equations where time constants vary by many orders of magnitude. This method uses variable time steps and error control techniques to preserve accuracy during the integration. Global linear invariants are found to be kept constant approximately to machine accuracy.
2.2 Coma Chemistry Model
We have developed a global model for the reactive multifluid gas flow in the coma, including gas release from the nucleus, the relationship of chemical abundances in the coma to those in the nucleus ices (depending on heliocentric distance of the comet), entrainment of dust by escaping coma gases, and fragmenation and evaporation of dust (distributed coma sources) (Huebner, 1991; Boice et al., 1995). The model solves the fluid dynamic equations for the mass, momentum, and energy for three neutral fluids (atomic and molecular hydrogen and the heavier bulk fluid.), and the elctrons. In the inner coma, the gas expands, cools, accelerates, and undergoes a plethora of photolytic (with optical depths effects) and gas-phase chemical reactions that transform the dozen or so parent molecules into hundreds of daughter species. Beyond the collision region, the multifluid gas flow for fast atomic hydrogen, fast molecular hydrogen, electrons, and the bulk of the coma gas undergoes a transition from fluid dynamic flow to free molecular flow.
The model produces cometocentric abundances of the coma gas species; velocities of the bulk gas, light atomic and molecular hydrogen with escape, and electrons; gas and electrons temperatures; column densities to facilitate comparison with observations, coma energy budget quantities; attenuation of the solar irradiance; and other quantities that can be related readily to observations. Model results are integrated in the line of sight for direct comparison with observations.
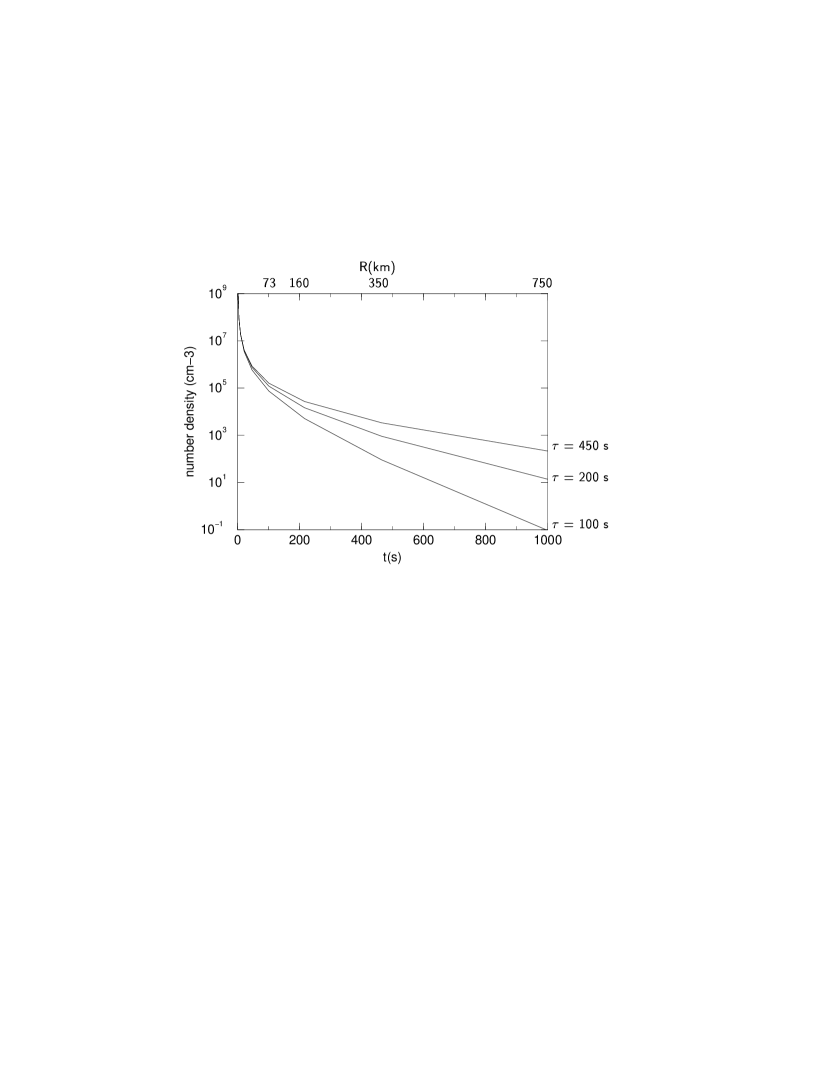
Several mechanisms have been proposed to explain the presence of S2 in the coma of comets (Vanysek, 1993; Saxena & Misra, 1995; A’Hearn et al., 2000). For our initial model we assume the simplest possible case: direct release of S2 from the nucleus with a production rate of 10-4 that of water, in order to simulate observations of Comet Hyakutake (Laffont et al., 1998; A’Hearn et al., 1999). The S2 molecule photodissociates at one of three assumed rates: 100s (Meier et al., 1999), 200s (de Almeida & Singh, 1986; Budzien & Feldman, 1992), and 450s (A’Hearn et al., 1983a), as this rate is not well known. No dust was included for this work. With such simple chemistry, we have used our coma model to incorporate dynamical and optical depth effects accurately since S2 is confined to the innermost region of the coma where these effects are most important.
3 Results
3.1 Synthetic Fluorescence Spectra
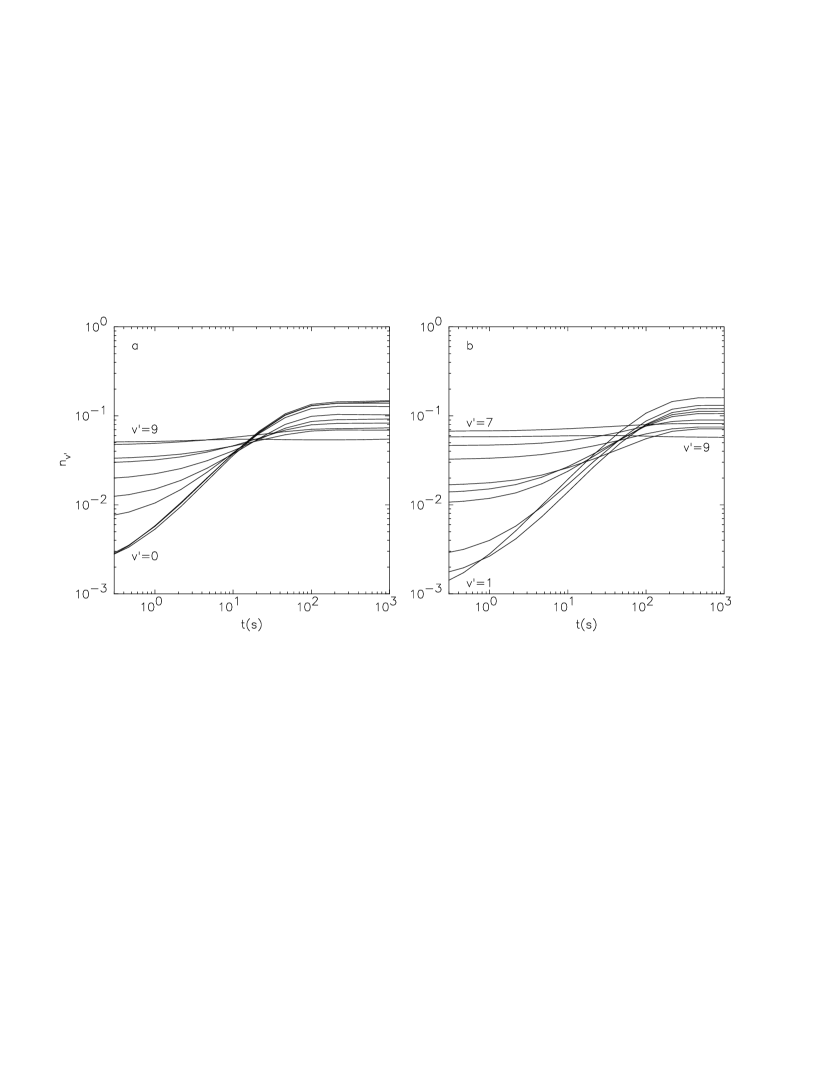
Individual synthetic fluorescence spectra of S2 are presented in figure 1 as a function of age of the molecule, obtained considering an irradiation equivalent to the solar irradiation at a heliocentric distance of 1 AU. At short times, corresponding to small cometocentric distances, the brightest lines are in the range 280 - 300 nm (e.g the 9-0 band at 282.9 nm and the 7-1 band at 296.1 nm) and the intensity of these lines does not change a lot with age . These lines correspond to transitions from the levels = 7 to 9 that reach a value close to the steady state value within 1s, as shown on figure 2a. This figure represents the population of the vibrational levels in the B-state, that is the sum of the population of the rotational levels in one vibrational level. When the time increases, the lower vibrational levels are populated and the lines at long wavelengths become brighter, such as the 3-3 band at 324.5 nm or the 2-3 band at 328.9 nm.
After a period of time of roughly 100s, the relative intensities of the lines are nearly constant (see figure 1). But inside a vibrational level, the population of the higher rotational levels continue to slowly increase, approaching steady state with the solar irradiation, to the detriment of the lower rotational levels.
3.2 Comparison with the Pure Vibrational Model
Our pure vibrational, time-dependent model tended to show that the fluorescence spectrum varies the most between t = 0 and 200 seconds, when the intensities have reached 90% of the steady-state values, but very little afterwards until about 600s, when steady state is effectively achieved (figure 2b). This result is different from the one deduced from our rovibrational model which shows that the global population of the vibrational levels are constant after about 100s. The numerous rotational levels allow the electrons to reach higher levels at a faster rate due to the overestimate of the Einstein coefficients for the emission when ignoring the rotational levels.
Using a pure vibrational model to interpret the relative intensities can lead to errors in estimating the effective solar irradiation time of S2 in the coma which can affect its derived lifetime against destructive processes. Indeed, the S2 lifetime is not a well known parameter. The lifetime deduced from observations in Comet IRAS-Araki-Alcock (A’Hearn et al., 1983a; Budzien & Feldman, 1992) and in Comet Hyakutake (Meier et al., 1999), and from laboratory studies (de Almeida & Singh, 1986) ranges between 100 and 450 seconds. The last value was derived by A’Hearn et al. (1983a) and is consistent with the fact that the steady-state spectrum gives the best fit for Comet IRAS-Araki-Alcock. However, we have shown above that even if considering a lifetime as short as 100s, the molecules have enough time to reach a state closely resembling the steady state. Lets consider a lifetime of 200s which is in better agreement with the laboratory calculations (de Almeida & Singh, 1986) and the scale length of 200 km derived more recently from the IUE spectrum of Comet IRAS-Araki-Alcock (Budzien & Feldman, 1992). The g-factors being very similar to those of the steady-state, the number of molecules in the coma will be the same and the abundance will be roughly twice higher than when considering a 450 s lifetime. An overestimate of the lifetime leads to a smaller value of derived abundance. Care must be taken when comparing abundance values derived by different groups.
Another difference between the two models is the displacement between the band heads considered in the pure vibrational model and the wavelength of maximum intensity resulting from the development of the bands over many rotational levels. Once the rovibrational lines are convolved with a FWHM gaussian of 1.1 nm corresponding to the instrumental resolution of IUE, the displacement is around 3 Å, that is similar to the shift observed in IUE spectra of Comet IRAS-Araki-Alcock (A’Hearn et al., 1983a).
3.3 Application to Cometary S2
3.3.1 S2 Fluorescence in a Column of the Coma
An observation of a given region of the coma gives the superposition of emissions of all the molecules in a column. These molecules are at different cometocentric distances, they have different age and hence have undergone different solar irradiation times. In order to model the S2 cometary fluorescence, we combined our fluorescence model with a global coma model based on dynamics and chemistry as described in section 2.2 (Huebner, 1991; Boice et al., 1995; Boice & Benkhoff, 1996). The number density of S2 given by the coma model is shown in figure 3 as a function of age and distance to the nucleus surface for different lifetimes: = 100s, 200s and 450s.
We weighted the individual fluorescence spectra with the number density given by the coma model as follows:
| (2) |
where is the synthetic spectrum obtained at the time since formation of the molecule, is the number density at the distance from the nucleus surface reached by the molecule in , and is the projected distance of the column to the nucleus surface. The angle varies from to to include the whole column. We have ignored the Greenstein effect for molecules within the column.
The superimposed non-equilibrium spectra that would be detected on the surface of the nucleus and 73 km away from it are plotted in figure 4, using a lifetime of 200 s. The number density decreases by more than 103 from the nucleus to 73 km away which causes an important decrease in the emission intensity. Moreover, we observe a shift in intensity from the 280-300 nm region to the 330-380 nm region. The maximum of emissions on the nucleus is the 7-1 band whereas at 73 km away from the nucleus, the maximum of emissions has shifted to the 2-3 band. Also, bands at longer wavelengths are stronger relative to the brightest bands.
Up to now, we considered an initial temperature of 200 K, which is a correct assumption if S2 is released from the nucleus. Other mechanisms for the formation of S2 have been proposed, involving chemical reactions (Saxena & Misra, 1995; A’Hearn et al., 2000), or a grain source (Vanysek, 1993). For these alternative assumptions, the excitation of S2 when it is formed is different. However, if we consider an initial temperature of 400 K, the effects due to the initial distribution is not perceptible when integrating over the line of sight as soon as one observe a few kilometres away from the nucleus.
Practically, we do not observe only one column in the coma but many within an aperture , for instance a slit or a hole:
| (3) |
It is important to integrate the weighted spectra within an aperture for simulating real observations. The spectrum will be different depending on the width of the slit, or if the slit is centered or off-centered from the nucleus. For instance, we can simulate an observation with a slit having an aperture of 0.87 7.4” or 68 580 km2 centered on the nucleus. This case actually simulates ground-based observations of Comet Hyakutake by Meier et al. (1999). The simulated spectra are shown in figure 5 for the lifetimes = 450, 200 and 100s. Considering a short lifetime leads to a smaller intensity but the shape of the spectrum is also different depending on (in particular, the relative intensities between the 280-310 nm region and the rest of the spectrum vary considerably). This fact is not relevant for spectra such as IUE spectra where the maximum wavelength is about 320 nm but may be interesting to consider in the case of visible spectra such as the ones obtained by Meier et al. (1999). We also considered the effect of having the same slit off-centered with an offset of 2”. A’Hearn et al. (1999) reported that with such an offset, S2 was no longer detected. With = 450s, the intensities are reduced by a factor of 3 compared to observations with a slit centered on the nucleus. This factor is 5 with = 200s and 12 with = 100s.
3.3.2 S2 Fluorescence at High Spectral Resolution
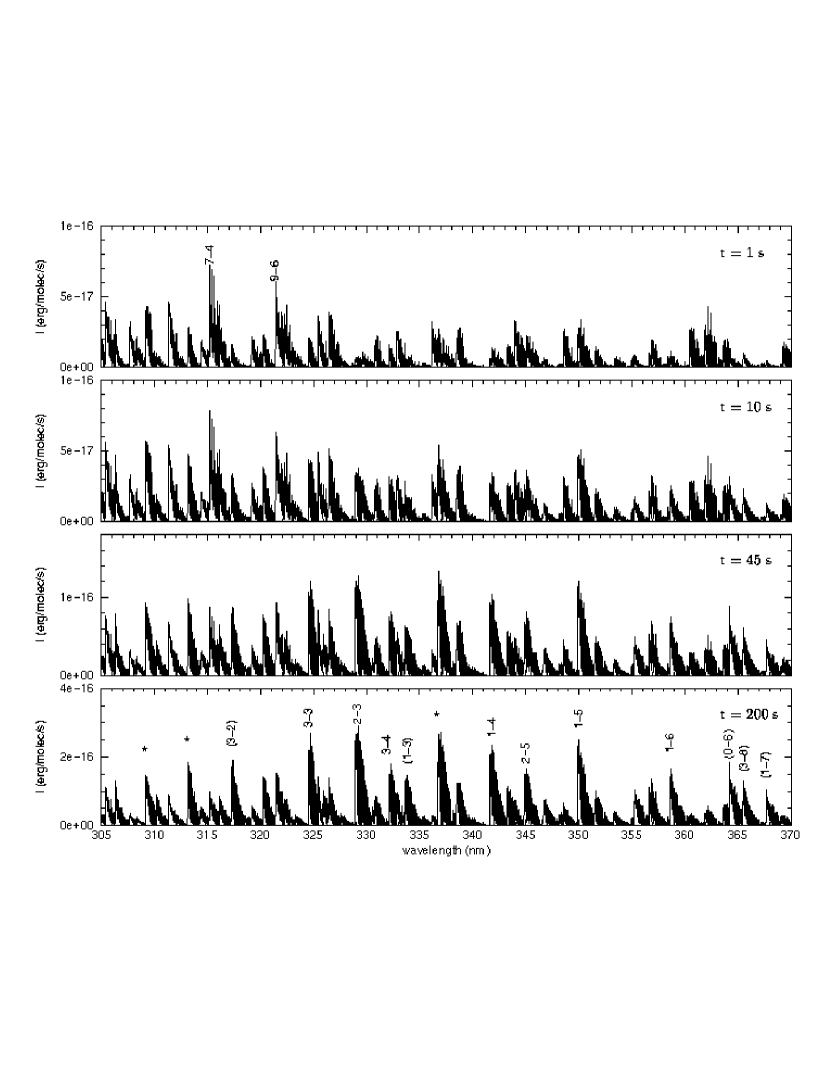
Another application of this model is the interpretation of high spectral resolution spectra. Figure 6 shows the synthetic rotational structure of the 1-5 band for a molecule of age =200s. This band is superimposed with the faint 6-8 band (dotted line). Also shown are the modeled lines convolved with a FWHM gaussian of 0.2 Å, which corresponds to ground-based observations of Comet Hyakutake (Meier et al., 1999). Near the band head, the convolution shows a steep increase due to the overlapping of many lines. Further away, one stucture contains the P and R lines. This 1-5 band was the brightest one detected by Meier et al. (1999). Table 1 lists the most intense bands predicted by the model after 200s solar irradiation time. These bands were effectively detected by Meier et al. (1999). The model shows that they become dominant very quickly once the molecule is released from the nucleus, within 45 seconds (figure 7). Some of the other brightest bands in table 1 were not detected because they are contaminated by stronger emission lines such as bands of OH(0-0), OH(1-1), and NH(0-0). Due to no constraint on temperature, the rotational temperature given by the modeled spectrum is too high compared to the 45K observed rotational temperature (Kim, 2000).
The upper spectrum in figure 7 is obtained for a molecule aged of 1s. The two bands, 7-4 and 9-6, are dominant. The intensity of these bands, particularly the 7-4 band, decrease relative to the other bands when the exposure time increases. The dominance of these bands in a spectrum with high spatial resolution is therefore a strong indication of freshly released S2 molecules.
4 Conclusion
We developed a time-dependent fluorescence model of S2 and combined it with a global coma model, for interpreting observations in different coma regions. As it takes into account the rotational structure of the molecule, it can also be used to analyze high spectral resolution observations, such as those obtained in Comet Hyakutake. We point out that it is also important to consider the rotational levels of S2 in the fluorescence calculations to interpret even moderate resolution spectra such as IUE spectra. We also demonstrated the need of a time-dependent model to allow better estimates of the lifetime and to determine the lines characteristic of the freshly released molecules.
In this work, we concentrated on linking the physics and chemistry of the coma and the cometary fluorescence. This is the first time to our knowledge that a gas dynamics model with chemistry has been coupled with a time-dependent fluorescence model to analyse cometary emissions, representing a leap forward in our ability to gain insight into the physical and chemical processes in the inner coma and the nature of parent species. This global model with many detailed processes in the inner coma has great potential to resolve issues regarding the detailed rotational lines intensities as functions of distance from the nucleus, collision frequency, and production rates and to gain insights into the composition into the cometary nucleus. To this end, the future direction of this work will be to investigate coma temperature profiles, the effects due to optical depth in the inner coma for the emergent S2 emissions, and also the role of collisions. Considering collisions would allow self-consistent calculations of the rotational temperature for direct comparison to observations. Using the global coma model, we will also consider a more complete chemistry of S2, not only photolysis for the production and destruction of S2 in cometary comæ.
References
- A’Hearn et al. (1983a) A’Hearn, M. F., Feldman, P. D., and Schleicher, D. G. 1983a, ApJ, 274, L99
- A’Hearn et al. (1983b) A’Hearn, M. F., Ohlmacher, J. T., and Schleicher 1983b, Tech. Rep. TR-AP83-044, University of Maryland, Dept. of Physics and Astronomy
- A’Hearn et al. (1999) A’Hearn, M. F., Wellnitz, D. D., Woodney, L., Feldman, P. D., Weaver, H. A., Arpigny, C., Meier, R., Jackson, W. M., and Kim, S. J. 1999, BAAS, 31(4), 1124
- A’Hearn et al. (2000) A’Hearn, M. F., Arpigny, C., Feldman, P. D., Jackson, W. M., Meier, R., Weaver, H. A., Wellnitz, D. D., Woodney, L. M 2000, BAAS, 32(3), 1079
- Anderson et al. (1979) Anderson, W. R., Crosley, D. R., and Allen, J. E. Jr 1979, J. Chem. Phys., 71(2), 821
- Boice et al. (1995) Boice, D. C., Benkhoff, J. and Gladstone, G. R. 1995, Earth, Moon, and Planets, 71, 235
- Boice & Benkhoff (1996) Boice, D. C., and Benkhoff, J. 1996, BAAS, 28(3), 1095
- Boice & Laffont (1997) Boice, D. C., and Laffont, C. 1997, Lunar and Planetary Science Conference, 28, 131
- Budzien & Feldman (1992) Budzien, S. A., and Feldman, P. D. 1992, Icarus, 99, 143
- de Almeida & Singh (1986) de Almeida, A. A., and Singh, P. D. 1986, Earth, Moon, and Planets, 36, 117
- Feldman et al. (1999) Feldman, P.D., Weaver, H.A., A’Hearn, M.F., Festou, M.C., McPhate, J.B., and Tozzi, G.-P. 1999, BAAS, 31(4), 1127
- Gear (1971) Gear, C. W. 1971, Numerical initial value problems in ordinary differential equations, (New Jersey, Prentice Hall)
- Heaven et al. (1984) Heaven, M., Miller, T. A., and Bondybey, V. E. 1984, J. Chem. Phys., 80(1), 51
- Herzberg (1989) Herzberg, G. 1989, Molecular Spectra and Molecular Structure, vol. I- Spectra of Diatomic Molecules, (Reprint ed., Malabar, Krieger publishing company)
- Huebner (1991) Huebner, W. F., Boice, D. C., Schmidt, H. U., and Wegmann, R. 1991, in Comets in the Post-Halley Era, vol.2, ed. R.L. Newburn Jr et al., 907
- Ikenoue (1960) Ikenoue, K. 1960, Science of Light, 9(2), 79
- Irvine et al. (2000) Irvine, W. M., Schloerb, F. P., Crovisier, J., Fegley, B., Jr., and Mumma, M. J. 2000, Protostars and Planets IV, (eds Mannings, V., Boss, A. P., Russell, S. S), 1159
- Kim et al. (1990) Kim, S. J., A’Hearn, M. F., and Larson, S. M. 1990, Icarus, 87, 440
- Kim (2000) Kim, S. J. 2000, BAAS, 32(3), 1072
- Laffont et al. (1998) Laffont, C., Boice, D. C., Moreels, G., Clairemidi, J., Rousselot, P., and Andernach, H. 1998, Geophys. Res. Lett., 25(14), 2749
- Matsumi et al. (1984) Matsumi, Y., Munakata, T., and Kasuya, T. 1984, J. Chem. Phys., 81(3), 1108
- Meier et al. (1999) Meier, R., Wellnitz, D. D., A’Hearn, M.F. 1999, Asteroids, Comets, Meteors, Cospar Colloquium, 10, 51
- Meyer & Crosley (1973) Meyer, K. A., and Crosley, D. R. 1973, Can. J. Phys., 51, 2119
- Mumma al. (2000) Mumma, M. J., DiSanti, M. A., Dello Russo, N., Magee-Sauer, and K., Rettig, T. W. 2000, ApJ, 531, L155
- Quick & Weston (1981) Quick, C. R. Jr, and Weston, R. E. Jr 1981, J. Chem. Phys., 74(9), 4951
- Ricks & Barrow (1969) Ricks, J. M., and Barrow, R. F. 1969, Can. J. Phys., 47, 2413
- Saxena & Misra (1995) Saxena, P. P., Misra, A. 1995, MNRAS, 272(1), 89
- Smith & Hopkins (1981) Smith, A. L., and Hopkins, J. B. 1981, J. Chem. Phys., 75(5), 2080
- Tatum & Watson (1971) Tatum, J. B., and Watson, J. K. G. 1971, Can. J. Phys., 49, 2693
- Vanysek (1993) Vanysek, V. 1993, in Molecules and grains in space, AIP conference proceedings 312, (ed. I. Nenner), 247
- Weaver et al. (1996) Weaver, H. A., Feldman, P. D., A’Hearn, M. F., Arpigny, C., Brandt, J. C., and Randall, C. E. 1996, BAAS, 28(2), 928


| Band | (nm) | relative intensity |
|---|---|---|
| vB-vX | ||
| 1 - 5aaBands detected in Comet Hyakutake (Meier et al., 1999) | 349.9 | 1.00 |
| 2 - 4bbOverlapping with NH(0-0) | 336.7 | 0.98 |
| 2 - 3aaBands detected in Comet Hyakutake (Meier et al., 1999) | 328.9 | 0.97 |
| 1 - 4aaBands detected in Comet Hyakutake (Meier et al., 1999) | 341.6 | 0.90 |
| 3 - 3aaBands detected in Comet Hyakutake (Meier et al., 1999) | 324.5 | 0.72 |
| 1 - 6aaBands detected in Comet Hyakutake (Meier et al., 1999) | 358.6 | 0.69 |
| 3 - 4aaBands detected in Comet Hyakutake (Meier et al., 1999) | 332.1 | 0.66 |
| 2 - 5aaBands detected in Comet Hyakutake (Meier et al., 1999) | 344.8 | 0.64 |
| 4 - 2ccOverlapping with OH(1-1) | 313.1 | 0.62 |
| 3 - 2aaBands detected in Comet Hyakutake (Meier et al., 1999) | 317.2 | 0.61 |
| 0 - 6aaBands detected in Comet Hyakutake (Meier et al., 1999) | 364.2 | 0.61 |
| 1 - 3aaBands detected in Comet Hyakutake (Meier et al., 1999) | 333.6 | 0.57 |
| 5 - 2ddOverlapping with OH(0-0) | 309.2 | 0.53 |