Abstract
The morphologies of wide-angle tailed (WAT) radio sources (edge-darkened, C-shaped, FR I radio sources) are the result of confinement and distortion of the radio lobes by the dense X-ray-emitting gas in clusters or groups of galaxies. These radio sources are easily seen at high redshifts () in short-exposure images from the Faint Images of the Radio Sky at Twenty-cm (FIRST) survey. Using a sample of approximately 400 WAT sources from the FIRST survey, we have discovered a number of high- clusters. Here, we present the highest- cluster found so far using this method: 1137+3000 at . We include photometric and spectroscopic results. Ten galaxies are confirmed at the cluster redshift, with a line-of-sight velocity dispersion of km s-1, typical of an Abell richness class 0 cluster.
Chapter 0 Uncovering High-z Clusters Using
Wide-Angle Tailed Radio Sources
1 Introduction
Wide-angle tailed (WAT) radio sources were first defined as a class by Owen & Rudnick (1976) who described them as a sub-class of head-tail radio sources. Head-tail sources include a radio core and tails of radio emission trailing from the core as the host galaxy moves through the dense gas of a cluster’s intracluster medium (ICM). Head-tail galaxies also include narrow-angle tails (NATs), which are generally associated with galaxies with large peculiar velocities in the outer parts of clusters; the ram pressure from the interaction with the ICM bends the radio lobes to create the NAT structure. Owen & Rudnick found that WATs, however, are most often associated with bright elliptical or cD galaxies in the cores of clusters, and surmised that their smaller peculiar velocities would therefore produce smaller bends in the radio lobes, resulting in a wide-angle, rather than a narrow-angle, tailed morphology. Later work, by e.g. Eilek et al. (1984) and O’Donoghue et al. (1993), found that the peculiar velocities of the host galaxies of WATs were too small to produce the observed bending of the lobes by ICM ram pressure. In addition, O’Donoghue et al. (1993) further defined the class of WATs as radio sources usually fulfilling five criteria: (1) association with a dominant galaxy in a cluster center, (2) radius from the core to the edge of each lobe kpc, (3) a dramatic transition from a collimated jet to a radio hot-spot (4) large-scale bends of both radio lobes in a C-shape, (5) radio power within a factor of three of the FR break. Point (5) refers to the break in radio power found by Fanaroff & Riley (1974); FR I sources typically have radio powers W/Hz, lobes that darken at the edges and that are often distorted, while FR II sources are the classic collinear doubles with W/Hz and edge-brightened lobes. At low-, FR I sources are usually found in clusters or groups of galaxies; FR II sources usually are not (Hill & Lilly 1991).
Since a WAT’s peculiar velocity relative to the cluster mean has been found to be insufficient to distort the radio lobes into the observed angles from ICM ram pressure, alternate scenarios have been proposed for the bending of the lobes. Eilek et al. (1984) suggested that the ICM may have large-scale fluid flows, left over from the cluster’s formation. Burns et al. (1994) added that large flows in the ICM could result from large scale cluster-cluster mergers. The merging gas could have velocities high enough ( km/s) to produce ram-pressure bending of the lobes, as shown in the simulations of Roettiger et al. (1993).
1 Sample
WAT radio sources should trace out clusters of galaxies, and in particular, they may locate clusters that have recently merged. Using a sample of 384 WAT and NAT radio sources selected from the first 3000 deg2 of the VLA Faint Images of the Radio Sky at Twenty-cm (FIRST) survey (Becker, White, & Helfand 1995), we have confirmed the existence of dozens of clusters with redshifts up to (Blanton et al. 2000, 2001, 2003). Imaging and multi-slit mask spectroscopic follow-up on a moderate-to-high redshift subset of ten of these revealed eight clusters with redshifts as high as (Blanton et al. 2000). A complete (area- and magnitude-limited) low- subset including 40 of the 384 objects was observed optically, and of them were found to be in richness class Abell 0 or greater clusters (Blanton et al. 2001). The majority of the low-redshift sources that are found in clusters, based on our optical richness measurements, are detected in the ROSAT All Sky Survey (five out of six detected for ). Those that are not found in clusters, based on our richness measurements, are not detected in the RASS (only one out of nine detected for ). In other words, the combination of radio and optical data gives us a very clear indication for the presence, or lack of, a cluster, as confirmed with X-ray observations.
In order to identify high- candidates, we obtained -band images of fields surrounding WATs that were blank to the limit of the Digitized Sky Survey (DSS). Some of these had no optical identifications even down to the limit of our images (). We then performed near-infrared (NIR) observations at the positions of these sources in hopes of uncovering very red, high- cluster galaxies.
Here we present optical and NIR observations taken at the position of the WAT radio source, 1137+3000. A combination of imaging and spectroscopy confirms that this source is located in a distant cluster of galaxies with a redshift . We assume km s-1 Mpc-1, , and throughout.
2 1137+3000: Radio Data
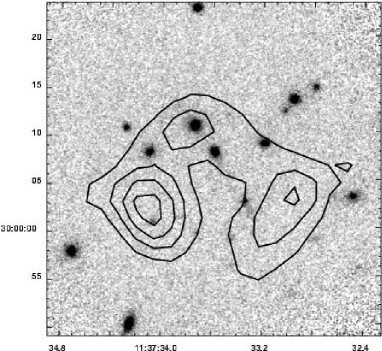
The radio source is detected in the FIRST survey as a three component object, including a core and two lobes. The source is clearly bent with an opening angle between the two lobes of . The size of the source (lobe to core to lobe) is 30′′ (240 kpc). The total flux density, as measured by FIRST is 9.1 mJy. The flux density measured from the low-resolution NRAO VLA Sky Survey (NVSS; Condon et al. 1997) is 9.8 mJy, slightly higher than the FIRST value. Using the NVSS flux density value, and assuming with , the radio power of the source at 1440 MHz is W Hz-1. This power is slightly below the FR I/II break for radio galaxies (Fanaroff & Riley 1974), and is typical of a WAT source (O’Donoghue et al. 1993). An overlay of the FIRST radio contours onto a Keck near-infrared camera (NIRC) image in the K′ filter of the cluster center is shown in Figure 1. The figure is 280 kpc on a side for our assumed cosmology. The radio core is coincident with an elliptical galaxy, as seen in the near-infrared image. This NIR image, which covers only the inner 35′′ region of the cluster, is used for display purposes only.

3 Color-Magnitude Diagrams
The 1137+30 field was observed in the NIR with IRIM at the KPNO 2.1m on UT 25 and 26 May 1997. The total exposures were 64 and 32 min. in the -band and -band, respectively. The optical observations were obtained at the MDM 1.3m with a total exposure in the -band of 7200 s on UT 21 May 1998 and were kindly provided by J. Kemp.
FOCAS was used to measure magnitudes for the standard stars and objects in the target fields for the NIR and optical data. Aperture magnitudes were measured for objects in the target fields. All images were scaled to have the same pixel scale (/pix). The and images were smoothed with a Gaussian to match the seeing in the -band image (the worst of the three, with 1.′′7). We then used FOCAS to measure magnitudes within an aperture with a diameter equal to 2FWHM ( = 6.8 pixels). This is close to a total magnitude and will measure the same part of the galaxy in each of the bands. At (see §4), this aperture corresponds to 27 kpc for our assumed cosmology.
The aperture magnitudes, measured as described above, for the radio source counterpart are 22.90, 19.46, and 17.78, in , , and , respectively. This gives colors of () = 5.12, () = 1.68, and () = 3.44. The absolute magnitude of the host galaxy is , assuming no evolution, a redshift (see §4), and a -correction from Coleman, Wu, & Weedman (1980). This is typical of a bright elliptical galaxy, but fainter than a cD.
Color-magnitude diagrams (CMDs) were constructed for objects in the entire 15.6 arcmin2 field as well as for only the objects found within a radius aperture (480 kpc at , see §4) from the radio source. The vs. CMD is presented in Figure 2. The top panel includes the objects within from the radio source, while the bottom panel includes the objects from the entire field. The objects that are confirmed to be at the cluster redshift (see §4) are circled. There is a much larger range in the colors of objects when looking at the CMD for the whole field. The objects in the radius aperture are more concentrated on the diagram than those in the whole field, and are redder, consistent with membership in a distant cluster. Most of the objects within from the radio source have colors in the range , consistent with early-type galaxies at .
4 Spectroscopy
A long-slit observation (60 min.) of the cluster that included the radio counterpart and two other galaxies was made at the Keck II 10m telescope with the Low Resolution Imaging Spectrometer (LRIS; Oke et al. 1995) on 13 April 1998. A multi-slit mask observation of the field surrounding the radio source was made at the Keck II 10m with LRIS on 29 May 2001 with a total exposure of 60 min. Objects were chosen for the slit mask based on their colors. Objects that had were candidates for inclusion on the mask, since they provide us the best opportunity of confirming galaxies at redshifts . The mask included a total of twelve program object slits.
Spectra were successfully extracted for ten of the program objects. Redshifts were initially estimated by identifying a few obvious lines, including the Ca II H+K break, and the [O II] and [O III] emission lines. The spectra were then Fourier cross-correlated with an elliptical galaxy template using FXCOR in IRAF.

All ten program object spectra that were successfully extracted had redshifts in the range , giving us a success rate of identifying cluster galaxies based on their NIR/optical colors. The spectrum of the radio host galaxy is shown in Figure 3, and is typical of an elliptical galaxy. We calculated the line-of-sight velocity dispersion using , where . We find km s-1 ( confidence). This is a typical value for an Abell richness 0 cluster (Lubin & Bahcall 1993).
5 Conclusions
We have provided photometric and spectroscopic evidence at optical and near-infrared wavelengths for a high-redshift cluster of galaxies associated with a wide-angle tailed radio galaxy at . The majority of high-redshift clusters found in traditional X-ray and optical surveys select the most X-ray luminous and optically rich clusters. The radio selection technique employed here is an important complement to those methods, in part because it can locate high-z clusters with a wide range of X-ray luminosities and optical richnesses, thus aiding in the study of galaxy evolution and cluster formation.
References
- [1] Becker, R. H., White, R. L., & Helfand, D. J. 1995, ApJ, 450, 559
- [2] Blanton, E. L., Gregg, M. D., Helfand, D. J., Becker, R. H., & White, R. L. 2000, ApJ, 531, 118
- [3] Blanton, E. L., Gregg, M. D., Helfand, D. J., Becker, R. H., & Leighly, K. M. 2001, AJ 121, 2915
- [4] Blanton, E. L., Gregg, M. D., Helfand, D. J., Becker, R. H., & White, R. L. 2003, AJ, 125, 1635
- [5] Burns, J. O., Rhee, G., Owen, F. N., & Pinkney, J. 1994, ApJ, 423, 94
- [6] Coleman, G. D., Wu, C.-C., & Weedman, D. W. 1980, ApJS, 43, 393
- [7] Condon, J. J., Cotton, W. D., Greisen, E. W., Yin, Q. F., Perley, R. A., Taylor, G. B, & Broderick, J. J. 1997, AJ, 115, 1693
- [8] Eilek, J. A., Burns, J. O., O’Dea, C. P., & Owen, F. N. 1984, ApJ, 278, 37
- [9] Fanaroff, B. L. & Riley, J. M. 1974, MNRAS, 167, 31P
- [10] Hill, G. J. & Lilly, S. J. 1991, ApJ, 367, 1
- [11] Lubin, L. M., & Bahcall, N. A. 1993, ApJ, 415, L17
- [12] O’Donoghue, A. A., Eilek, J. A., & Owen, F. N. 1993, ApJ, 408, 428
- [13] Oke, J.B. et al. 1995, PASP, 107, 375
- [14] Owen, F. N. & Rudnick, L. R. 1976, ApJ, 205, L1
- [15] Roettiger, K., Burns, J., & Loken, C. 1993, ApJ, 407, L53