On X-ray variability in narrow line and broad line AGNs
Abstract
We assembled a sample of broad line and narrow lines AGNs observed by ASCA, whose excess variances have been determined. The central black hole masses in this sample can be obtained from the reverberation mapping method and the width of H emission line. Using the black hole masses and the bolometric luminosity, the Eddington ratio can also be obtained. We confirmed the strong anti-correlation between X-ray variability and the central black mass founded by Lu & Yu. We further found that narrow line Seyfert 1 galaxies (NLS1s) also follow this relation with a larger scatter and there is only a weak correlation between the X-ray variability and the Eddington ratio, which suggest that rapid variability and narrow lines in NLS1s are mainly due to small central black holes in NLS1s, not the difference of circumnuclear gas around NLS1s. A strong correlation was found between the hard X-ray photon index and the Eddington ratio. If the suggestion of two distinct accretion classes, namely ADAF and thin disk accretion, in AGNs (Lu & Yu) is correct, the strong photon index-Eddington ration correlation showed that there exists a kind of two zone accretion disk, in which the outer zone is a thin disk, and the inner zone is an ADAF disk. Otherwise, the accretion process is the thin disk accretion and the ADAF accretion is not required.
keywords:
galaxies:active — galaxies:nuclei — X-rays: galaxies1 INTRODUCTION
X-ray variability has long been known to be a common property of active galactic nuclei (AGNs). There is not only long term but also rapid X-ray variability. The rapid variability is usually thought to come from the innermost region of the compact objects, which is helpful in getting information about the central objects, such as mass, accretion rate, geometry and radiation mechanisms (Mushotzky et al. 1993).
Since the discovery of X-ray variability, there have been many different quantities to describe the variability amplitude or the timescale, such as the flux-doubling timescale (Barr & Mushotzky 1986), normalized variability amplitude (Green et al. 1993), the excess variance (Nandra et al. 1997), and the exponential timescale (Bian & Zhao 2003). Since then, a strong anti-correlation between the variability and the luminosity (hereafter variance-luminosity relation) was founded. Leighly (1999) presented a X-ray variability analysis of a sample of 23 narrow line Seyfert 1 galaxies (NLS1s) observed by ASCA and found that when NLS1 are included the variance-luminosity correlation of AGN contains much more scatter than with BLS1 only, the excess variance is typically an order of magnitude larger for NLS1s than for Seyfert 1 with broad optical lines. Turner et al. (1999) presented a sample of 36 Seyfert 1 galaxies observed by ASCA and found a strong correlation between the excess variance and one optical parameter, FWHM of H, which is usually proposed to be related with the ”Eigenvector 1”, the fundamental parameters of the central engine (Boroson & Green 1992). Lu & Yu (2001) then discussed the relation between the excess variance and the reverberation central black hole masses (Kaspi et al. 2000) (hereafter variance-mass relation) in a sample of 22 AGNs observed by ASCA and found the relation between them to be strong. The variance-mass correlation can provide a plausible explanation of the variance-luminosity relation and its scatter (Turner et al. 1999; Leighly 1999; Ptak et al. 1998; Almaini et al. 2000).
Based on the circumnuclear gas difference in temperature, optical depth, density, or geometry, Turner et al. (1999) provided an attractive model, which does not depend on the difference in central black mass, to explain differences of the excess variance and the spectral index between NLS1s and Broad line AGNs (BL AGNs). However Lu & Yu (2001) suggested that the enhanced excess variance in NLS1s is due to their central smaller black holes. There are only a few NLS1s in the sample of Lu & Yu (2001). It is necessary to expand the sample to investigate the variance-mass relation, especially to include more NLS1s.
Up to now, there are only 37 AGNs whose central black hole masses are obtained by the reverberation mapping method (Ho 1998; Wandel et al. 1999; Kaspi et al. 2000). Fortunately a relation between the size of the broad line regions (BLRs) and the monochromatic luminosity at 5100 was founded by Kaspi et al. (2000). This empirical formulae provides the estimation of the central black hole masses for AGNs with available FWHM of H. This kind of mass estimation is widely used to investigate relations between the black hole mass and radio luminosity (Woo & Urry 2002), width of O[III] line (Wang & Lu 2001), and bulge mass (Bian & Zhao 2003).
In this paper we use this empirical formula to estimate the central black hole masses in an expanded sample of 41 AGNs observed by ASCA and investigate the relations between the excess variance, the photon index, the black hole mass, and the accretion rate. In particular, we wanted to determine whether the variance-mass relation founded by Lu & Yu (2001) would alter when we included more AGNs, especially NLS1s. The sample is described in Sect. 2 and the central black hole mass and the Eddington ratio are calculated in Sect. 3. The statistical analysis and discussion are presented in Sect. 4. Finally we summarize our conclusions in Sect. 5. All cosmological calculations in this paper assume .
2 SAMPLE
The sample used in Turner et al. (1999) consists of 36 Seyfert 1 galaxies available from the ASCA archive up to Nov. 1998. The criteria in Turner et al. (1999) is that only the objects whose light curves have at least 20 counts per 256-second time bin and at least 20 bins are included in their sample. They used the excess variance to describe the X-ray variability. If one designates the count rates for the N points in each light curve as , with errors , the X-ray excess variance is defined by,
The error on is , where
which is only the statistical error (Turner et al. 1999).
Lu & Yu (2001) also searched the ASCA archive up to Oct. 1999 to do a timing analysis using the same criteria as Turner et al. (1999). Here we adopt the variance data from Turner et al. (1999) and Lu & Yu (2001).
As in Turner’s paper (1999), for convenience we make such a split here by referring to objects with FWHM H km/s as narrow line AGNs (NL AGNs) and objects with FWHM H km/s as broad line objects (BL AGNs). At last, our sample consists of 41 AGNs, in which there are 18 NL AGNs and 23 BL AGNs. Although this sample is not a complete one, we suggest this large assembled sample provides new information about the difference between BL AGNs and NL AGNs. For objects with many values of the excess variance and the photon index, we adopt their mean values. The standard error of the mean is so small that we adopt the error from the above formula.
3 BLACK HOLE MASS AND EDDINGTON RATIO
3.1 Estimation of black hole masses
There are 22 AGNs in our sample whose central black hole masses are estimated by the reverberation mapping method. We use the black hole masses tabulated by Kaspi et al. (2000); values for three AGNs (Mrk 279, NGC 3516, and NGC 4593) were taken from Ho (1998). At the same time, we also use the B-magnitude and FWHM of H to estimate the masses for all 41 objects in our sample. We estimated the size of the BLR using the empirical correlation between the size and the monochromatic luminosity at 5100 (Kaspi et al. 2000):
| (1) |
where is estimated from the B-magnitude by adopting an average optical spectral index of -0.3 and accounting for Galactic redding and K-correction (Veron-Cetty et al. 2001). If the H widths reflect the Keplerian velocity of the line-emitting BLR material around the central black hole, then the viral mass is given by:
| (2) |
where G is the gravitational constant, V is the velocity of the line-emitting material. V can be estimated from the H width. Assuming the random orbits, Kaspi (2000) related the to the FWHM of the H emission line by .
3.2 Eddington ratio
In order to investigate the relation between X-ray variability and the accretion rate, the Eddington rates are calculated for these 41 AGNs. We calculated the ratio of the bolometric luminosity to the Eddington luminosity . is usually calculated by (Kaspi et al. 2000), where is the monochromatic luminosity at 5100. The value of gives a direct measurement of the Eddington ratio.
The estimated black hole masses are listed in table 1. Column (1) lists the name of objects, column (2) the FWHM of H , Column (3) the log of black hole mass in calculated using equations (1) and (2), Column (4) the log of the reverberation mapping mass in adopted from Kaspi et al. (2000) and Ho (1998) , and Column (5) the Eddington ratio. The excess variances are from Table 1 in Turner et al. (1999) and Table 1 in Lu & Yu (2001). The photon indices are from Table 1 in Turner et al. (1999). For objects with both the reverberation mapping mass and the calculated mass using equations (1) and (2), we adopt the former because the former is more reliable.
4 RESULTS AND DISCUSSION
4.1 Variance-mass relation
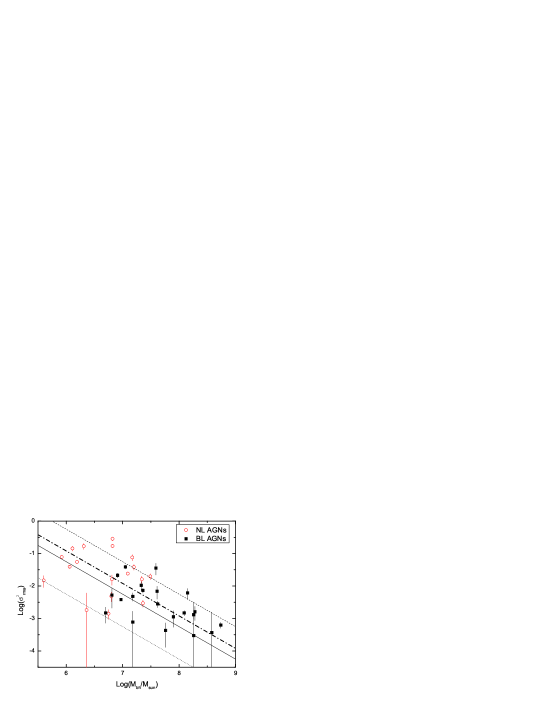
In Fig. 1 we show the excess variance versus the central black hole masses. In Fig. 2 we show the excess variance versus the Eddington ratio. We find the tight variance-mass correlation founded by Lu & Yu (2001) still remains when we included many other AGNs, especially NL AGNs. In Fig. 1 we also show the straight lines plotted in Fig. 1 in Lu & Yu (2001). Most of the objects are located in the region between the lines and . We fix the slope of the variance-mass relation as -1 to fit the data in Fig.1. A Spearman rank test gives and the correlation coefficients (R) is -0.65 corresponding to a probability of that the correlation is caused by a random factor.
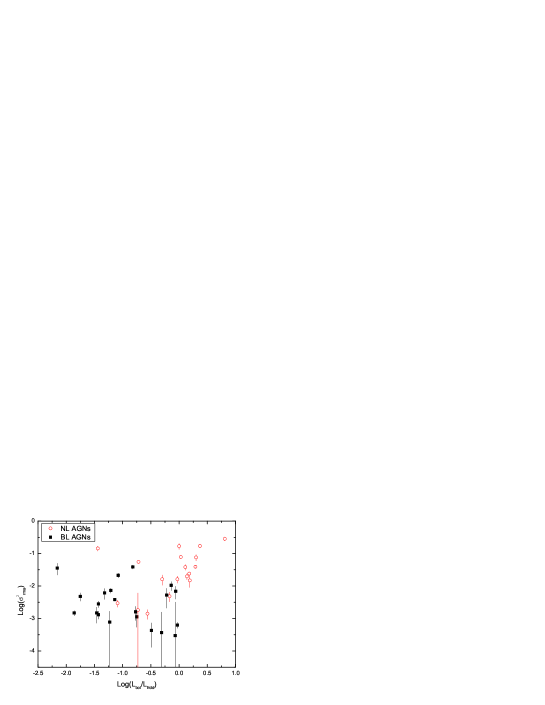
There are astrophysical reasons to relate the excess variance with the accretion rates. However we find there is no strong correlation between them. We plot the excess variance versus the Eddington ratio in Fig. 2. A Spearman rank test gives (, ). When considering only NL AGNs or BL AGNs, we find there is no correlation between the excess variance and the Eddington ratio if we exclude NGC 3227 (Lu & Yu 2001).
4.2 Relation between photon index and Eddington ratio
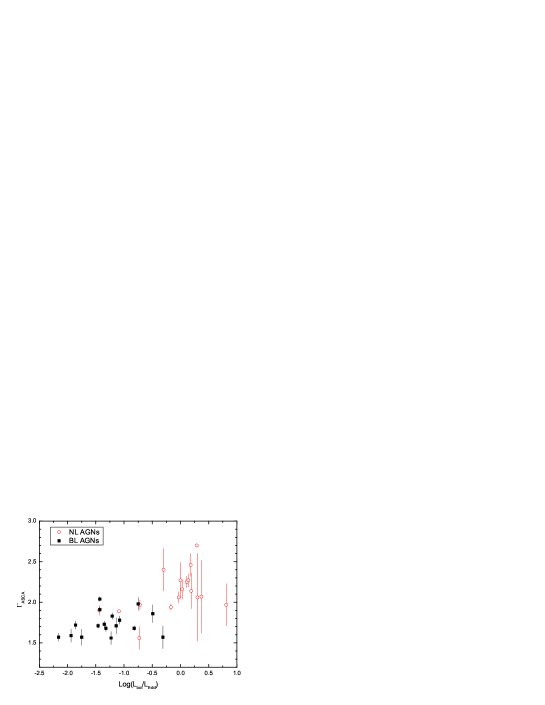
Although weak relation between the excess variance and the Eddington ratio is found here, we find there is a strong correlation between the photon index in 2-10keV () and the Eddington ratio (Fig. 3). A Spearman rank test gives (, ). The correlation between and Eddington ratio still remains medium strong if we only consider BL AGNS (R=0.26) or NL AGNs (R=0.48).
4.3 Discussion
We use equations (1) and (2) to calculate the black hole masses for all 41 AGNs in our sample. The errors of the calculated black hole masses using equations (1) and (2) is mainly from the accuracy of equation (1); the geometry and the dynamics of the BLRs, especially the inclination to the line of sight in NL AGNs (Bian & Zhao 2002). The error in the mass estimation using equations (1) and (2) is about 0.5 dex (Wang & Lu 2001). Fig. 4 shows that our calculated masses from equations (1) and (2) is consistent with the reverberation mapping masses (see Table 1). The variance-mass relation in NL AGNs is consistent with that in BL AGNs founded by Lu & Yu (2001). It is plausible that there exists a variance-mass relation for not only BL AGNs but also NL AGNs. There is a weak correlation between the excess variance and the Eddington ratio. There is no correlation between them if we just consider BL AGNs or NL AGNs. Turner et al. (1999) have suggested that the different circumnuclear gas of NL AGNs may lead to the different X-ray variance between BL AGNs and NL AGNs. The difference of the circumnuclear gas is caused by the higher accretion rate in NL AGNs. The strong variance-mass correlation and the weak correlation between the variability and the Eddington ratio suggest that the enhanced hard X-ray excess variance in NL AGNs founded by Leighly (1999) is mainly due to the smaller black hole, not the difference of circumnuclear gas around NL AGNs. The variance-mass anti-correlation can be interpreted that X-ray variance is a result of some global coherent variations in the X-ray emission region which is scaled by the size of the black hole in AGNs (Lu & Yu 2001).
Equation (1), used to estimate the black hole mass, is derived in the sample of Kaspi et al. (2000). However, most AGNs in the sample of Kaspi et al. (2000) are BL AGNs. Whether equation (1) is suitable for NL AGNs is a matter of debate. The masses for NLS1s estimated from equation (1) appear to be consistent with that from the the mass-velocity dispersion relation in AGNs (Wang & Lu 2000), which showed that equation (1) can be used in NL AGNs in spite of the larger uncertainty. Turner et al. (1999) showed that there is a strong correlation between the excess variance and the FWHM H. For our sample we also find a strong variance-FWHM correlation (, ), which is scatter than the variance-mass correlation (, ). The stronger variance-mass correlation showed that FWHM H can be combined with the luminosity to estimate the central mass. Perhaps the early finding of the variance-FWHM correlation is due to the variance-mass correlation. At the same time we should notice the uncertainty in equation (1) leads to just a little stronger variance-mass correlation.

We also find there exists a strong correlation between the photon index and the Eddington ratio. Lu & Yu (1999) compiled a sample of Seyfert 1 galaxies and QSOs and found these objects to be distributed in two distinct classes in the plane of ROSAT soft X-ray photon index versus the Eddington ratio (the ratio of the ionizing luminosity to the Eddington luminosity). There is a strong correlation between ROSAT photon index and the Eddington ratio in these two classes. They also plot versus the Eddington ratio for several objects with available ASCA data. Here we use the bolometric luminosity rather than the ionizing luminosity to calculate the Eddington ratio and find is strongly correlated with the Eddington ratio. The enhanced in NL AGNs (Leighly 1999) is intimately related with the Eddington ratio. First we assume that the interpretation of Lu & Yu (1999) on the split in the photon index-accretion rates plane is correct, there are two distinct accretion disks in Seyfert 1 galaxies and QSOs. If we take (Lu & Yu 1999) as the critical value for ADAF (advection-dominated accretion flow) disk class and thin disk class, from Fig. 3 we find the increases with the Eddington ratio in ADAF and thin disk classes. The relation between and the Eddington ratio can be understood in the frame of the accretion disk and the corona. For a thin disk, the disk luminosity to irradiate the corona increases as the Eddington rate increases. This can cause the corona to cool efficiently owing to Compton cooling and cooler corona producing few hard X-ray photons leads to large . For the ADAF model of low accretion rate, the optical depth increases and causes a correspondent increase in the Compton -parameter when the Eddington ratio increases (Esin et al. 1997). Larger optical depth will result in a harder and smoother X-ray spectrum index, which is in conflict with our founded relation between and the Eddington ratio. A accretion disk consisting two zones (outer thin disk and inner ADAF disk) is our preferable interpretation. The truncation radius of the two zones decreases with increasing Eddington ratio. The ADAF X-ray photon index becomes dramatically softer because the radiation from the disk is Compton-scattered by the hot gas in ADAF as the Eddington rate increases. If the interpretation of Lu & Yu (1999) is not correct, the strong correlation between and the Eddington ratio in the sample of NL and BL AGNs suggests the ADAF disk is not required and there exists a simple thin accretion disk. Much work on detail spectral fitting of AGNs using ADAF and/or thin disk models is needed to clarify this question in the future.
5 CONCLUSIONS
We investigated the relations between hard X-ray variability, photon index, the black hole mass, and the Eddington ratio in a collected sample of 41 BL AGNs and NL AGNs. NL AGNs follow the same variance-mass relation in BL AGNs founded by Lu & Yu (2001). The X-ray variability is mainly due to the black hole mass, not the accretion rate. A strong correlation between the hard X-ray photon index and the Eddington ratio suggests there exists the thin disk in the inner region of the AGNs. If the suggestion of two distinct accretion classes (Lu & Yu 1999) is correct, there exists a kind of two zone accretion disk, in which the outer zone is a thin disk, and the inner zone is an ADAF disk. Otherwise, the accretion process is the thin disk accretion and the ADAF accretion is not required.
ACKNOWLEDGMENTS
This work has been supported by the NSFC (No. 10273007).
| Name | FWHM | |||
|---|---|---|---|---|
| Mrk335 | 1620 | 6.96 | 6.80 | -0.17 |
| IZW1 | 1240 | 7.20 | – | 0.11 |
| TonS180 | 1120 | 7.09 | – | 0.18 |
| Fairall9 | 5780 | 8.43 | 7.90 | -0.75 |
| RXJ0148-27 | 1050 | 7.17 | – | 0.30 |
| Nab0205+024 | 1330 | 7.49 | – | 0.14 |
| Mrk1040 | 1830 | 6.36 | – | -0.73 |
| LB1727 | 2800 | 8.58 | – | -0.31 |
| 3C120 | 1910 | 6.85 | 7.36 | -1.09 |
| Ark120 | 5800 | 8.21 | 8.26 | -1.43 |
| MCG+8-11-11 | 3630 | 7.18 | – | -1.23 |
| H0707-495 | 1000 | 6.31 | – | 0.00 |
| PG0804+761 | 2757 | 8.04 | 8.28 | -0.77 |
| PG0844+349 | 2210 | 7.62 | 7.33 | -0.14 |
| Mark110 | 1430 | 6.54 | 6.75 | -0.56 |
| PG0953+415 | 3110 | 8.62 | 8.26 | -0.07 |
| NGC3227 | 4920 | 7.08 | 7.59 | -2.16 |
| RE1034+396 | 1500 | 6.81 | – | -0.30 |
| NGC3516 | 4760 | 7.56 | 7.36a | -1.21 |
| NGC3783 | 3790 | 7.14 | 6.97 | -1.14 |
| Mark42 | 670 | 5.60 | – | 0.19 |
| NGC4051 | 1170 | 5.30 | 6.11 | -1.44 |
| NGC4151 | 5910 | 7.24 | 7.18 | -1.75 |
| PG1211+243 | 1832 | 7.71 | 7.61 | -0.06 |
| Mrk766 | 850 | 5.92 | – | 0.03 |
| 3C273(PG1226) | 2810 | 8.89 | 8.74 | -0.03 |
| NGC4593 | 3720 | 7.12 | 6.91a | -1.08 |
| IRAS13224-38 | 620 | 6.82 | – | 0.81 |
| MCG-6-30-15 | 1700 | 6.19 | – | -0.72 |
| IC4329A | 4800 | 7.45 | 6.70 | -1.46 |
| Mrk279 | 5360 | 7.86 | 7.62a | -1.43 |
| PG1404+226 | 880 | 6.82 | – | 0.37 |
| NGC5548 | 5610 | 7.76 | 8.09 | -1.86 |
| Mrk478 | 1450 | 7.34 | – | -0.03 |
| Mrk841 | 5470 | 8.15 | – | -1.32 |
| Mrk290 | 2500 | 7.05 | – | -0.82 |
| 3C390.3 | 10000 | 8.51 | 8.53 | -1.94 |
| Mrk509 | 2270 | 7.70 | 7.76 | -0.49 |
| Ark564 | 720 | 6.06 | – | 0.29 |
| NGC7469 | 3388 | 7.57 | 6.81 | -0.22 |
| MCG-2-58-22 | 6360 | 8.54 | – | -1.35 |
References
- [] Almaini O., Lawrence A., Shanks T., Edge A., Boyle B. J., Georgantopoulos I., Gunn K. F., Stewart G. C., Griffiths R. E., 2000, MNRAS, 315, 525
- [] Barr P., Mushotzky R. F., 1986, Nature 320, 421
- [] Bian W., Zhao Y., 2002, A&A, 395, 465
- [] Bian W., Zhao Y., 2003, PASJ, 55, 143
- [] Bian W., Zhao Y., 2003, ApJ, 591
- [] Boroson T.A., Green R.F., 1992, ApJS 80, 109
- [] Esin A. A., McClintock J. E., Narayan, R., 1997, ApJ, 489, 865
- [] Green A.R., McHardy I.M., Lehto H.J., 1993, MNRAS, 265, 664
- [] Leighly K., 1999, ApJS, 125, 297
- [] Ho L. C., 1998, in Chakrabarti S. K., eds, Observational Evidence for Black Holes in the Universe. Kluwer, Dordrecht, p. 157
- [] Kaspi S., Smith P.S., Netzer H., Maoz D., Jannuzi B.T., Giveon U., 2000, ApJ, 533, 631
- [] Lu Y.-J., Yu Q.-J., 1999, ApJ, 526, L5
- [] Lu Y.-J., Yu Q.-J., 2001, MNRAS, 324, 653
- [] Mushotzky R. F. et al., 1993, ARA&A, 31, 717
- [] Nandra K., George I.M., Mushotzky R.F., Turner T.J., Yaqoob T., 1997, ApJ, 476, 70
- [] Ptak A., Yaqoob T., Mushotzky R., Serlemitsos P., Griffiths R., 1998, ApJ, 501, L37
- [] Turner T. J., George I.M., Nandra K., 1999, ApJ, 524, 667
- [] Veron-Cetty M. P., Veron P., 2001, A&A, 374, 92
- [] Wandel A., Peterson B. M., Malkan M. A., 1999, ApJ, 526, 579
- [] Wang T. G., Lu Y. J., 2001, A&A, 377,52
- [] Woo J. H., Urry C. M., 2002, ApJ, 579, 530