Abstract
To examine the evolution of the early-type galaxy population in the rich cluster Abell 2390 at we have gained spectroscopic data of 51 elliptical and lenticular galaxies with MOSCA at the 3.5 m telescope on Calar Alto Observatory. This investigation spans both a broad range in luminosity () and uses a wide field of view of , therefore the environmental dependence of different formation scenarios can be analysed in detail as a function of radius from the cluster centre. Here we present results on the surface brightness modelling of galaxies where morphological and structural information is available in the F814W filter aboard the Hubble Space Telescope (HST) and investigate for this subsample the evolution of the Fundamental Plane.
Chapter 0 Early-type Galaxies in the Cluster
Abell 2390 at z = 0.23
1 Introduction
A key question of early-type galaxy evolution is when and within what timescales their stellar populations have been formed. In models based on a monolithic collapse a burst of star formation at high redshift () is followed by a passive evolution of the stellar populations. This is in contrast to the formation scenario of hierachical cluster models, presuming longer assembly timescales for the more massive galaxies and therefore resulting in somewhat younger mean ages.
In order to probe the evolution of galaxies, it it necessary to explore both the morphological evolution as well as the evolution of the luminosities and the mass-to-light () ratios of the galaxies. This can be best achieved with the Fundamental Plane (FP). In a three dimensional parameter space, defined by three parameters, the effective radius , effective surface brightness and velocity dispersion , the FP establishes a tight correlation (Dressler et al. 1987, Djorgovski & Davis 1987). Projections of this plane are the the Faber-Jackson relation (FJR), luminosity vs. relation, (Faber & Jackson 1976) and the Kormendy relation (KR), a correlation between vs. (Kormendy 1977).
To overcome selection problems and possible limitations due to a small number of the more luminous galaxies of previous spectroscopic samples, we focus in this investigation of the cluster Abell 2390 on a large number of objects (), spanning a wide range in luminosity , and a wide field of view of ( Mpc), analogous to the study of Abell 2218 by Ziegler et al. (2001). Furthermore the evolution of galaxies in age, metallicity and abundance ratios is investigated by analysing absorption line strengths, such as H, Mgb, Fe5270 and Fe5335 in comparison with the latest stellar population models. The determination of velocity dispersions of our galaxies makes it possible not only to study the Faber-Jackson and Mg relations but also these relations in respect to the slope, scatter and zeropoint. With this large sample, it is possible to explore variations in early-type galaxy evolution not only in the dense core of a rich cluster but also in a less dense environment by incorporating galaxies at larger radii from the cluster centre. In addition different sub-populations (like E, S0, E+A) can be analysed with statistically significant reliability.
Through this article we adopt a cosmological model with a deceleration parameter of , a Hubble constant of = 65 km s-1 Mpc-1 and a cosmological constant of .
2 Observations and Sample Selection
The large spectroscopic sample of this study comprises a total of 63 spectra of 51 different early-type galaxies gained using the MOSCA spectrograph at the 3.5 m telescope at Calar Alto Observatory in Spain during two observing runs (Sept. 1999 and July 2000). The spectral resolution in the wavelength range Angström (around the and Mgb lines) was 5.5 Angström FWHM, corresponding to km s-1. Values for the vary between 9.6 and 79.8 with an average value of .
The objects were selected on the basis of ground-based Gunn -band images (500 sec) obtained with the Palomar 5 m Hale telescope. Additional imaging data from Mt. Palomar is available in the (3000 sec) and (500 sec) filter bands and the WFPC2 camera onboard the Hubble Space Telescope (HST) observed A 2390 in the F555W and F814W filter (10800 sec each).
3 Reduction and Analysis
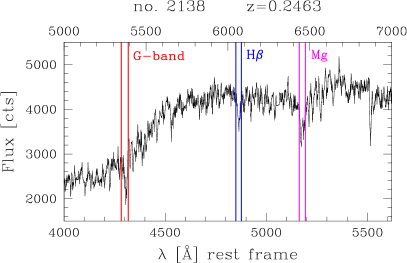
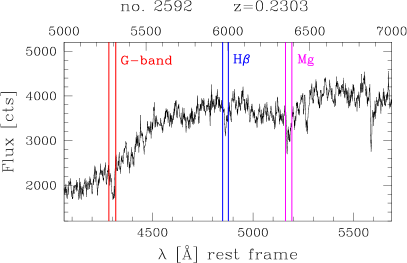
All spectra were reduced using standard reduction techniques implemented within MIDAS and IRAF. Examples of final 1-dimensional spectra in rest frame wavelengths are plotted in Fig. 1. The velocity dispersions were evaluated with the Fourier Correlation Quotient method as described in Bender (1990).
Absolute magnitudes for all galaxies were calculated from our ground-based photometry. Using SExtractor (Bertin & Arnouts 1996), object positions were determined and performing aperture photometry apparent magnitudes were measured. The total Gunn magnitudes were transformed to rest frame and rest frame Gunn magnitudes with typical k-corrections of and , for HST objects according to their morphology.
4 HST Photometry
The surface brightness models for our galaxies were constructed using our F814W image. As pointed out by Ziegler et al. (1999), an exposure time of ksec is deep enough to determine structural parameters down to mag.
1 Structual Parameter Analysis
Structural properties were determined by fitting the surface brightness profile as determined from the HST F814W images with an and an exponential law profile, both separately and in combination (Saglia et al. 1997). For the bulge profile a special form of the Sérsic profile (Sérsic 1968), the classical de Vaucouleurs profile, in the following form was applied:
| (1) |
is the surface brightness at along the semimajor axis and is the effective surface brightness. The disk profile is well represented by an exponential law, defined as:
| (2) |
where is the (face-on) central surface brightness for the disk and the exponential disk scale length. In total structural parameters could be determined for 14 galaxies out of 15 for which we also have obtained spectra. In Fig. 1 examples of the surface brightness profile fitting are shown. Values for the total magnitude , the central surface brightness , the effective radius and the effective radius of the bulge , and the disk-to-bulge ratio are listed. The model for the S0 galaxy # 2138 shows the existence of a small disk component at (). In the case of the elliptical (E) galaxy # 2592 no disk component is seen. Both galaxies are well reproduced by a combination of a de Vaucouleurs profile and a model for an underlying disk component.
5 The Fundamental Plane at intermediate Redshift
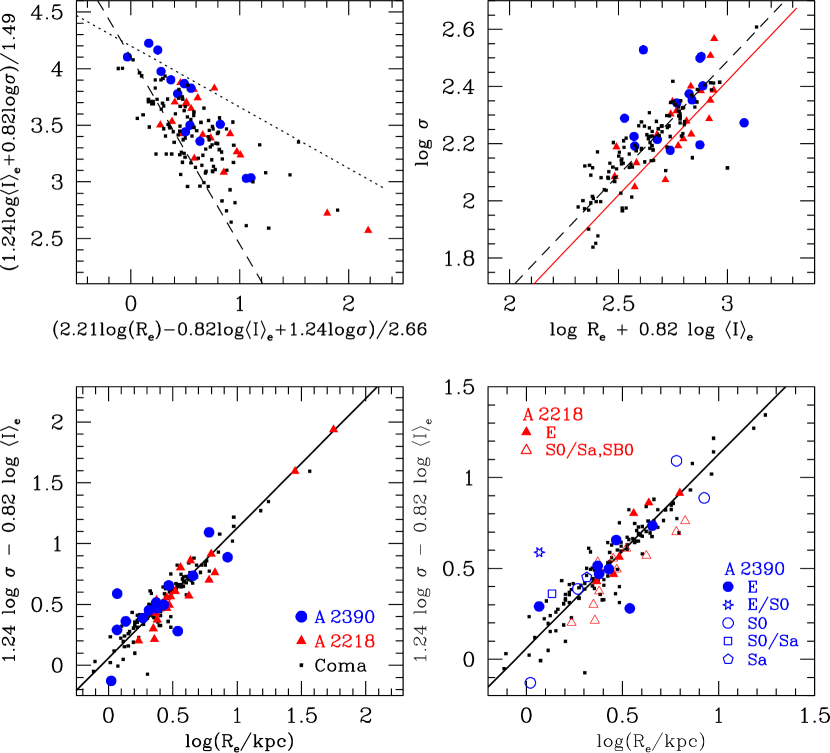
In Fig. 2 the Fundamental Plane (FP) for A 2390 in rest frame Gunn is illustrated. The figure also shows the FP for the local Coma samples of Jørgensen et al. (1996) (JFK96), Jørgensen (1999) (J99) and for the intermediate redshift cluster of A 2218 by Ziegler et al. (2001) at . A morphological analysis of the HST galaxies revealed that our sample splits nearly equally into elliptical and lenticular (S0) galaxies. 7 galaxies were classified as elliptical, 6 as lenticular and one as a early-type spiral (Sa). Both families are uniformly distributed along the Fundamental Plane (see Fig. 2). Compared to the sample of 115 Coma galaxies we deduce a modest luminosity evolution of mag for the overall sample. This result is in agreement with the predictions of the hierarchical merging scenario for rich clusters (Kauffmann 1996).
6 Conclusions
We have investigated 51 members of the A 2390 early-type galaxy population,
both over a broad range in luminosity () and a wide
field of view of . Structural properties of the HST subsample
were analysed by combining an and an exponential law profile for
accurate surface brightness modelling.
From the Fundamental Plane for A 2390 we find a mild evolution of
mag, which is in agreement with predictions of
hierachical models of cluster formation.
Acknowledgements: AF and BLZ acknowledge financial support by the Volkswagen Foundation (I/76 520) and the Deutsche Forschungsgemeinschaft. The Calar Alto staff is thanked for efficient observational support.
![[Uncaptioned image]](/html/astro-ph/0303545/assets/x1.png)
![[Uncaptioned image]](/html/astro-ph/0303545/assets/x2.png)
References
- [1] Bender, R. 1990, A&A, 229, 441
- [2] Bender, R., Burstein, D., & Faber, S. M. 1992, ApJ, 399, 462
- [3] Bertin, E., Arnouts, S. 1996, A&AS, 117, 393
- [4] Djorgovski, S., Davis, M. 1987, ApJ, 313, 59
- [5] Dressler et al. 1987, ApJ, 313, 42
- [6] Faber, S. M., Jackson, R. E. 1976, ApJ, 204, 668
- [7] Jørgensen, I. 1999, MNRAS, 306, 607 (J99)
- [8] Jørgensen, I., Franx, M., Kjærgaard, P. 1996, MNRAS, 280, 167 (JFK96)
- [9] Kauffmann, G. 1996, MNRAS, 281, 487
- [10] Kormendy, J. 1977, ApJ, 218, 333
- [11] Saglia, R. P., Bertschinger, E., Baggley, G. et al. 1997, ApJS, 109, 79
- [12] Sérsic, J. L. 1968, Atlas de galaxias australes (Cordoba, Argentina: Observatorio Astronomico)
- [13] Ziegler, B. L. et al. 1999, A&A, 346, 13
- [14] Ziegler, B. L. et al. 2001, MNRAS, 325, 1571