The properties of spiral galaxies: confronting hierarchical galaxy formation models with observations
Abstract
We compare the properties of local spiral galaxies with the predictions of the Cole et al. semi-analytic model of hierarchical galaxy formation, in order to gain insight into the baryonic processes, such as gas cooling and star formation, that were responsible for shaping these galaxies. On the whole, the models reproduce the properties of present-day spirals rather well, including the trend in scale-size with luminosity, the width of the scale-size distribution, the tight gas fraction–surface brightness and gas fraction–star formation history correlations, the metallicity–magnitude correlation, and the present-day star formation rates and stellar mass-to-light ratios. Of special note is our demonstration that, once the effects of dust and variations in stellar populations have been taken into account, published spiral galaxy scale-size distributions derived from optical data (with widths ) can be reconciled with the width () of the stellar mass scale-size distribution predicted by the semi-analytic model.
There are some illuminating discrepancies between the observations and the Cole et al. model predictions. The model colours of luminous spiral galaxies are somewhat too blue and those of faint galaxies somewhat too red, most likely indicating shortcomings in the way that gas is accreted by spiral galaxies. Furthermore, the model produces too few luminous spiral galaxies. These difficulties could be resolved by altering the way in which gas cooling is treated or, perhaps, by adopting a higher baryon fraction and invoking galactic “superwinds.” Secondly, stellar mass-to-light ratios are found to be as high as observations permit. Yet, typically 60 per cent of the mass in the inner half-light radius of the model galaxies is dark. This results in an offset between the model and observed spiral galaxy luminosity-linewidth relation. This could be resolved by substantially reducing the mass of baryons which make it into a galaxy disc (with an attendant decrease in stellar mass-to-light ratio), or by modifying the assumed dark matter profile to include less dark matter in the inner parts.
keywords:
galaxies: formation – galaxies: evolution – galaxies: general – galaxies: spiral – galaxies: stellar content – dark matter1 Introduction
Understanding the place of spiral galaxies in hierarchical models of galaxy formation is of special importance for two main reasons. Firstly, one of the principal, justifiable, assumptions underpinning many studies of galaxy formation in a Cold Dark Matter (CDM) context is that all galaxies form initially as discs (e.g., Baugh, Cole & Frenk 1996; Abadi et al. 2003; although see Nulsen & Fabian 1997 for a different view). Only subsequently are the signatures of discs erased by ubiquitous process of violent galaxy mergers [Barnes 1992]. Thus, understanding galaxy discs is a prerequisite for understanding all galaxies. Secondly, because of their ongoing star formation and disc morphology (indicating a lack of recent violent mergers), spiral disc galaxies give a unique insight into the formation and evolution of “quiescent” galaxies. This quiescent evolution depends strongly on certain processes and the way in which they are modelled, such as gas cooling, star formation (SF) and feedback. These phenomena, because of their complex nature, are amongst the most difficult to incorporate in the models. In this work, we hope to improve our understanding of these processes by comparing the properties of local spiral galaxies with model spiral galaxies from the semi-analytic Cole et al. (2000; CLBF hereafter) simulations.
Semi-analytic models attempt to capture the essential features of galaxy formation in a CDM cosmology using simple but effective parameterisations of the relevant physical processes. In this way, it becomes possible to establish the relative importance of various processes in determining galaxy properties, and to identify specific areas of uncertainty [White & Rees 1978, Cole 1991, White & Frenk 1991, Lacey & Silk 1991, Kauffmann, White & Guideroni 1993, Cole et al. 1994, Somerville & Primack 1999, Cole et al. 2000, van den Bosch 2002, Benson et al. 2003b]. The results of state-of-the-art, but computationally expensive, -body and gas dynamical simulations are used to motivate the prescriptions employed in semi-analytic models to describe processes such as the the growth of dark matter haloes and the radiative cooling of gas [Cole & Lacey 1996, Benson et al. 2001a, Springel et al. 2001, Murali et al. 2002, Helly et al. 2002a, Helly et al. 2002b].
The global properties of galaxies are generally well reproduced by semi-analytic models. Here, we highlight just a few of the many successes of this approach. Galaxy sizes, morphological mixes, luminosity functions, the slope and scatter of the Tully-Fisher (TF) relation, and the star formation history (SFH) of the Universe are all reproduced well [White & Frenk 1991, Kauffmann, White & Guideroni 1993, Cole et al. 1994, Baugh et al. 1996, Baugh et al. 1998, Somerville & Primack 1999, Somerville, Primack & Faber 2001, CLBF]. For spheroids, the black hole mass–luminosity/velocity dispersion relation and the colour–magnitude relation can be interpreted within this framework [Kauffmann & Charlot 1998, Kauffmann & Haehnelt 2000]. Furthermore, when combined with high resolution -body simulations, these models provide a good description of the clustering properties of galaxies at both low and high redshift [Governato et al. 1998, Baugh et al. 1999, Kauffmann et al. 1999, Benson et al. 2000, Benson et al. 2001b, Norberg et al. 2001, Mathis et al. 2002].
However some predictions of the semi-analytic models are not in such good agreement with the observations. No model has yet been able to match the luminosity function and the TF relation zero-point simultaneously if the disc circular velocity is constructed in a way that accounts for the gravitational effect of the baryon collapse (Kauffmann et al. 1993; Cole et al. 1994; Heyl et al. 1995; Somerville & Primack 1999; van Kampen, Jimenez & Peacock 1999; CLBF). This problem has also been seen in -body gas-dynamic simulations (Navarro & Steinmetz 2000; Eke, Navarro & Steinmetz 2001; N. Katz, 2002, private communication) and ‘analytical’ studies [Mo & Mao 2000, van den Bosch 2000, Yang, Mo & van den Bosch 2003]. In the model of CLBF, who give most weight to matching the luminosity function when setting model parameter values, this problem manifests itself as a velocity offset of 30 per cent in the zero point of the TF relation (when the disc circular velocity at the half mass radius is used: when the halo circular velocity is used the offset disappears). Furthermore, it is unclear whether it is possible to reproduce the colour-magnitude relation of early-type galaxies without drastically upsetting the agreement with the observed optical and near-IR luminosity functions [Kauffmann & Charlot 1998, CLBF]. The colour-magnitude relation of spiral galaxies is also poorly-reproduced [van den Bosch 2002]; this is a correlation that we investigate in depth in this paper.111Other approaches which include some of the CDM-motivated scaling laws but none of the hierarchical merging characteristic of the semi-analytic approach may not suffer from this limitation [Mo et al. 1998, Avila-Reese & Firmani 2000, Boissier & Prantzos 2000]. Because the modelling philosophy differs from that presented here, we do not discuss these ‘hybrid’ approaches further, referring the interested reader to the above works directly. In addition, the radial profiles of model spiral galaxies are roughly exponential, but inevitably have large, prominent central concentrations which are not seen in many later-type spiral galaxies [Dalcanton et al. 1997, van den Bosch 2001]. 222There are other challenges facing those wishing to understand galaxy formation. Most notable among these is the ‘angular momentum catastrophe’, the tendency of gas-dynamical simulations of galaxy formation to produce galaxies with up to an order of magnitude too little angular momentum to match the present-day galaxy population [White & Navarro 1993, Steinmetz & Navarro 1999]. This problem does not directly affect the semi-analytical approach because angular momentum is assumed to be conserved during galaxy formation, although the validity of this assumption is certainly questioned by these simulation results.
In this paper, we concentrate on the global properties of local spiral galaxy discs in the fiducial model of CLBF. By focusing on local discs, we can develop an understanding of how best to parameterise complex baryonic processes such as star formation and gas cooling, not only for this model, but for all models of this type. The plan of the paper is as follows. In section 2, we briefly discuss the model. In section 3, we outline which model observables we test against data, and describe the observational datasets used in these comparisons. In section 4, we compare model predictions for physical properties of spiral galaxies (such as luminosity, size or gas fraction) with the observations. In section 5, we compare the optical–near-IR colours of a diverse sample of spiral galaxies with the models, to elucidate their metallicities and SFHs. In section 6, we examine the observed and model present day star formation rates (SFRs). We discuss maximum-disc constraints on the model stellar mass to light ratios (M/Ls) in section 7. In section 8, we revisit the scale-size distribution of spirals (which was already discussed in CLBF), in the light of new data. In section 9, we present a discussion of the major discrepancies between the models and the observations, identifying a few possibilities for reconciling the two. Finally, we summarise our conclusions in section 10. Novel features of this paper include: a discussion of comparisons between the observed spiral galaxy scale-size distributions in different passbands with the spin parameter distribution predicted by galaxy formation models; an explicit comparison between the model and observed SF laws; a presentation of a novel method for comparing models with inhomogeneously-selected datasets; a discussion of age and metallicity effects on the spiral galaxy colour-magnitude relations; and, a demonstration of the utility of comparing spiral galaxy M/Ls and their luminosity-linewidth relation to models, simultaneously. We set hereafter unless stated otherwise.
2 The galaxy formation model
The semi-analytic model used in this paper is comprehensively described by CLBF. A cursory outline of the model is as follows: (i) The growth of dark matter haloes through mergers and accretion is followed using a Monte-Carlo algorithm. (ii) The lowest mass branches of the dark matter halo merger tree are filled with hot gas, which is assumed to be shock-heated to the virial temperature of the halo. (iii) Gas is allowed to cool by atomic radiative processes. (iv) Cooled gas is turned into stars according to an adopted star formation law. (v) The return of energy into the cooled gas, by stellar winds or supernovae, reheats a fraction of this gas, thereby providing a feedback mechanism to regulate star formation; this is particularly effective in low circular velocity haloes. (vi) Galaxies merge with the central galaxy in a halo if their dynamical friction timescale is shorter than the lifetime of the host dark matter halo. A violent merger is marked by a burst of star formation and the destruction of any stellar disc. The semi-analytic model of CLBF follows the chemical evolution of gas and stars and uses the Bruzual & Charlot stellar population synthesis model to compute the luminosity of a galaxy in any desired passband.
Here, we provide only a brief description of the physical processes which we show have a direct bearing on the properties of disc galaxies: gas cooling and disc formation, star formation and feedback, and the chemical and stellar evolution of galaxies. We discuss in section 9 what changes are produced in the model predictions if some of the prescriptions adopted by CLBF are varied. We note that the fiducial model of CLBF assumes a baryon density a factor of two lower than subsequent measurements have indicated [O’Meara et al. 2001, Spergel et al. 2003]. We discuss the effects of cosmic baryon density later in section 9.
2.1 Gas cooling and disc formation
Motivated by the results of extensive -body simulations, the dark matter is assumed to follow a Navarro, Frenk & White [Navarro et al. 1995, Navarro et al. 1997, NFW hereafter] density profile. Haloes also have a hot gas component which is assumed to have been shock-heated to the virial temperature of that halo during that halo’s collapse. Motivated by the simulations of Eke et al. [Eke et al. 1998], we assume that the hot gas follows a -model profile, , where is the core radius of the gas distribution. The core radius starts as a constant fraction of the halo size, and grows as low entropy gas cools (the growth is roughly a factor of four by the present day). The rate at which gas cools is density and metallicity-dependent, and is quite sensitive to this hot gas density profile: this means that different assumptions about the density profile can produce significant changes in the formation history and angular momentum content of present-day discs (although comparison of gas-dynamical models and the semi-analytic prescription have given a reassuring overall agreement; Benson et al. 2001; Helly et al. 2002b).
The dark matter and hot gas have angular momentum, imparted by tidal torques. The magnitude of the dark matter and gas angular momentum are characterised by the dimensionless spin parameter , where , , and are the total halo mass, angular momentum and energy. Motivated by the -body simulations of Cole & Lacey [Cole & Lacey 1996], we adopt a log-normal distribution of with mean 0.039 and logarithmic width 0.53. This distribution agrees with more recent determinations [Lemson & Kauffmann 1999, Bullock et al. 2001]. In order to estimate the radial distribution of angular momentum in the halo and gas, we choose to adopt a constant mean rotation velocity within the halo as a function of radius, broadly consistent with the results of Cole & Lacey [Cole & Lacey 1996]. During cooling and collapse we assume that the gas conserves angular momentum and forms a disc. The assumption of conservation of angular momentum leads to good agreement between predicted and observed galaxy sizes (e.g., Mo, Mao & White 1998, CLBF). However, this assumption is not supported by gas-dynamical simulations of galaxy formation which include radiative cooling, but no effective stellar feedback. In these gas-dynamical simulations, the gas transfers most of its angular momentum to the dark haloes, resulting in galaxy sizes that are much smaller than observed [White & Navarro 1993, Steinmetz & Navarro 1999]. Feedback from star formation may promote conservation of angular momentum, leading to better agreement with observed disc sizes (e.g., Weil, Eke & Efstathiou 1998; Thacker & Couchman 2001). In order to be consistent with the observed distribution of disc sizes, we assume that angular momentum is conserved; we leave the mechanism by which it is conserved as an as yet unanswered question.
In this paper, we compare the properties of observed field spiral galaxies with central halo disc-dominated galaxies in haloes less massive than M☉. This selection is made because observationally, our sample galaxies are typically reasonably isolated, or are at least the dominant members of their group, and M☉ is the halo mass of a large group or small cluster. We do not compare the observations with model satellite galaxies. Gas is assumed to cool only onto the galaxy at the centre of a halo (see van Kampen, Jimenez & Peacock 1999 for an alternative cooling model). Thus, satellite galaxies are starved of a fresh infalling gas supply, and quickly fade and redden. It is impossible to test the accuracy of this assumption using observations of what are more than likely to correspond to central halo galaxies in our model. Including satellite galaxies in the comparisons with the observed data leaves our conclusions regarding luminous discs unchanged; however, it would introduce a substantial population of non-star-forming, red discs at lower luminosities (in clear conflict with the data).
2.2 Star formation and feedback
Gas is converted into stars at the rate , where is the SFR, is the mass of cold gas, and is the timescale for star formation. This timescale is related to the disc dynamical timescale, , and the disc potential: , where is a star formation efficiency, is the circular velocity of the disc at the half-mass radius, and governs the galaxy mass dependence in the SF law. If , the star formation timescale is simply proportional to the disc dynamical timescale. CLBF’s fiducial model adopts to suppress star formation in smaller haloes, ensuring a good match to the observed high gas fractions of less luminous galaxies.
In this model, energy from supernovae and stellar winds ejects cold gas and metals from the disc into the halo. The mass of cold gas ejected into the halo is given by , where ; and are the parameters that govern the strength of the feedback process. The cold gas takes its share of metals with it into the halo. None of the freshly-synthesised metals are ejected directly into the halo. This freshly-ejected gas plays no role in gas cooling until is incorporated into a hot gas halo as a result of a galaxy merger. These parameter values are quoted for the fiducial model; in particular, was adopted so that the model predictions are in agreement with both the slope of the faint end of the luminosity function and the shape of the TF relation. Adopting a larger value of leads to excessive curvature in the TF relation (Cole et al. 1994). If feedback was not included, the luminosity function would be much steeper than that estimated from observations [Norberg et al. 2002, van den Bosch, Yang & Mo 2003, Benson et al. 2003b].
2.3 Chemical evolution, stellar populations and dust
Chemical evolution of the gas and stars is followed assuming that the initial reservoir of gas is free of metals. Metals are formed by stars and incorporated into the cold gas using the instantaneous recycling approximation [Tinsley 1980]. Furthermore, some of the cold gas may be ejected into the halo, taking with it its share of metals.
The luminosities, spectra and integrated colours of the stellar components are modelled using the stellar population synthesis (SPS) models of Bruzual & Charlot (in preparation), which are described in more detail in Lui, Charlot & Graham [Liu et al. 2000] and Charlot & Longhetti [Charlot & Longhetti 2001]. The models allow for a wide range of stellar ages and metallicities. Briefly, stellar populations with older ages or higher metallicities are redder and fainter (because of lower mean stellar temperatures) than populations which are younger, or have lower metallicity. Uncertainties in the predictions of the colours, luminosities and spectra of SPS models for older stellar populations are 10 per cent [Charlot, Worthey & Bressan 1996].
We assume a universal stellar initial mass function (IMF): the one adopted by Kennicutt [Kennicutt 1983]. This IMF is similar to a Salpeter [Salpeter 1955] IMF at the high mass end (and therefore has similar colours), but has fewer low mass stars (and therefore has a lower stellar M/L, by around a factor of two). In order to match the zero point of the luminosity function, the stellar M/L is increased by a factor of 1.38 (which was ascribed to a contribution to the total stellar mass from brown dwarves, but in reality simply reflects uncertainty in the shape of the IMF at low masses). This IMF, with this modification of stellar M/L, is consistent with estimates of and limits on stellar M/Ls (Bell & de Jong 2001; CLBF; see also section 7).
Dust affects the luminosities and colours of stellar populations. Dust is taken into account using the model of Ferrara et al. [Ferrara et al. 1999], which assumes a smooth dust distribution mixed in with the stellar disc. The overall optical depth of the galaxy is computed self consistently using the total mass of metals per unit area in the cold gas. The luminosities and colours of the model galaxies include the effects of dust, assuming a random distribution of galaxy inclinations degrees (in the case of the predictions presented in this paper). We choose this inclination distribution to mimic as closely as possible the observational selection of the Bell & de Jong [Bell & de Jong 2000] sample. The optical–near-infrared luminosity and colour effects of dust for degrees galaxies are relatively minimal in this model, and our results are not significantly affected by assuming a clumpy dust distribution [Granato et al. 2000], or by neglecting the effects of dust entirely ( mag and mag respectively, for the most dusty, usually most luminous model galaxies; these effects are smaller than the dust vectors in Figs. 3–7).
3 Comparing the model with observations
We select disc-dominated galaxies from the fiducial model of CLBF with -band bulge-to-disc ratios to compare with observations (see Baugh et al. 1996 for a plot of versus T-type). Different aspects of this comparison allow us to focus in detail on the following model features.
-
•
Differences in the luminosity function probe the physics of galaxy mergers and gas heating and cooling processes.
-
•
The colours of spiral galaxies are driven by their stellar populations, which in turn allow us to test the gas cooling, star formation and feedback prescriptions.
-
•
The SFRs of spiral galaxies primarily reflect the adopted star formation prescription.
-
•
The observational limits on the M/Ls of spiral galaxies depend principally on the IMF. When combined with the TF relation, further insight can be gleaned about the IMF and the fraction of dark matter contained within the inner parts of galaxies.
-
•
The sizes of spiral galaxies primarily constrain the adopted distribution of angular momentum or, equivalently, the halo spin parameter.
In this paper, we compare the model predictions with a number of datasets.
-
1.
An inhomogeneously-selected sample of 121 galaxies from Bell & de Jong [Bell & de Jong 2000]. This sample lacks a well-defined selection criterion; however, it has high-quality optical–near-IR colours at the disc half-light radius, accurate physical parameters, and is very diverse, allowing the exploration of the properties of a huge range of galaxy discs. It is a combination of three samples: de Jong [de Jong 1996], which is diameter-limited; Tully et al. [Tully et al. 1996], which is volume-limited (with magnitude and surface brightness cutoffs); and Bell et al. [Bell et al. 2000], which is selected to have low surface brightness (LSB), and as wide a range of luminosity, size and colour as possible. Due to the inhomogeneous selection, the selection of model galaxies for comparison with these observations is made by matching with the observed -band surface brightness and -band luminosity (and, therefore, to within a factor of two, the stellar surface density and mass; Bell & de Jong 2001) of each galaxy in the sample. This is discussed in more detail later.
-
2.
An inhomogeneously-selected sample of star-forming spiral galaxies from Kennicutt [Kennicutt 1998]. These galaxies have accurate H surface photometry and gas surface density maps, allowing the comparison of model and observed SF laws. Unfortunately, this dataset lacks surface brightness measurements, meaning that the selection technique described in (i) above cannot be attempted. A much cruder surface brightness limit is applied to the model galaxies in this case.
-
3.
We compare model stellar M/Ls with data from a complete sample of Ursa Major Cluster galaxies [Verheijen 1997].
In addition, we discuss observational data from some other papers [de Jong & Lacey 2000, Cross & Driver 2002, Kauffmann et al. 2003], and other model/observational comparison papers [de Jong & Lacey 2000, van den Bosch 2002, CLBF], when we feel that their discussion will prove useful.
4 Matching model galaxies to an inhomogeneous observational database: the physical properties of the Bell & de Jong sample


In this section, we introduce the method used to select model galaxies to compare with the inhomogeneously-selected dataset of Bell & de Jong [Bell & de Jong 2000]. We also discuss the luminosities, surface brightnesses and gas fractions of the model galaxies and examine how well they match the observations. We adopt total -band magnitudes corrected for Galactic foreground extinction following Schlegel, Finkbeiner & Davis [Schlegel, Finkbeiner & Davis 1998]. Central surface brightnesses are extrapolated disc-only central surface brightnesses, corrected to face-on assuming the optically-thin limit [Bell & de Jong 2000]. We do not account for dust extinction owing to dust in the individual galaxies, as this is accounted for in the galaxy modelling.
In Fig. 1, we show the physical properties (the -band absolute magnitude , the -band central surface brightness , the -band disc scale length , and the estimated total gas fraction, including Helium and molecular hydrogen, ) of the combined sample of 121 galaxies from Bell & de Jong [Bell & de Jong 2000]. We have chosen to take a simple approach to the selection of model galaxies for comparison with the data. For each observed galaxy, we searched for model galaxies within a locus of 0.4 mag radius in the plane. (The results are insensitive to the exact choice of size of the locus.) If five or more model galaxies are found within this locus, then we select five of them to compare with the data. We show observed galaxies matched in this way using solid circles in Fig. 1 (and Figs. 3–7 and 12). Some galaxies do not have five model analogues; these galaxies are left unmatched, and are denoted by open circles. Using this scheme, we ensure that we compare observed galaxies with model galaxies with appropriate luminosities and disc central surface brightnesses.
Examining the upper left-hand panel of Fig. 1, we see that there are 15 luminous, large scale-length, high surface brightness (HSB; with mag arcsec-2, corresponding roughly to mag arcsec-2) galaxies which remain unmatched in the plane. There are very few model disc galaxies in this area of the plane; de Jong & Lacey [de Jong & Lacey 2000] also noted a lack of very luminous spiral galaxies (see their Fig. 10). This is not a trivial discrepancy to rectify; this point is discussed further in section 9. This is also reflected in the scale-size distribution plane (upper right panel of Fig. 1).
The gas fractions of the observed and model galaxies are compared in the lower panels of Fig. 1. In Fig. 9 of CLBF, a reasonable match between the models and data as a function of -band absolute magnitude was demonstrated, although with an excess of model galaxies with low gas fractions (however, gas-poor satellite galaxies were included in this comparison). Yet, -band luminosities more directly reflect stellar mass [Bell & de Jong 2001], making a comparison in terms of -band instructive. We find a good match between the the trends in gas fraction with -band absolute magnitude and disc central surface brightness. There is a hint of an excess of low gas-fraction galaxies (as seen in CLBF). In Fig. 2, we show the cumulative distribution of observed galaxy gas fractions (solid line) and the model galaxies (dashed line). The dotted line shows the cumulative distribution of gas fractions for all observed galaxies, including those without matching model analogues. There is a clear but subtle excess of model galaxies at low gas fractions. A Kolmogorov-Smirnov test indicates that the distributions are different at much greater than 99.9 per cent confidence. Overall, however, it is fair to say that the gas fractions of the model galaxies are in reasonable agreement with the observations, with only a small excess of low gas fraction model galaxies.
Of particular interest is the tightness in the gas fraction–surface brightness correlation. The models do a reasonable job of reproducing the gas-fraction–magnitude and magnitude–surface brightness correlations (the left-hand panels of Fig. 1). However, when a scattered gas-fraction–magnitude correlation is convolved with a highly-scattered magnitude–surface brightness correlation, it is not obvious that a tight relation between surface brightness and gas fraction should result. Yet, the model gas fraction–surface brightness correlation is tighter than the gas fraction–magnitude correlation, in agreement with the data.
5 Spiral galaxy colours and SFHs

The optical–near-IR colours of stellar populations with ongoing star formation (such as those in spiral galaxies) can potentially provide a powerful insight into the SFHs and metallicities of those populations. Essentially, optical colours are sensitive to the position of the main sequence turn-off, whereas near-IR colours are more sensitive to the properties of the red giants and asymptotic giant branch stars. Using the optical and near-IR colours together, it is possible to differentiate between the effects of metallicity and, to first order, the ratio of young (2 Gyr) to old stars (which can be taken as an age, or a kind of birthrate parameter; de Jong 1996; Bell & de Jong 2000). The same principle underlies the estimation of ages and metallicities for elliptical galaxies, this time involving age- and metallicity-sensitive spectral lines [Kuntschner 2000, Trager et al. 2000].
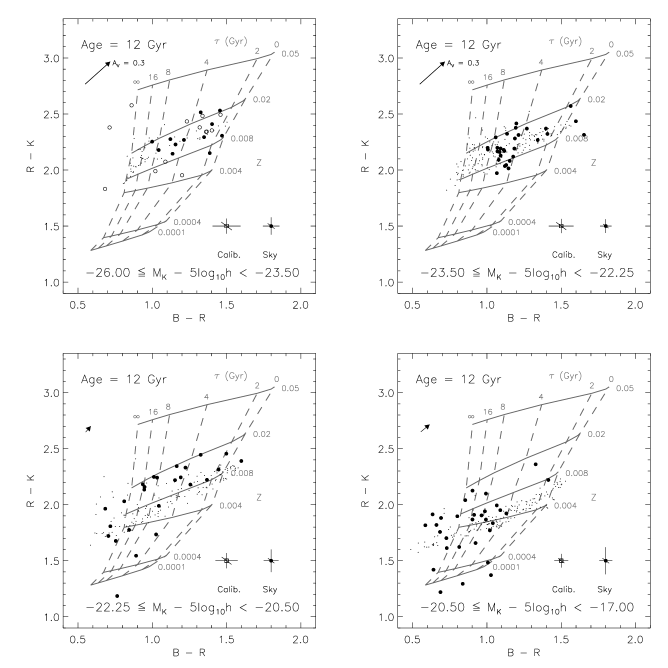
We compare the stellar populations of observed and model spiral galaxies using optical–near-IR colour-colour plots (Figs. 3–7). We show the against colours measured at the half-light radius for galaxies from the sample of Bell & de Jong [Bell & de Jong 2000] (111 out of the 121 galaxies have , and -band data). Radially-resolved colours were not used as CLBF treat their model galaxies as consisting of a bulge and disc component only. We compare with observed colours at the half-light radius because they are more accurate than extrapolated, total colours. We construct half-light radius colours for the model galaxies by adding the correct amount of “contamination” from the bulge at the disc half-light radius to the disc colours (a mag effect). The colours and luminosities include the effect of smoothly distributed dust, for a spiral galaxy with a randomly-distributed degrees, following the prescription of CLBF (see their section 2.3). Solid circles denote galaxies with at least five model galaxy matches in the plane; open circles denote unmatched galaxies (see section 4).
To give an impression of the trends expected in optical–near-IR colours resulting from changes in galaxy age and metallicity, we overplot stellar population models from Bruzual & Charlot (in preparation), as described in more detail by Liu, Charlot & Graham (2000). The model of Kodama & Arimoto [Kodama & Arimoto 1997], or the multi-metallicity Pégase stellar population model (see Fioc & Rocca-Volmerange 1997 for an earlier version of this model) give similar optical–near-IR colours. The stellar population models, like the models of CLBF, adopt the IMF used by Kennicutt [Kennicutt 1983]. These models assume an exponentially decreasing SFR with an -folding time , ; star formation is assumed to start 12 Gyr ago. Models with the same metallicity but different are connected by solid lines; models with different metallicities and the same are connected by dashed lines. The optical–near-IR colours are insensitive to modelling assumptions, such as the choice of IMF, the time at which star formation starts, and to reasonable variations in SFH [Bell & de Jong 2000, Bell & de Jong 2001]. Also overplotted are foreground dust screen models (upper panels), and the more realistic Triplex models (which have a mixed star/dust geometry; Disney, Davies & Phillipps 1989) with Milky Way (lower left panel) and Small Magellanic Cloud Bar (lower right panel) dust. Further description of the dataset, the stellar population models, model assumptions, and the dust models is given in Bell & de Jong [Bell & de Jong 2000].
Model galaxies, selected by their proximity to observed galaxies in the plane (again, 5 are plotted for every matched, observed galaxy), are denoted by dots. In Fig. 3, we show the trend in optical–near-IR colour with -band absolute magnitude, where bright galaxies are in the upper left-hand panel, going through to faint galaxies in the lower right-hand panel. The colours of the model galaxies match the observed colours well. To the extent that one believes that colours are a reasonable metallicity indicator333The main difficulty with this proposition is dust. While the models suggest that the effects of dust on the optical–near-IR colours will be modest, observational confirmation remains elusive. Work is ongoing with the Two Micron All Sky Survey and Sloan Digital Sky Survey to test the role of dust in the optical and near-IR in more detail., this indicates that the metallicity–luminosity relation for model spiral galaxies is a good match to the observed metallicity–luminosity relation. In contrast, CLBF found that the metallicity–luminosity relation predicted by the model was shallower than the gas metallicity–luminosity relation from Zaritsky, Kennicutt & Huchra [Zaritsky, Kennicutt & Huchra 1994]. There are no systematic trends in the model between the gas and stellar metallicities that would generate a difference in the slopes of the gas and stellar metallicity–magnitude relations. We note, however, that there is a disagreement between the observational datasets. Fig. 16 of Bell & de Jong [Bell & de Jong 2000] compares metallicities derived from the optical–near-IR colours with gas metallicities from Zaritsky et al. [Zaritsky, Kennicutt & Huchra 1994], amongst other studies. Where the colour-based metallicities are reasonably reliable (at metallicities 1 dex), Bell & de Jong [Bell & de Jong 2000] find that the colours suggest a shallower metallicity-luminosity relation and somewhat lower metallicities than the strong-line derived H ii region abundances (see, e.g., Kennicutt, Bresolin & Garnett 2003 for a discussion of the limitations of strong-line H ii region abundances). Thus, we conclude that the metallicity–luminosity relation of the CLBF model is in agreement with the data, to within the systematic uncertainties.
In contrast, the trends in observed colour with absolute magnitude are relatively poorly matched by the models (recall that colour is more sensitive to SFH than metallicity; Fig. 3). We explore this in more detail in Fig. 4, where we show the cumulative distribution of observed galaxies with model matches (solid lines) against the distribution of model galaxies (dashed lines), as a function of absolute magnitude. At high luminosities, model galaxies are mag bluer in colour than the observed galaxies, indicating that the luminous model galaxies have too much ongoing star formation. The distributions of model and observed galaxy colours are inconsistent at much greater than 99.9 per cent confidence. At lower luminosities, model galaxies cover the entire range of colours almost uniformly. This matches the observed dataset at moderate luminosity (e.g., for the interval , where the model and observed distributions are very similar, differing at only 33 per cent confidence). However, at the lowest luminosities, the observed galaxies tend to have , unlike the model galaxies which extend up to (indicating that many faint galaxies have too little ongoing star formation in the model). The distributions of observed and model colours differ at 99.95 per cent confidence. This model shortcoming could be related to a number of issues; we discuss this in more depth in section 9.
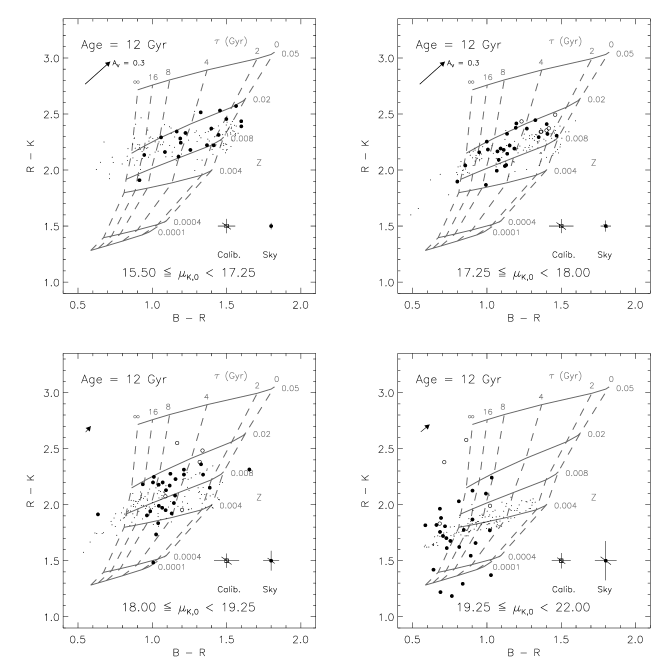
In Fig. 5, we show trends in optical–near-IR colour with -band central surface brightness. The model optical–near-IR colours match the observed colours reasonably well. It appears that the models produce somewhat too large a range in colour at any given surface brightness: however, a Kolmogorov-Smirnov test indicates similar distributions in model and observed colour, except for the lowest surface brightness bin, where the models are too red at 99.9 per cent confidence (the cumulative distributions are not shown for brevity). The trend in model colour with surface brightness matches the observations reasonably well. One interesting discrepancy is the rather wider range in colour shown by the observed LSB galaxies. The most luminous LSB galaxies are unmatched in the model (open circles), and we do not discuss them further here. However, less luminous LSB galaxies are observed to have a ‘tail’ down to very blue colours: . A value of this low is very difficult to produce from the stellar population synthesis models [Bell & de Jong 2000], and therefore this cannot be reproduced by the model of CLBF. This problem may indicate a limitation in the SPS models at the very lowest metallicities, or could be due to the inevitable difficulty in accurately measuring the -band magnitudes of very blue LSB galaxies (reflected in the sky subtraction error bars).
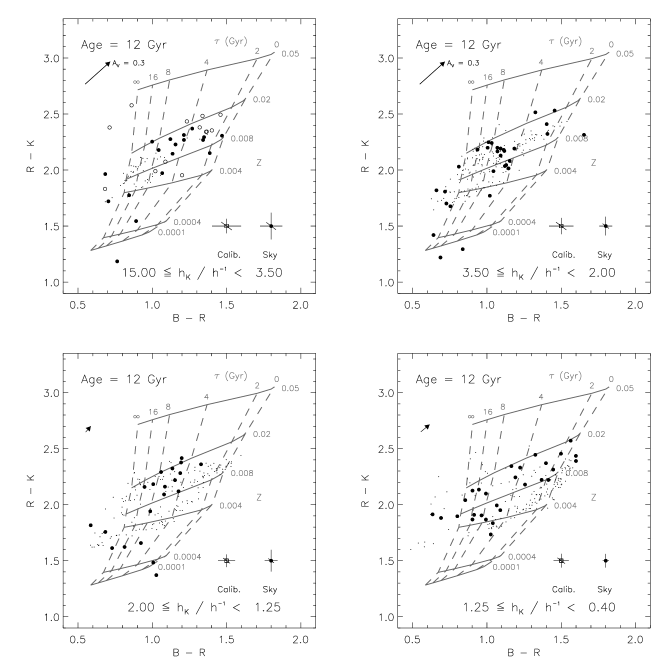
Observationally, there is no evidence for a trend in SFH with disc scale-size; see Fig. 6. The distributions of colours for small kpc model galaxies are not significantly different from the observed galaxies. Nevertheless, there is a tendency for small model galaxies to have a wide range in metallicities at a given age, and a wide range of ages (to first order, colour) in an absolute sense. Larger model galaxies are substantially less abundant (cf. the number of unmatched, large scale length, observed galaxies), and have a narrow range of metallicities at a given age, and a narrow range of absolute ages. The distribution of model colours of these largest galaxies differs from the observations at greater than 99.9 per cent confidence (again, the cumulative distributions are not shown for brevity).
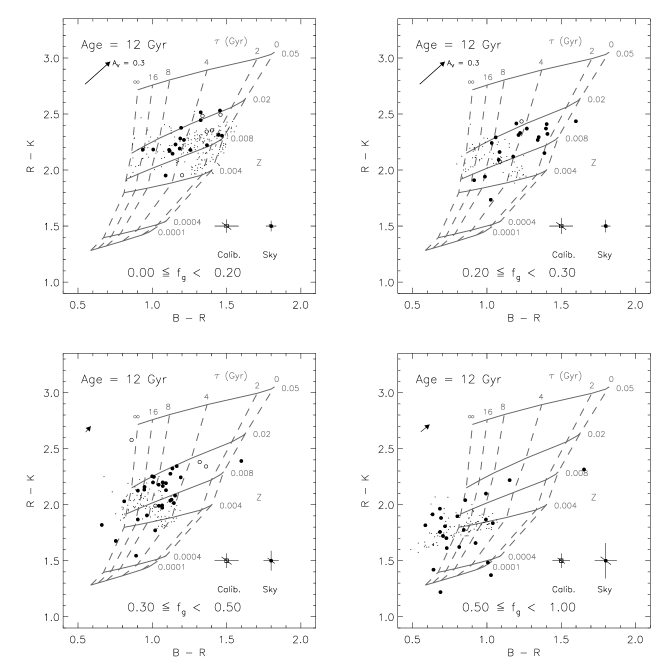
The model colours, binned by gas fraction (Fig. 7), are a good match to the observations, with the model and observed galaxies never differing at more than 99 per cent confidence. The overall correlation between age and metallicity (as probed by the colours) and gas fraction are as expected: old, metal-rich (and therefore highly evolved) galaxies are poor in gas, whereas younger, more metal-poor (therefore less evolved) galaxies are rich in gas.
6 The star formation law
Kennicutt [Kennicutt 1998] derived correlations between the SFR per unit area, , and i) the gas surface density, and ii) the ratio of the gas surface density to dynamical time, . Here, we test these data against the predictions of the CLBF model, using Kennicutt’s [Kennicutt 1998] observational dataset, converted to km s-1 Mpc-1 in Fig. 8. Total gas surface densities within R25 were estimated from the H i and H2 densities, multiplied by a factor of 1.35 to account for He. SFR surface densities within R25 (which include the effects of an average 1.1 mag. of extinction; Kennicutt 1983) were reduced by a factor of 0.7 to convert from the Salpeter [Salpeter 1955] IMF adopted by Kennicutt [Kennicutt 1998] to the Kennicutt [Kennicutt 1983] IMF plus 38 per cent brown dwarf fraction adopted in this work.
Model galaxy R25 values were estimated assuming exponential discs and law bulge profiles. Dynamical times at R25 were estimated using , where is the circular velocity of the disc in the disc plane at the disc half-mass radius due to the gravity of the disc, bulge and dark halo components (Appendix C of CLBF). The rotation curves of most galaxies are quite flat outside the half disc mass radius, making our approximation , where is the circular velocity at R25, not a particularly poor one. The time taken to complete one orbit is 2. Observationally, only 60 per cent of the gas content of spiral galaxies lies inside [Martin & Kennicutt 2001]. Since the models do not predict where gas should be within the model galaxies, we adopt a simplistic reduction of the model gas mass by 40 per cent before constructing the gas density.

It is apparent that the match between the model galaxy SFRs (points) and the observations (solid circles) is not unreasonable, when expressed either in terms of the gas surface density or in terms of the ratio of the gas surface density and the disc orbital timescale. The clumping of model points with low SFR at higher gas densities is a possible discrepancy. However, because it is impossible to reproduce Kennicutt’s [Kennicutt 1998] galaxy selection, it is difficult to draw firm conclusions from the density of model points in certain areas of the plot. The lower envelope of the model points also depends somewhat on the surface brightness cutoff adopted when selecting the model galaxies. We adopt a -band central surface brightnesses cutoff of 22.5 mag arcsec-2. This surface brightness limit is appropriate, as LSB galaxies [Impey & Bothun 1997] would typically not make it into the NGC (from which most galaxies in the sample of Kennicutt 1998 are drawn). Changing this surface brightness cutoff moves the lower envelope of the model galaxies towards higher SFR densities at a given gas mass for a higher surface brightness cutoff.

The reasonable match with the right hand panel of Fig. 8 is expected: the SF law adopted in the fiducial model has the star formation timescale , and SFR . In the absence of the velocity-dependent part of the SF law, the model galaxies in the right hand panel would follow a straight line, with some spread due to the scatter in the ratio of the half-mass radius to R25. The distribution of model galaxies in that panel should therefore be a straight line with a slope of unity and a zero-point that depends relatively weakly on circular velocity. However, the reasonable match with the left hand panel is less trivial: a priori, it is not clear that a good match with a SF law defined in terms of would also result in a gas-density dependent Schmidt [Schmidt 1959] SF law.
The origin of the similarity between the right and left hand panels of Fig. 8 is a close correspondence between the ratio of the gas surface density to the dynamical time and the gas surface density for both the real and model galaxies (Fig. 9). This is driven primarily by the gas density term in each quantity (the solid line denotes the fit to the data with a slope of unity). However, signatures of the dynamical time term are visible, especially in the distribution of the model points. In particular, the dynamical time is largest for galaxies with gas surface densities between 10 M☉ pc-1 and 30 M☉ pc-1, and lower for galaxies with higher and lower gas densities within R25. At the low density end, galaxy discs are smaller and typically low surface brightness, thus R25 is relatively small. These galaxies are also dark matter dominated, thus driving down the dynamical time, and driving up the ratio of gas surface density to dynamical time. At the high density end, the large surface density of baryons (and the attendant increase in dark matter density through the adiabatic response of the dark matter to the large baryon density) causes these galaxies to have shorter dynamical times. This can be illustrated very simply by neglecting the influence of dark matter, assuming gas fractions of order unity, and assuming that galaxies have identical R25; then , where is the gas surface density within R25. This would give (as denoted by the dotted line). Whatever the driving mechanism is that causes (weak) departures from a linear relationship between and , it is clear that SF laws formulated using either parameter are practically indistinguishable using present-day SFRs alone.
7 Stellar mass-to-light ratios
One of the most serious shortcomings of semi-analytic galaxy formation models is their inability to match the luminosity function and the zero-point of the Tully-Fisher (TF) relation simultaneously when the rotation velocity of the disc is properly constructed (e.g., White & Frenk 1991, Kauffmann et al. 1993; Cole et al. 1994; Heyl et al. 1995; Somerville & Primack 1999; CLBF). CLBF constrain their models to reproduce the -band and -band luminosity functions; however, these models fail to match the zero-point of the TF relation (when disc circular velocities are used the offset is 1 mag, or 30 per cent in terms of circular velocity, in the sense that galaxies are either too faint or they rotate too quickly). A fresh insight into the problem can be obtained by considering the mass-to-light (M/L) ratios of spiral galaxies. The zero-point of the TF relation is intimately related to stellar M/Ls: for example, larger stellar M/Ls than inferred from observation would lead to fainter galaxies, resulting in an offset from the zero-point of the TF relation. The stellar M/Ls of the models were discussed briefly in section 7.7 of CLBF and were found to be roughly consistent with observations. In this section, we discuss the stellar M/L of model and observed discs in greater detail; we discuss the relationship to the TF relation in more detail in section 9.3.
Observationally, stellar M/Ls are difficult to estimate reliably. M/L values in the solar neighbourhood are inferred using dynamical arguments and by direct accounting of the stellar mass (e.g. Binney & Tremaine 1987). Estimates of M/L in spiral galaxies can be obtained from (challenging) measurements of velocity dispersion, under some assumptions about the disc vertical structure [Bottema 1993, Bottema 1999, Swaters 1999]. Alternatively, upper limits on the stellar M/L can be derived from estimating the M/L required to maximise the contribution of the stars to the observed rotation curve: this is called the maximum disc stellar M/L estimate [van Albada et al. 1985, Swaters 1999].

Here, we focus on comparing model stellar M/Ls with observations of maximum disc stellar M/Ls. This is facilitated by recent results from Bell & de Jong [Bell & de Jong 2001], who argue that stellar M/L is primarily a function of colour, almost completely independent of SFH and model uncertainties. In Fig. 10(a), we compare the observed -band maximum disc stellar M/L estimates for spiral galaxies in the Ursa Major Cluster [Verheijen 1997] with stellar M/Ls from the fiducial model of CLBF, as a function of colour. The Ursa Major Cluster is assumed to have the HST Key Project distance of 20.7 Mpc; accordingly, for this discussion, we adopt the HST Key Project value of Hubble’s constant, , of km s-1 Mpc-1 [Sakai et al. 2000].
An important point is that the stellar M/L of a given observed galaxy cannot exceed its maximum disc value. Increasing the amount of dark matter in the inner parts of a galaxy requires a corresponding decrease in the stellar M/L, as shown by the arrows. The lower envelope of the observed galaxies is the key constraint: observed galaxies with maximum disc stellar M/Ls substantially larger than this lower envelope are likely to be dark matter dominated, primarily LSB, galaxies. The rotation curve of NGC 4085 suffers from substantial beam smearing, which artificially lowers the observed M/L. We therefore ignore this galaxy in the following discussion. Further discussion of the sources of error in, and the implications of, this plot are presented in Bell & de Jong [Bell & de Jong 2001].
From Fig. 10(a) it is clear that the model galaxies have stellar M/Ls which are consistent with the M/L values inferred using the maximum disc assumption (in agreement with CLBF’s less detailed analysis of spiral discs). However, galaxies in the semi-analytic model are in fact poorly described by the maximum disc model as they have a significant amount of dark matter within the half-light radius of the disc. This is clearly shown in Fig. 10(b), in which we plot the M/L for model galaxies using a dynamical estimate of the mass contained within the half mass radius, derived from the rotation speed. The inclusion of the dark matter component increases the scatter in the model M/L values and also shifts the lower envelope upwards by around 60 per cent. This effect is similar in size to the offset in the zero-point of the TF relation. Possible solutions to this discrepancy are discussed later in section 9.3, and include a reduced amount of dark matter in the inner parts of galaxies, and a reduced stellar M/L.
8 The spin distribution of spiral galaxies
The distribution of disc scale-sizes, as a function of luminosity, is a powerful test of the assumed distribution of initial halo angular momentum, under the assumption of angular momentum conservation during disc formation. The disc sizes were calculated by equating the disc specific angular momentum with the mean specific angular momentum of the cooled gas, accounting for the dark matter and gas profiles, disc self-gravity, the gravitational influence of the halo and bulge, and adiabatic contraction of these components as a response to disc formation [Mo et al. 1998, CLBF]. The form of the distribution of halo specific angular momentum has been firmly established by -body simulations (e.g., Barnes & Efstathiou 1987; Efstathiou et al. 1988; Zurek, Quinn & Salmon 1988). The logarithmic width of the distribution of the dimensionless spin parameter, is , essentially independently of galaxy halo parameters [Barnes & Efstathiou 1987, Frenk et al. 1988, Cole & Lacey 1996, Lemson & Kauffmann 1999, Bullock et al. 2001]. At low luminosities, the scale-size distribution also tests the feedback model. In fact, the strength of feedback is tuned, in part, to reproduce the observed trend in the scale-size distribution as a function of luminosity (CLBF).
The distribution of scale-size as a function of luminosity was tested by both CLBF (their fig. 8) and de Jong & Lacey [de Jong & Lacey 2000, their fig. 10] against de Jong & Lacey’s [de Jong & Lacey 2000] 1000-galaxy -band dataset. Both studies found a reasonable match between model predictions and observations. The median scale lengths, and the trend in median scale length with luminosity, are well-reproduced by the model. However, the model distribution is somewhat wider than the observed distribution: in the model of CLBF, , whereas the observations indicate . Because is believed to be independent of halo properties, this is not a trivial discrepancy to rectify. Possible solutions were discussed by de Jong & Lacey [de Jong & Lacey 2000], and include disc instabilities and the adoption of thresholds for star formation and feedback (e.g. Martin & Kennicutt 2001).
Since then, there have been three papers which have published determinations of the width of the scale-size distribution: Cross & Driver [Cross & Driver 2002] with a 45000-galaxy sample from the Two degree Field Galaxy Redshift Survey [Colless et al. 2001], and Kauffmann et al. [Kauffmann et al. 2003] and Shen et al. [Shen et al. 2003] with 120000-galaxy samples from the Sloan Digital Sky Survey [York et al. 2000]. Whereas the hybrid stellar mass–-band determination of Kauffmann et al. (2003) yielded a distribution with a width equivalent to , Cross & Driver’s [Cross & Driver 2002] photographic sample gave a spin distribution width of only ! Shen et al.’s [Shen et al. 2003] distribution showed in -band, with galaxies having lower valies of . We note that Shen et al. present simple model-based interpretation of this distribution (in the spirit of Mo et al. 1998), which we do not discuss further here.
However, these seemingly discrepant results (with widths of 0.25 in -band, 0.35 in -band around and in -band, and 0.45 in terms of stellar mass) can, in fact be explained if variations in the stellar populations and the dust content of spiral galaxies are taken into account. The scale-size–luminosity distribution can be thought of as a surface brightness–luminosity distribution, by noting that , where is the luminosity, is the surface brightness and is the scale-size. Thus, effectively, what is sought is the width of the stellar surface density–stellar mass distribution, whereas what is observed is the surface brightness–luminosity distribution. It is well-known that there is a correlation between surface density and SF history, such that at low surface density, galaxies tend to have rather younger mean stellar ages (and therefore lower stellar M/Ls, especially so in bluer bands; Bell & de Jong 2001) than higher surface density galaxies [Bell & de Jong 2000, Kauffmann et al. 2003]. Furthermore, higher surface density galaxies will tend to have somewhat more dust because of the combined effect of higher surface density and higher metallicity [de Jong & Lacey 2000, Bell 2003]. Thus, at high surface density the surface brightness becomes somewhat lower, and for low surface density the surface brightness becomes somewhat higher (both trends are stronger in the bluer bands). Thus, the width of the surface brightness–luminosity distribution will be decreased compared to the surface density–mass distribution, particularly so in the bluer bands (as is observed, with in , 0.35 in , and 0.45 in terms of stellar mass).
Quantitatively, the magnitude of this effect can be crudely estimated using the results of Bell & de Jong [Bell & de Jong 2001] and the surface brightness-dependent dust correction of de Jong & Lacey [de Jong & Lacey 2000]. From the models of Bell & de Jong [Bell & de Jong 2001, see their Fig. 1], in the and bands is roughly proportional to and , respectively, where denotes the surface brightness in the -band. Using the -band as an example, the surface brightness is given by: , where is the luminosity surface density in -band, and is the mass surface density. Taking , where is the stellar surface mass density (this assumption makes only a % difference to the final answer), (the corresponding result in -band is ). Thus, differences in stellar M/L alone across the surface brightness distribution cause the distribution to decrease in width by 15% in -band and 30% in -band. The effect of dust is less trivial to estimate. de Jong & Lacey [de Jong & Lacey 2000] dust-correct their data to a face-on aspect, making the impact of dust extinction modest in this case and therefore relatively easy to deduce. de Jong & Lacey [de Jong & Lacey 2000] estimate a 5% effect on the -band half-light surface brightness, when going from an inclination of 60 degrees to face-on. It is perhaps not absurd to postulate a further 5% effect when going from face-on, extinguished, to face-on, dust-corrected. Using the extinction curve of Gordon et al. [Gordon et al. 1997] to estimate the effect in the -band (a factor of 2.75 greater than in the -band), and noting that Cross & Driver [Cross & Driver 2002] do not extinction correct their data (and, therefore, the correction from 60 degrees to unextinguished is perhaps more appropriate), leads to an estimate of around a 30% effect in band. Thus, the observed -band and -band widths of and correspond to “mass” widths of for -band, and a -band “mass” width of . Both values are fully consistent with Kauffmann et al.’s [Kauffmann et al. 2003] “stellar mass” value of and the theoretical estimates of . It should be borne in mind that these are rough estimates of this effect; more systematic investigation of the width of the luminosity–surface brightness (or scale-size) distributions as a function of passband will further test and refine this crude correction (Bell, McIntosh, Katz & Weinberg 2003, in preparation).
9 Discussion
Many of the properties of spiral galaxies are well-matched by the models of CLBF. For example, the gas fractions are quite well-matched, with only a small excess of gas-poor galaxies, the metallicities are matched to within the errors, the model scale sizes reproduce the data well, the optical–near-IR colours as a function of gas fraction are accurate, and the present-day SFRs are a good match to the observational data. Nevertheless, the keenest insight into the models is gained when exploring aspects that poorly match the observations. Therefore, we focus in this section on the discrepancies between the fiducial model and the observations. Sections 9.1 discusses the deficit of the most luminous model spiral galaxies, 9.2 discusses the ‘backwards’ optical colour–magnitude relation of model spiral galaxies, and section 9.3 explores the relationship between the model stellar M/Ls and the TF relation.
9.1 The deficit of luminous model spirals


Both the datasets of de Jong & Lacey [de Jong & Lacey 2000] and Bell & de Jong [Bell & Bower 2000] support the view that the models of CLBF under-produce luminous, large, spiral galaxies. We explore this deficit in more detail in Fig. 11. Two observational determinations of the -band luminosity function of late-type galaxies are shown by open symbols [Kochanek et al. 2001] and filled symbols [Bell et al. 2003]. The two studies morphologically classify their galaxies using totally different methodologies. Kochanek et al. [Kochanek et al. 2001] classify their galaxy samples visually, whereas Bell et al. [Bell et al. 2003] use the Sloan Digital Sky Survey -band concentration parameter to classify the galaxies, following Strateva et al. [Strateva et al. 2001]. The model -band luminosity function for galaxies with in -band is shown by the solid blue line. The faint end slope of the observations and models are different; at least part of this discrepancy is because of incompleteness in the Two Micron All Sky Survey with respect to low surface brightness galaxies [Bell et al. 2003], although some of this discrepancy may be real. Significantly, the luminosity function of galaxies with -band cuts off sharply above , in clear contrast to the observational data. Because the parameters of the CLBF model are chosen to reproduce the total observed local luminosity function closely, it is challenging to construct a model which produces more luminous spiral galaxies without violating the constraints of the overall luminosity function. Because of this, there are two possible solutions to these problems: first, that many of the most luminous model galaxies are being incorrectly converted into ellipticals; and second, that the prescription for the accretion of gas by spirals may require modification.
The first possibility is that the underproduction of bright spirals is linked to deficiencies in the parameterisation of the physics of galaxy mergers. The mass ratio at which (major) mergers transform spirals into ellipticals is tuned to reproduce the morphological mix of galaxies brighter than . Nevertheless, there are a number of bulge-dominated galaxies in haloes less massive than 10 with and with magnitudes up to . If mergers were, for some reason, less effective in transforming spirals into ellipticals, it may be possible to produce a larger population of red, massive spirals. This could be achieved by altering the prescription for redistributing the disc stars after a major merger; for example, a good fraction of the pre-existing stellar population could be transferred to a thick disc instead of being assigned to a spheroid component (see, e.g., Dalcanton & Bernstein 2002). Alternatively, the dynamical friction calculation of orbital decay may underestimate the merger timescale due to the neglect of mass stripping from the satellite [Benson et al. 2003a]. To explore the possibility that galaxies could be mislabeled in the model, we extend the comparison with observation in Fig. 12 to include model galaxies with . Using this extreme cut-off, the model produces as many luminous galaxies as required (to within the typing uncertainties). Furthermore, these additional galaxies are very red, bettering the match between model and observed luminous spiral galaxies. Such an extreme shift in the boundary of the ratio demarcating spirals and ellipticals is a highly unattractive option, however, as this would grossly violate the constraints on the morphological mix of bright galaxies, and substantially under-produce the observed luminosity function of early-type galaxies.
The other possibility is that the prescription for accretion of cool gas by spiral galaxies may require modification. This could be modelled by changing the gas cooling prescription. Indeed, when CLBF changed the density profile of cooling gas, the bright end of the luminosity function was substantially affected (their fig. 6, panel c). The -profile adopted by CLBF was chosen as it is in good agreement with the results of numerical simulations [Eke et al. 1998]. Furthermore, comparisons of gas cooling in semi-analytic and gas-dynamical simulations have, rather encouragingly, given, similar results overall [Benson et al. 2001a, Helly et al. 2002b, although see Katz et al. 2002 for a differing viewpoint]. An interesting and potentially fruitful approach (which is beyond the scope of this paper) would be to search for a physical motivation for a modification of the gas cooling which allows more gas inflow at earlier times (to produce brighter, discy galaxies) and less infall now (to produce redder bright galaxies) to address both the under-production of large, bright spiral galaxies and the rather blue colours of bright model spiral galaxies.
Another way to vary the amount of gas accreted by spiral galaxies is to modify the feedback prescription. We examine a variant of the CLBF fiducial model in Fig. 13. In this new model, the baryon density is twice the value used by CLBF, in line with recent constraints on primordial nucleosynthesis inferred from quasar absorption line studies [O’Meara et al. 2001, Spergel et al. 2003]. A further key change is that some fraction of the gas reheated by feedback is permanently ejected in a “superwind” [Benson et al. 2003b]. The removal of baryons by the superwind has the consequence that fuel is removed from the more massive galaxies that form later on in the hierarchy. The superwind model does somewhat better than the fiducial model of CLBF at reproducing large scale length, bright spirals. This strong feedback delays gas cooling to somewhat later epochs, yielding larger galaxy sizes. The feedback does not delay this gas cooling too long, however, and indeed is efficient enough to substantially suppress very late gas cooling, yielding relatively red colours for these large scale-length galaxies. Typically, models with a “high” baryon fraction ( as opposed to the value of adopted in the fiducial model of CLBF) require a significant fraction of brown dwarfs to be invoked in order to match the luminosity function at . This is not the case in the superwind model, which predicts M/Ls in line with those presented in Section 7 (because baryons that would have been locked up into brown dwarfs in a high baryon fraction model without superwinds are incorporated in these energetic winds and lost forever in the superwind model). A significant challenge to this model, however, is the stringent energetic requirement: the amount of energy required to eject the gas exceeds that available in stellar winds and supernovae, necessitating a significant contribution from active galactic nuclei [Benson et al. 2003b].
9.2 The colour–magnitude relation of spiral galaxies
Arguably the most significant discrepancy between the models and the data is the ‘backwards’ colour–magnitude relation. The data clearly indicate that bright spiral galaxies are redder in the optical than fainter spiral galaxies. In contrast, the models predict that fainter spiral galaxies should be slightly redder than bright spiral galaxies (Figs. 3 and 4). This result is robust to modest changes in the limits we adopt, up to . A more sophisticated dust model is unlikely to help in this respect, as we saw earlier that varying the dust prescription produced only a very minor effect (much smaller than the discrepancy discussed here), and in any case would not address the red colours of the faint model disc galaxies. That the models should predict that the colours of luminous spiral galaxies would be bluer than their fainter counterparts is relatively easy to understand. Hierarchical galaxy formation models predict that small halos are assembled before larger haloes; therefore, it is natural to find that more massive galaxies in larger haloes should have bluer colours, indicative of younger stellar populations, than those of less massive galaxies in smaller haloes. Thus, the challenge is to find a mechanism which can override this natural sequence of formation by ensuring that the stellar populations ending up in more massive spirals today can form earlier than those ending up in less massive spiral galaxies. We discuss three possible remedies for this discrepancy: varying the definition of the model spiral galaxies, varying the prescription for turning gas into stars, and varying the amount of gas in the galaxies in the first place.
One of the options discussed in section 9.1 for increasing the numbers of luminous spiral galaxies was making morphological transformation from a disc-dominated to a spheroidal galaxy more difficult. This increases the number of red galaxies in the most luminous bin (the right hand panel of Fig. 12), in better accord with the observations. This comes, however, at the cost of violating constraints set by the morphological mix of galaxies, making this option relatively unattractive. Furthermore, this does not affect the faint model galaxy colours, which remain too red.
Another possible way to both redden the most luminous model galaxies and make the faintest model galaxies bluer is to modify the SF law. Indeed, Bell & Bower [Bell & Bower 2000] argued that a SF law of the type used here may imprint a weak ‘backwards’ optical colour–magnitude relation (brighter galaxies blue and fainter galaxies red). However, tests that we have carried out have shown that the use of (for example) a density-dependent star formation law does not significantly affect the colours of spiral galaxies in this model. Furthermore, van den Bosch [van den Bosch 2002] adopts a density-dependent Schmidt SF law in his semi-analytic model, and finds, if anything, a stronger ‘backwards’ colour–magnitude relation for spiral galaxies than the model explored in this paper.
Perhaps the most promising possibility for altering the colours of the brightest spiral galaxies is to modify the gas accretion prescriptions (as discussed above; this is also the favoured solution of van den Bosch 2002). Varying the amount of gas that cools onto luminous model galaxies can substantially change their recent SFH (as well as their luminosities; CLBF). However, a detailed exploration of this possibility is beyond the scope of this paper. Varying the amount of gas that can cool today through modifications to the feedback prescription (the superwinds model) does clearly produce a number of optically red, large scale length spiral galaxies, in much better agreement with the observations. However, as is expected for a model with very strong feedback at all galaxy masses, the metallicity–magnitude relation is somewhat too shallow (the metallicity, as measured by colour, is too low for the luminous spiral galaxies; not shown). Another significant challenge is that the strong feedback makes faint disc-dominated galaxies even redder than the fiducial model, exacerbating the already poor match between the red model galaxies and the observed blue galaxies. Further work is required to explore the origin of the spiral galaxy colour–magnitude relation in more detail.
9.3 Mass-to-light ratios and dark matter halo profiles
In section 7, we discussed the stellar M/Ls of model galaxies from CLBF, finding that they are as large as can be plausibly accommodated by the data. Thus, in order for the model galaxies to satisfy observed maximum disc constraints they must have little dark matter in their inner parts. However, in the fiducial model, typically 60 per cent of the mass in the inner half-light radius of the galaxy is non-baryonic dark matter (Fig. 10(b)). This is exactly the offset that the models have from the observed TF relation: the rotation speed (which is proportional to the square root of the enclosed mass) is too high at a given luminosity. This is the origin of the discrepancy between the good match to the luminosity function and the poor match to the zero-point of the TF relation.
This discrepancy could be alleviated by lowering the stellar M/Ls to become substantially sub-maximal, in concert with reducing the overall mass of baryons that end up in discs. This is achieved by CLBF in their model (which was considered by CLBF only to illustrate the effects of parameter changes on the results), which, because it is normalised to reproduce the luminosity function of galaxies, needs to produce the same amount of light with a smaller baryonic mass, leading to a lower stellar M/L. It is worth noting that this baryon density is four times lower than the current best estimate for the cosmic baryon density from both Big Bang nucleosynthesis [O’Meara et al. 2001] and the cosmic microwave background [Spergel et al. 2003], and is strongly ruled out — we discuss this case to illustrate lower stellar M/Ls only. This lower baryonic mass in the disc leads to less adiabatic contraction of the halo. For both reasons, disc circular velocities are lowered, leading to a smaller offset from the TF relation. The level to which all discs, even HSB spiral galaxies, could be sub-maximal is a matter of intense debate (see e.g. Courteau & Rix 1999; Weiner et al. 2001 and references therein). The tightness of the lower envelope of the observed stellar M/L–colour correlation in Fig. 10 suggests that at least the highest surface brightness galaxies have to be a roughly constant fraction of maximal (of course, maximal discs automatically adhere to that constraint).
Alternatively, the discrepancy could be alleviated by reducing the amount of dark matter in the inner parts of the galaxy, by for example changing the dark matter halo profile to have a flatter core. This has been suggested a number of times in the past, to better explain e.g. the rotation curves of LSB galaxies [de Blok et al. 2001], or lensing constraints on kpc scales in elliptical galaxies [Keeton 2001]. An ad hoc modification of this kind is relatively unattractive, at least from a theoretical point of view, given the strength of -body evidence indicating that cold dark matter haloes should be at least as concentrated as an NFW profile (NFW, Ghigna et al. 2000). Alternatively, adopting an alternative type of dark matter, such as warm dark matter (which leads to less concentrated haloes) may also solve this problem [Eke, Navarro & Steinmetz 2001].
10 Conclusions
We have compared the properties of local spiral galaxies with model spiral galaxies from the simulations of CLBF while taking into account observational selection and striving to construct model and observational quantities in very similar ways. In this fashion, we have undertaken a detailed exploration of baryonic processes such as gas cooling and the SF law.
Model successes include the following:
-
•
Model galaxy magnitudes, scale-sizes and gas fractions are in reasonable accord with the data (although there is a small excess of gas-poor model galaxies). Particular successes include a tight gas fraction–surface brightness correlation, and the variation in mean scale-size with luminosity.
-
•
We demonstrate that the seemingly narrow () spiral galaxy scale-size distribution derived from optical data is consistent with the the theoretically-favoured halo spin distribution, when one takes into account variations in stellar populations and dust content.
-
•
The model metallicity–magnitude relation is consistent with the data, to within the systematic uncertainties.
-
•
The model optical–near-IR colours match trends in the observed dataset well as a function of gas fraction, and to a certain extent scale-size and surface brightness.
-
•
The present-day SFRs of the model galaxies are in reasonable agreement with the data. We find that it is practically impossible to differentiate between star formation laws that depend on density or on dynamical time based on global present-day SFRs alone.
-
•
Fiducial model stellar M/Ls are consistent with maximum disc constraints of local spiral galaxies. Substantially higher model stellar M/Ls are difficult to obtain using current stellar population synthesis models.
There are some interesting model shortcomings, which offer considerable insight into the models:
-
•
There is a deficit of luminous model spiral galaxies. Furthermore, the model has a ‘backwards’ colour–magnitude relation. An attractive possibility for resolving these discrepancies is the adoption of a gas cooling model that would lead to enhanced (suppressed) infall at earlier times for larger (smaller) galaxies. First promising steps have been taken by adopting a superwind model in which some fraction of the gas reheated by feedback is permanently ejected, thus suppressing cooling rates at low redshifts for bright galaxies. However, the faint galaxies become even redder, owing again to this strong feedback. Another possible solution might be a more accurate treatment of galaxy mergers which might suppress the number of major mergers that lead to the formation of elliptical galaxies.
-
•
The model produces stellar mass-to-light ratios which are similar to the values derived for many galaxies under the “maximum disc hypothesis.” Yet, there is a substantial dark matter component within the half-light radius of the model galaxies. This produces model discs which rotate too fast at a given luminosity, giving rise to the well-known offset between the observed and model TF relations. Possible resolutions of this discrepancy include lowering the model stellar M/Ls to substantially sub-maximal values, in concert with a reduction in the mass of baryons that ends up in galaxy discs, or modifying the dark matter halo profiles so that they have less dark matter in the inner parts of the galaxy.
Acknowledgements
We acknowledge useful conversations with Vincent Eke and Roelof de Jong. The referee, Frank van den Bosch, is thanked for helpful and constructive comments which improved the quality of this paper. This work was supported by the European Research Training Network Spectroscopic and Imaging Surveys for Cosmology. E. F. B. was also supported by NASA grant NAG5-8426 and NSF grant AST-9900789. C. M. B. acknowledges a Royal Society University Research Fellowship. This project made use of STARLINK facilities in Durham and was supported in part by the PPARC rolling grant in Extragalactic Astronomy and Cosmology at Durham.
References
- [Abadi 2003] Abadi M. G., Navarro J. F., Steinmetz M., Eke V. R., 2003, submitted to ApJ (astro-ph/0211331)
- [Avila-Reese & Firmani 2000] Avila-Reese V., Firmani C., 2000, RMxAA, 39, 23
- [Barnes 1992] Barnes J. E., 1992, ApJ, 393, 484
- [Barnes & Efstathiou 1987] Barnes J. E., Efstathoiu G., 1987, ApJ, 319, 575
- [Baugh et al. 1996] Baugh C. M., Cole S. & Frenk C. S., 1996, MNRAS, 283, 1361
- [Baugh et al. 1998] Baugh C. M., Cole S., Frenk C. S., & Lacey C. G. 1998, ApJ, 498, 504
- [Baugh et al. 1999] Baugh, C. M., Benson, A. J., Cole, S., Frenk, C. S. & Lacey, C. G. 1999, MNRAS, 305, L21
- [Bell 2003] Bell E. F., 2003, ApJ, 586, 794
- [Bell & Bower 2000] Bell E. F., Bower R. G., 2000, MNRAS, 319, 235
- [Bell & de Jong 2000] Bell E. F., de Jong R. S., 2000, MNRAS, 312, 497
- [Bell & de Jong 2001] Bell E. F., de Jong R. S., 2001, ApJ, 550, 212
- [Bell et al. 2000] Bell E. F., Barnaby D., Bower R. G., de Jong R. S., Harper D. A., Hereld M., Loewenstein R. F., Rauscher B. J., 2000, MNRAS, 312, 470
- [Bell et al. 2003] Bell E. F., McIntosh D. H., Katz N., Weinberg M., 2003, submitted to ApJ (astro-ph/0302543)
- [Benson et al. 2000] Benson A. J., Baugh C. M., Cole S., Frenk C. S., Lacey C. G., 2000, MNRAS, 316, 107
- [Benson et al. 2001a] Benson A. J., Pearce F. R., Frenk C. S., Baugh C. M., Jenkins A., 2001a, MNRAS, 320, 261
- [Benson et al. 2001b] Benson A. J., Frenk C. S., Baugh C. M., Cole S., Lacey C. G., 2001b, MNRAS, 327, 1041.
- [Benson et al. 2003a] Benson A. J., Frenk C. S., Baugh C. M., Cole S., Lacey C. G., 2003a, submitted to MNRAS (astro-ph/0210354)
- [Benson et al. 2003b] Benson A. J., Bower R. G., Frenk C. S., Lacey C. G., Baugh C. M., Cole S., 2003b, submitted to ApJ (astro-ph/0302450)
- [Binney & Tremaine 1987] Binney J., Tremaine S., 1987, “Galactic Dynamics”, Princeton University Press, Princeton, New Jersey
- [Boissier & Prantzos 2000] Boissier S., Prantzos N., 2000, MNRAS, 312, 298
- [Bottema 1993] Bottema R., 1993, A&A, 275, 16
- [Bottema 1999] Bottema R., 1999, A&A, 348, 77
- [Bullock et al. 2001] Bullock J. S., Dekel A., Kolatt T. S., Kratsov A. V., Klypin A. A., Porciani C., Primack J. R., 2001, ApJ, 555, 240
- [Charlot & Longhetti 2001] Charlot S. & Longhetti M., 2001, MNRAS, 323, 887
- [Charlot, Worthey & Bressan 1996] Charlot S., Worthey G., Bressan A., 1996, ApJ, 457, 625
- [Cole 1991] Cole S., 1991, ApJ, 367, 45
- [Cole & Lacey 1996] Cole S., Lacey C. G., 1996, MNRAS, 281, 716
- [Cole et al. 1994] Cole S., Aragon-Salamanca A., Frenk C. S., Navarro J. F., Zepf S. E., 1994, MNRAS, 271, 781
- [Cole et al. 2000] Cole S., Lacey C. G., Baugh C. M., Frenk C. S., 2000, MNRAS, 319, 168 (CLBF)
- [Colless et al. 2001] Colless M., et al., 2001, MNRAS, 328, 1039
- [Courteau & Rix 1999] Courteau S., Rix H.-W., 1999, ApJ, 513, 561
- [Cross & Driver 2002] Cross N., Driver S. P., 2002, MNRAS, 329, 579
- [Dalcanton & Bernstein 2002] Dalcanton J. J., Bernstein R. A., 2002, AJ, accepted (astro-ph/0207221)
- [Dalcanton et al. 1997] Dalcanton J. J., Spergel D. N., Summers F. J., 1997, ApJ, 482, 659
- [de Blok et al. 2001] de Blok W. J. G., McGaugh S. S., Bosma A., Rubin V. C., 2001, ApJ, 552, L23
- [de Jong 1996] de Jong R. S., 1996, A&A, 313, 377
- [de Jong & Lacey 2000] de Jong R. S., Lacey, C. G., 2000, ApJ, 545, 781
- [Disney et al. 1989] Disney M. J., Davies J. I., Phillipps S., 1989, MNRAS, 239, 939
- [Efstathiou et al. 1988] Efstathiou G., Frenk C. S., White S. D. M., Davis M., 1988, MNRAS, 235, 715
- [Eke et al. 1998] Eke V. R., Cole S., Frenk C. S., Henry J. P., 1998, MNRAS, 298, 1145
- [Eke, Navarro & Steinmetz 2001] Eke V. R., Navarro J. F., Steinmetz M., 2001, ApJ, 554, 114
- [Ferrara et al. 1999] Ferrara A., Bianchi S., Cimatti A., Giovanardi C., 1999, ApJS, 123, 423
- [Fioc & Rocca-Volmerange 1997] Fioc M., Rocca-Volmerange B., 1997, A&A, 326, 950
- [Frenk et al. 1988] Frenk C. S., White S. D. M., Davis M., Efstathiou G., 1988, ApJ, 327, 507
- [Ghigna et al. 2000] Ghigna S., Moore B., Governato F., Lake G., Quinn T., Stadel J., 2000, ApJ, 544, 616
- [Gordon et al. 1997] Gordon K. D., Calzetti D., Witt A. N., 1997, ApJ, 487, 625
- [Governato et al. 1998] Governato, F., Baugh, C. M., Frenk, C. S., Cole, S., Lacey, C. G., Quinn, T., Stadel, J., 1998, Nature, 392, 359.
- [Granato et al. 2000] Granato G. L., Lacey C. G., Silva L., Bressan A., Baugh C. M., Cole S., Frenk C. S., 2000, ApJ, 542, 710
- [Helly et al. 2002a] Helly J. C., Cole S., Frenk C. S., Baugh C. M., Benson A., Lacey C., 2002a, MNRAS, 338, 903
- [Helly et al. 2002b] Helly J. C., Cole S., Frenk C. S., Baugh C. M., Benson A., Lacey C., Pearce F. R., 2002b, MNRAS, 338, 913
- [Heyl et al. 1995] Heyl J. S., Cole S., Frenk C. S., Navarro J. F., 1995, MNRAS, 274, 755.
- [Impey & Bothun 1997] Impey C., Bothun G., 1997, ARA&A, 35, 267
- [Katz et al. 2002] Katz N., Keres D., Davé R., Weinberg D. H., 2002, in Putnam M., & Rosenberg J., eds., The IGM/Galaxy Connection—The Distribution of Baryons at , Kluwer, in press (astro-ph/0209279)
- [Kauffmann & Charlot 1998] Kauffmann G., Charlot S., 1998, MNRAS, 294, 705
- [Kauffmann & Haehnelt 2000] Kauffmann G., Haehnelt M., 2000, MNRAS, 311, 576
- [Kauffmann, White & Guideroni 1993] Kauffmann G., White S. D. M., Guideroni B., 1993, MNRAS, 264, 201
- [Kauffmann et al. 1999] Kauffmann G. Colberg, J. M., Diaferio A. White, S. D. M., 1999, MNRAS, 303, 188
- [Kauffmann et al. 2003] Kauffmann G., et al., 2003, MNRAS, submitted (astro-ph/0205070)
- [Keeton 2001] Keeton C. R., 2001, ApJ, 561, 46
- [Kennicutt 1983] Kennicutt Jr., R. C., 1983, ApJ, 272, 54
- [Kennicutt 1998] Kennicutt Jr., R. C., 1998, ApJ, 498, 541
- [Kennicutt, Bresolin & Garnett 2003] Kennicutt Jr., R. C., Bresolin, F., Garnett, D. R., 2003, ApJ, in press (astro-ph/0303452)
- [Kochanek et al. 2001] Kochanek C. S., et al., 2001, ApJ, 560, 566
- [Kodama & Arimoto 1997] Kodama T. & Arimoto N., 1997, A&A, 320, 41
- [Kuntschner 2000] Kuntschner H., 2000, MNRAS, 315, 184
- [Lacey & Silk 1991] Lacey C. & Silk J., 1991, ApJ, 381, 14
- [Lemson & Kauffmann 1999] Lemson G., Kauffmann G., 1999, MNRAS, 302, 111
- [Liu et al. 2000] Liu M. C., Charlot S., Graham J. R., 2000, ApJ, 543, 644
- [Martin & Kennicutt 2001] Martin C. L., Kennicutt Jr., R. C., 2001, ApJ, 555, 301
- [Mathis et al. 2002] Mathis H., Lemson G., Springel V., Kauffmann G., White S. D. M., Eldar A., Dekel A., 2002, MNRAS, 333, 739
- [Mo & Mao 2000] Mo H. J., Mao S., 2000, MNRAS, 318, 163
- [Mo et al. 1998] Mo H. J., Mao S., White S. D. M., 1998, MNRAS, 295, 319
- [Murali et al. 2002] Murali C., Katz N., Hernquist L., Weinberg D. H., Davé R., 2002, ApJ, 571, 1
- [Navarro & Steinmetz 2000] Navarro J. F., Steinmetz M., 2000, ApJ, 528, 607
- [Navarro et al. 1995] Navarro J. F., Frenk C. S., White S. D. M., 1995, MNRAS, 275, 720
- [Navarro et al. 1997] Navarro J. F., Frenk C. S., White S. D. M., 1997, ApJ, 490, 493
- [Norberg et al. 2001] Norberg P., et al., 2001, MNRAS, 328, 64
- [Norberg et al. 2002] Norberg P., et al., 2002, MNRAS, 336, 907
- [Nulsen & Fabian 1997] Nulsen P. E. J., Fabian A. C., 1997, MNRAS, 291, 425
- [O’Meara et al. 2001] O’Meara J. M., Tytler D., Kirkman D., Suzuki N., Prochaska J. X., Lubin D., Wolfe A. M., 2001, ApJ, 552, 718
- [Sakai et al. 2000] Sakai S., et al., 2000, ApJ, 529, 698
- [Salpeter 1955] Salpeter E. E., 1955, ApJ, 121, 61
- [Schmidt 1959] Schmidt M., 1959, ApJ, 129, 243
- [Schlegel, Finkbeiner & Davis 1998] Schlegel D. J., Finkbeiner D. P., Davis M., 1998, ApJ, 500, 525
- [Shen et al. 2003] Shen S., et al., 2003, submitted to MNRAS (astro-ph/0301527)
- [Somerville & Primack 1999] Somerville R. S., Primack J. R., 1999, MNRAS, 310, 1087
- [Somerville, Primack & Faber 2001] Somerville R. S., Primack J. R., & Faber S. M., 2001, MNRAS, 320, 504
- [Spergel et al. 2003] Spergel D. N., et al., 2003, submitted to ApJ (astro-ph/0302209)
- [Springel et al. 2001] Springel V., Yoshida N., White S. D. M., 2001, New Astronomy, 6, 79
- [Steinmetz & Navarro 1999] Steinmetz M., Navarro, J. F., 1999, ApJ, 513, 555
- [Strateva et al. 2001] Strateva I., et al., 2001, AJ, 122, 1861
- [Swaters 1999] Swaters R. A., 1999, PhD Thesis, Univ. Groningen
- [Thacker & Couchman 2001] Thacker R. J., Couchman H. M. P., 2001, ApJ, 555, L17
- [Tinsley 1980] Tinsley B. M., 1980, Fundamentals of Cosmic Physics, 5, 287
- [Trager et al. 2000] Trager S. C., Faber S. M., Worthey G., González J. J., 2000, AJ, 119, 1654
- [Tully et al. 1996] Tully R. B., Verheijen M. A. W., Pierce M. J., Huang J., Wainscoat R. J., 1996, AJ, 112, 2471
- [van Albada et al. 1985] van Albada T. S., Bachall J. N., Begeman K., Sancisi R., 1985, ApJ, 295, 305
- [van den Bosch 2000] van den Bosch F. C., 2000, ApJ, 530, 177
- [van den Bosch 2001] van den Bosch F. C., 2001, MNRAS, 327, 1334
- [van den Bosch 2002] van den Bosch F. C., 2002, MNRAS, 332, 456
- [van den Bosch, Yang & Mo 2003] van den Bosch F. C., Yang X., Mo H. J., 2003, submitted to MNRAS (astro-ph/0210495)
- [van Kampen, Jimenez & Peacock1999] van Kampen E., Jimenez R., Peacock J. A., 1999, MNRAS, 310, 43
- [Verheijen 1997] Verheijen M. A. W., 1997, PhD Thesis, University of Groningen
- [Weil et al. 1998] Weil M. L., Eke V. R., Efstathiou G., 1998, MNRAS, 300, 773
- [Weiner et al. 2001] Weiner B. J., Sellwood J. A., Williams T. B., 2001, ApJ, 546, 931
- [White & Frenk 1991] White S. D. M. & Frenk C. S., 1991, ApJ, 379, 52
- [White & Navarro 1993] White S. D. M. & Navarro J. F., 1993, MNRAS, 265, 271
- [White & Rees 1978] White S. D. M. & Rees M. J., 1978, MNRAS, 183, 341
- [Yang, Mo & van den Bosch 2003] Yang X., Mo H. J., van den Bosch F. C., 2003, 339, 1057
- [York et al. 2000] York D. G., et al., 2000, AJ, 120, 1579
- [Zaritsky, Kennicutt & Huchra 1994] Zaritsky D., Kennicutt Jr., R. C., Huchra J. P., 1994, ApJ, 420, 87
- [Zurek, Quinn & Salmon 1988] Zurek W. H., Quinn P. J., Salmon J. K., 1988, ApJ, 330, 519