On the origin of the X-ray emission from a narrow-line radioquasar at
Abstract
We present new X-ray observations of the narrow-line radioquasar RX J1011.2+5545 serendipitously discovered by . The flat X-ray spectrum previously measured by and is shown to be the result of a steep power law spectrum seen through a moderate intrinsic absorbing column (). The position of the X-ray source is entirely coincident with the nucleus of the radio source that we have resolved in new sensitive observations at 3.6 and 6 cm, implying that scattering in the radio lobes is not responsible for the bulk of X-ray emission. In the EPIC pn image, a faint patch of X-ray emission is apparent 14” to the NE of the main X-ray source. The former is positionally coincident with an apparently extended optical object with , but there is no associated radio emission, thus ruling out the possibility that this represents a hotspot in a jet emanating from the primary X-ray source. No reflection features are detected in the X-ray spectrum of the narrow-line radioquasar, although an Fe line with equivalent width of up to 600 eV cannot be ruled out.
keywords:
X-rays: galaxies, galaxies: active1 Introduction
One of the most debated aspects of the unification scheme for Active Galactic Nuclei (AGNs) is the origin of the difference between Radio-Loud (RL) and Radio-Quiet (RQ) objects. Whether or not an AGN is able to develop a large-scale jet must be somehow intimately related to the central engine, for example, to the spin of the black hole (Blandford & Znajek 1977). X-ray observations are particularly relevant to this issue, as X-rays are thought to arise mostly in the neighbourhood of the nucleus itself.
It was noted early on (Wilkes & Elvis 1987, Canizares & White 1989) that the X-ray spectra of RL AGN are generally harder than those of RQ AGN. Further, it was found that the circumnuclear environment of RL and RQ AGNs appears different: RL AGNs are often surrounded by cold absorbing material (see, e.g., Cappi et al. 1997, Sambruna et al. 1999) while many RQ AGN exhibit X-ray warm absorber features (Reynolds & Fabian 1995).
The origin of the apparently flat X-ray spectrum of RL objects was attributed to beamed emission, which would dominate over, if at all present, the Compton upscattering by relativistic electrons off the UV photons from the accretion disk in RQ AGN. The apparently flatter slope of the underlying unabsorbed spectrum in RL AGN (Cappi et al. 1997) lent some support to this. However, more recent work by Sambruna, Eracleous & Mushotzky (1999) demonstrates that the intrinsic power law (once absorption is accounted for) is very similar in RL objects with a double-lobe radio structure (i.e., not suspected of being beamed towards the observer) and RQ AGN (photon spectral index ).
Nevertheless there are differences in the X-ray emission properties of RL and RQ AGN, especially in the features that are thought to arise in the reprocessing of the primary radiation. Both the Fe K fluorescence line and the Compton reflection shoulder, ubiquitous in RQ objects (Pounds et al. 1990, Nandra & Pounds 1994), are typically weaker in RL objects (Sambruna et al. 1999). This probably implies a different structure in the inner accretion disk in RL and RQ objects. Mechanisms that suppress the reflected component include a truncated accretion disk converted into a geometrically thick structure (e.g. an ADAF, see Meier 2001), and reflection in an ionized disk (Ballantyne, Ross & Fabian 2002). Hasenkopf, Sambruna & Eracleous (2002) analyzed the and X-ray spectra of 3 moderate-redshift radioquasars with luminosities and found similar properties, i.e., presence of cold absorption and weak reflection components.
It is intriguing that absorption by cold material appears to play a role both in the distinction between RL and RQ objects as well as in the optical emission line properties of AGN. RQ narrow-line AGNs (Seyfert 2s) tend to be more absorbed than RQ broad-line AGNs (Seyfert 1s and QSOs) as predicted by the unified AGN scheme (Antonucci 1993). However a number unabsorbed Seyfert 2 galaxies has been found (Pappa et al. 2001, Panessa & Bassani 2002), lending some support to the idea that optical emission line properties are, at least in some cases, intrinsic to the Broad Line Region rather than modulated by reddening/absorbing material (Barcons, Carrera & Ceballos 2003).
In this paper we study a narrow-line radioquasar (RX J1011.2+5545) at , one of the few high redshift examples of this class. It was discovered in the Medium Sensitivity Survey (Carballo et al. 1995), where its PSPC X-ray spectral shape qualified it as the hardest of the sources in the survey. A subsequent follow-up (Barcons et al. 1998) revealed that its optical counterpart is a RL narrow-line QSO, where the CIII] semi-forbidden line has no detectable broad components, and MgII is extremely weak. The combined and X-ray spectrum suggested intrinsic absorption (at a low significance level) and also hinted an underlying flat X-ray spectrum. Barcons et al. (1998) derived an X-ray luminosity of and in the keV and keV bands respectively (, and used throughout). The double-lobed morphology of the radio counterpart ensures that beamed emission does not dominate the X-ray spectrum. This source is therefore an interesting example of an AGN that should be absorbed by cold gas, both because it is radio loud and because its optical spectrum exhibits very weak (if at all) optical broad emission lines.
2 X-ray observations
RX J1011.2+5545 was observed for about 33 ks by (Jansen et al 2001) on the 23 of November of 2001 during revolution 353, within the AO-1 programme. All the instruments were on, although the prime objective, given the flux of the source, was to use the EPIC cameras (Turner et al. 2001, Strüder et al. 2001). All the EPIC cameras were operated in full window mode and equipped with the ’Thin1’ filter. The observation data file was pipeline-processed by SAS v5.2, but the analysis presented here has been conducted entirely using SAS v5.3.3.
The EPIC event lists (MOS1, MOS2 and pn) were cleaned of high background flares, resulting in good-time intervals of 29.7, 30.0 and 24.6 ks respectively. Further filtering followed the standard procedures, keeping only single and double events and, in the case of EPIC pn, those with FLAG=0.
Since the X-ray data has to be compared to much better angular resolution optical and radio data, we also refined the astrometric solution of the pipeline event lists and images which is based on the attitude and orbit control system of the spacecraft. This astrometric solution is known to leave small (up to a few arcsec) but significant residuals. We then extracted all sources in the USNO-A2 catalogue in the EPIC field of view, and looked for a shift and rotation in the EPIC pn source list provided by the pipeline by using the internal SAS task eposcorr. A total of 47 X-ray to USNO-A2 matches were found, and the correction that we applied to the X-ray data was , and a rotation of .
2.1 X-ray morphology
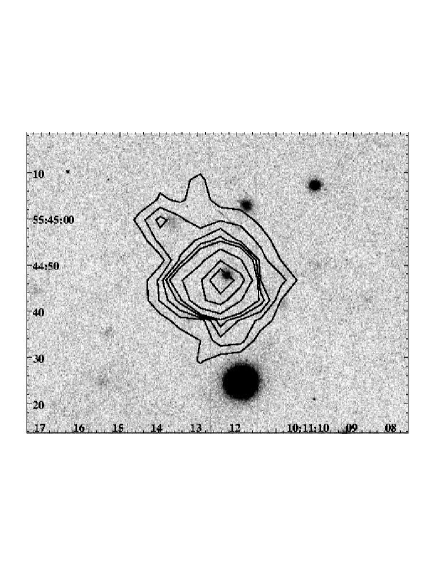
Our narrow-line radioquasar is well detected in all 3 EPIC cameras. Furthermore, in the EPIC pn and in the EPIC MOS1 cameras, the source shows some structure, in terms of X-ray emission towards the NE. Figure 1 shows the EPIC pn image in the keV band around the target, where the NE emission is most obvious. The MOS1 image shows a similar structure, but this NE emission is not present in the MOS2 data. We attribute this fact to the “triangular” shape of the point spread function (PSF) of the X-ray telescope corresponding to the MOS2 detector, which is highly asymmetric.
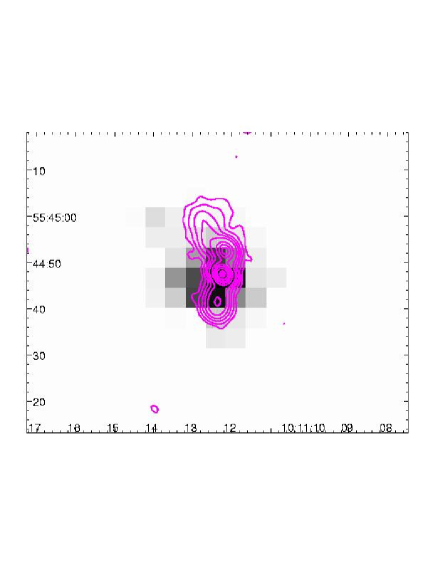
The pipeline processed source list for these data does not find a second source in the position of the NE extension, which lies approximately 14” away from the central source. We tried hard to modify the source finding algorithm parameters, lowering the detection likelihood to 6 (instead of 10) and enabling 2 sources to be fitted around each detection box. However, the SAS refused to find a source there. A test for extended emission only gave a marginal detection (likelihood ) in the MOS1 image.
In spite of this, it is clear from Fig. 1 that the X-ray emission is real. No other X-ray sources in the image show a similar patch in the same direction, thus ruling out a bad attitude solution origin for this second source. Our extracted spectrum for this source contains and background-subtracted counts in the EPIC pn and EPIC MOS1 images respectively (see sect. 2.2). Further support for the reality of this source comes from the positional coincidence of this X-ray emission with an extended optical source (see section 3). In what follows we will refer to this faint X-ray source as “source 2”, as opposed to “source 1”, which is the target object RX J1011.2+5545.
2.2 X-ray spectra
X-ray spectra have been extracted from the 3 EPIC cameras, first for the full emission complex (i.e., sources 1 and 2 together), as was done for the and data. Spectra were extracted around the centre of the target within a circle of 25 arcsec, resulting in background-subtracted counts for the EPIC pn spectrum and over background-subtracted counts in each of the EPIC MOS spectra. X-ray spectra were grouped in 10 count bins and counts below keV were ignored. No attempt was made to co-add spectra from different instruments, but instead they were fitted together.
In the Barcons et al. (1998) analysis of the and spectrum of this source, it was suggested that the X-ray spectrum could be intrinsically flat ( was the best fit) with some marginal evidence for absorption (99% level). We therefore fitted the spectrum with a single power law plus galactic absorption (fixed at ). The fit gave a very poor for 229 degrees of freedom, with the residuals immediatly suggesting the need for a further absorption component. Adding an intrinsic cold absorber at the redshift of the source gives a spectacular improvement with for 228 degrees of freedom. The F-test gives a significance of for absorption not being detected. The best-fit parameters are reported in table 1.
| Sources 1+2 | Source 1 | Source 2 | |
| – | |||
| Flux(0.5-2 keV)b | |||
| Flux(2-10 keV)b | |||
| /d.o.f. | 194.72/228 | 110.55/109 | 7.75/13 |
a Intrinsic absorbing column at in cm-2
b Corrected for Galactic absorption in units of
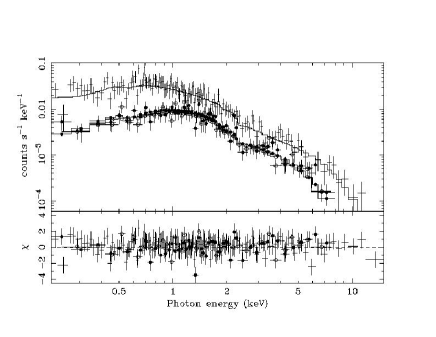
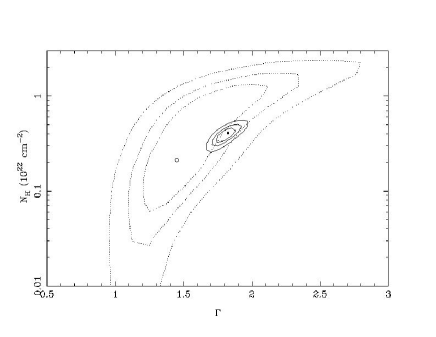
Figure 2 shows the measured X-ray (MOS1, MOS2, pn) spectra and the corresponding best fit models, together with a plot of the fitting residuals. Fig. 3 presents the confidence contours in the (,) parameter space, using the same parameter range as employed by Barcons et al. (1998) in their study based on (18 ks) and (52 ks) spectra (solid curves for XMM-Newton and dotted curves for and ). Besides highlighting the excellent capability of to perform X-ray spectroscopy of faint X-ray sources, Fig. 3 also shows that all data sets are consistent. The data, however, clearly rule out an intrinsically flat X-ray spectrum, and show that the spectral flatness inferred from the earlier data was due to a combination of a steep power law seen through a significant absorbing column.
We also attempted to fit an emission feature to the full 3 instrument X-ray spectra, at the expected position of the redshifted Fe K line. Hasenkopf et al. (2002) find line equivalent widths around eV in 3 radioquasars of similar X-ray luminosity. However, the residuals to the absorbed power-law fit to RX J1011.2+5545 do not show any hint of a significant positive deviation around keV, and indeed no improvement in the is achieved by adding a gaussian line. The 3 upper limit to the line equivalent width is keV, and slightly lower ( eV) assuming a line width keV. We have also tried to add a reflection component (via the pexrav model from Magdziarz & Zdziarski 1995), but the does not improve and returns a null value for the reflected component.
The fluxes (corrected for Galactic absorption) of the overall complex are shown in table 1. Note that these are entirely consistent with the and inferred fluxes, i.e., the source has not varied much after an interval of several years. The luminosity of the source is and in the 0.5-2 and 2-10 keV bands respectively. If we correct for the intrinsic absorption, these luminosities go up to and .
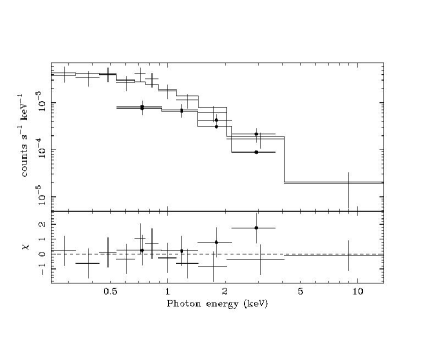
In the EPIC MOS1 and pn data, sources 1 and 2 can be separated (see again Fig. 1) and therefore we have extracted the spectrum of sources 1 and 2 independently from these data. In order to minimize the contamination of the tail of source 1 on the spectrum of source 2, conservative non-overlapping circles of radii 9.5 arcsec and 7.5 arcsec were choosen around the centre of sources 1 and 2 respectively. This gave pn and MOS 1 background-subtracted counts for source 1 and pn and MOS1 background-subtracted counts for source 2. The spectra of source 1 is virtually equivalent to the overall spectrum, as it contains more than 90% of the total flux (see best fit parameters in table 1.
3 optical observations
Given the interesting morphology of the EPIC X-ray image, the region around RX J1011.2+5545 was imaged in the optical with the 2.6m optical telescope in La Palma. The instrument ALFOSC was used with the Johnson R filter, for a total integration of 1 hour (splitted in two 30 min integrations slightly shifted) in service time on the 24th of October 2002. The observation was conducted in bright time and the average airmass was 1.6.
The images were reduced using standard IRAF reduction techniques, including debiasing, trimming, flat-fielding (using twilight flats) and finally registering both images to a common frame. The measured seeing in the resulting image is 1.37”. The astrometric calibration was done using the USNO-A2 catalogue. No photometric standard was observed, so we used the less sensitive image of Barcons et al. (1998) to perform the photometric calibration.
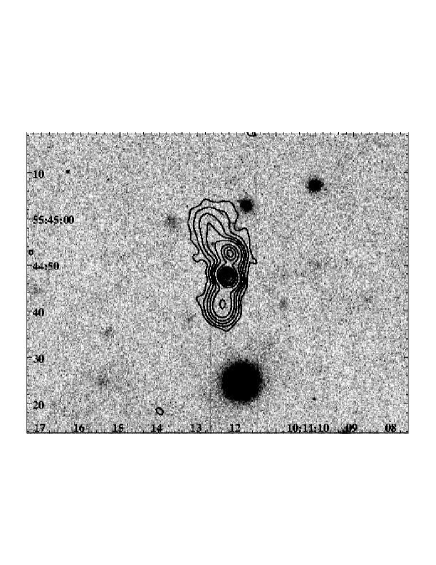
The image is shown in Fig. 5 along with contours from the EPIC pn X-ray image. It is then clear that source 1 is coincident with the optical counterpart identified in Barcons et al. (1998), with magnitude and that source 2 overlays with a fainter, extended optical source. This optical counterpart has a FWHM extent of 2.4 arcsec, while the seeing is 1.4 arcsec. We measure its magnitude by aperture photometry to be . This spatial coincidence lends further support to the reality of source 2.
4 radio observations
The source RX J1011.2+5545 is known to be a radio source, detected in various surveys, as previously discussed in Barcons et al. (1998). In particular, the FIRST-VLA data at 1.4 GHz resolved the radio source into two components, aligned approximately along the N-S axis, with a total integrated flux of Jy. Furthermore, it was also detected in the 7th Cambridge survey at 151 MHz as source 7C 434 with a flux of 1.2 Jy (Pooley, Waldram & Riley 1998).
Besides the double-lobed morphology of the source, the FIRST-VLA radio map shows a hint of extended emission from the northern lobe towards the NE. Since this is the general direction of source 2 detected in the EPIC pn image, we requested a deeper, better angular resolution observation of this source with the of the National Radio Astronomy Observatory (NRAO) as an ad hoc proposal.
The observation was conducted in November 13, 2002 with the C configuration. We choosed both 3.6 cm (8.4 GHz) and 6 cm (5 GHz) giving approximate beams of arcsec and arcsec respectively for natural weigthing (see below). Exposure times were selected in order to have a 3 sensitivity of approximately 0.1 mJy beam-1 at both frequencies. We recall that the FIRST-VLA survey at 1.4 GHz has a flux threshold a factor of 5 higher and a beam of arcsec. Since sources 1 and 2 are separated by 14”, the radio maps (even the early FIRST-VLA survey) should be able to clearly resolve both sources. Moreover (see section 5) in the event that source 2 corresponds to a knot in a jet emanating from source 1, a flux level of the order of mJy would be expected, and in this case a positive detection should be achieved with the obtained radio data.
The observation consisted of two snapshots of 10 minutes at 3.6 cm and two snapshots of 8 minutes at 6 cm on RX J1011.2+5545, preceded and followed by a 1.5 minute observation of the phase calibrator 1035+564. The amplitude calibrators used were 3C 48 at 3.6 cm and 3C 286 at 6 cm (we were forced to use different amplitude calibrators because of technical problems during the 3.6 cm snapshot of 3C 286). The data were edited and calibrated using standard procedures within the aips software package of NRAO. The maps shown here have been produced using self-calibration and natural weighting of the data, which are the most sensitive to extended and faint structures. The final 3 sensitivy is 0.07 mJy beam-1 at 3.6 cm and 0.09 mJy beam-1 at 6 cm.
| Component | 6 cm Flux | 3.6 cm Flux | |
|---|---|---|---|
| (mJy) | (mJy) | ||
| Tail | 7.3 | 3.9 | |
| N-lobe | 24.1 | 15.5 | |
| Nucleus | 19.9 | 23.7 | |
| S-lobe | 18.3 | 9.7 |
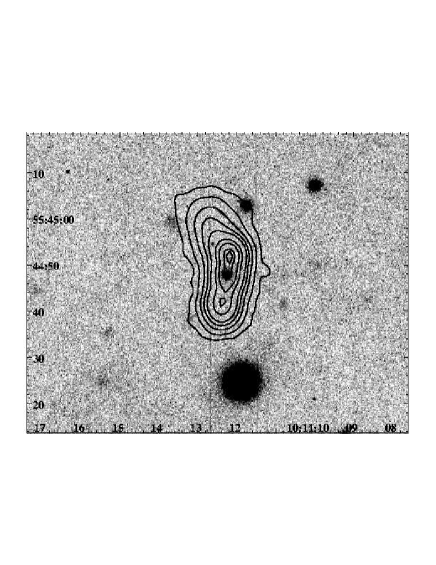
Fig. 6 shows the contours of the maps overlayed on the optical image. The 3.6 cm map clearly resolves the nucleus (concident with the optical counterpart of RX J1011.2+5545) and two lobes in the N-S direction. The 6 cm data exhibits the same structure, but without a clear separation between the northern lobe and the nucleus.
The variation in radio spectral index (defined as between the 3.6 and 6 cm bands) across the source ranges from to . Table 2 shows the radio spectral index at various locations of the radio source (see caption of Fig. 6 for definitions). The overall nucleus and double-lobe structure is consistent with a synchrotron self-absorbed nucleus plus ageing effects in the relativistic electron population along the lobes. The flatter spectral index of the N-lobe (as compared to the S-lobe) could be due to a variety of reasons, including the jet meeting a denser medium in the N-lobe zone, different ordering of the magnetic field, the orientation of the source etc. The steep-spectrum NE tail is consistent with freely expanding radio gas.
It is also clear from Fig. 6 that source 2 detected in the EPIC pn does not emit in radio, down to a 3 sensitivity below mJy at both 3.6 and 6 cm. To further emphasize this, we overlay the 3.6 cm contours on the EPIC pn image in Fig. 1 (see also Fig. 5 for the X-ray contours on top of the optical image). It can also be appreciated that, within the angular resolution, the X-ray emission matches very well that of the nucleus resolved by the radio maps with little contribution from the lobes.
5 Discussion and conclusions
5.1 The nature of source 2
Using the positions of the optical counterparts for sources 1 (, , J2000) and 2 (, , J2000) we can compute the possibility of finding two such close sources by chance. The relevant parameter is the source density at the flux of source 2 ( keV flux of ) which we take . The probability of finding source 2 within 14 arcsec of source 1, being unrelated, is . Although this is not a very significantly small number, we checked the possibility that source 2 could be somehow related to source 1.
We have further explored the possibility that source 2 results from the emission of a knot in a putative jet of source 1, should they be at all related. (Note, however, that the geometry of the radio maps does not suggest that hypothesis). Such knots have been found to be X-ray emitters in several objects, among them 3C273 (Marshall et al. 2001). If we take the A1 knot as quoted in Marshall et al. (2001), and scaling from the flux measured at keV from the data in source 2 () we would expect a radio flux around 6 cm of mJy. Our data, which sets a 3 upper limit of 0.1 mJy beam-1 at the position of source 2, clearly rules out that option.
We can therefore conclude that source 2 is a real X-ray source, with an optical counterpart of and to our knowledge unrelated to source 1.
5.2 The nature of the X-ray emission in the narrow-line radioquasar
The main conclusion of this work is that the X-ray emission properties of this narrow-line radioquasar are very similar to those of broad-line radioquasars of similar luminosity. The apparently flat X-ray spectrum found by and is the result of a steep power law (photon spectral index ) seen through an intrinsic absorbing column , in agreement with the results from Hasenkopf et al. (2002) for broad-line radioquasars of similar luminosity. The typically flatter spectral index attributed earlier to RL AGNs is totally excluded in this narrow-line radioquasar (see again Fig. 3). This confirms that relativistic beaming does not play a major role in its X-ray emission, as expected from the double-lobe radio morphology.
The X-ray spectrum displays moderate cold absorption (in excess of Galactic absorption), also in the same range as the Hasenkopf et al. (2002) broad-line radioquasars of similar luminosity (but lower redshift) . The overall spectral energy distribution (shown in Barcons et al 1998) is similar to the template for RL QSOs as shown in Fig. 10 of Elvis et al (1994), except for the harder X-ray slope resulting from intrinsic absorption.
The measured absorption column is, however, on the lower side of that expected for narrow-line AGN. Indeed, in a large sample of [OIII]-selected narrow-line RQ AGN (Seyfert 1.8, 1.9 and mostly 2 galaxies), Risaliti, Maiolino & Salvati (1999) found that the majority of these sources are absorbed by columns . This should be expected in the framework of the AGN unified model, where the lack or weakness of optical broad emission lines would be due to reddening by the same gas that absorbs soft X-rays. Nevertheless, a number of examples of RQ narrow-line Seyferts have been found with small or no cold absorbing column at all (Pappa et al. 2000, Panessa & Bassani 2002, Barcons et al. 2003). The narrow-line radioquasar studied here also belongs to this class of low-absorption column objects, where the lack of optical broad-lines is difficult to understand in terms of reddening/absorption and could be attributed to intrinsic properties of the broad line region.
It is also remarkable that no reflection features are present in this object, down to the sensitivity level of our rather high quality X-ray data. However the 3 upper limit found for the equivalent width of the Fe line ( eV in the case of a relatively narrow line keV) is not in conflict with a reflection component consistently small, as in broad-line radioquasars of similar luminosity (Hasenkopf et al. 2002).
It would be interesting to study other narrow-line radioquasars of similar luminosity to check whether the properties of RX J1011.2+5545 are peculiar (in the sense of moderate absorbing column of cold gas and weak reflection features) or relatively general. Bright and medium sensitivity X-ray surveys performed with should be particularly sensitive to this type of sources (even more heavily absorbed), where modest follow-up exposures could deliver X-ray data of enough quality to merit a spectral analysis as the one presented here.
Acknowledgments
The work reported herein is based partly on observations obtained with , an ESA science mission with instruments and contributions directly funded by ESA member states and the USA (NASA). The telescope is operated by the Nordic Optical Telescope Scientific Association on the spanish Observatorio del Roque de los Muchachos of the Instituto de Astrofísica de Canarias. We are grateful to the service support for conducting the optical observations. The National Radio Astronomy Observatory is a facility of the National Science Foundation operated under cooperative agreement by Associated Universities, Inc. We acknowledge financial support by the Ministerio de Ciencia y Tecnología (Spain), under grants AYA2000-1690 (XB, FJC, MTC), AYA2002-03326 (RC, JIGS) and AYA2001-3092 (MR, JMP). MR and JMP acknowledge also partial support by the European Regional Development Fund (ERDF/FEDER). During this work, MR has been supported by a fellowship from CIRIT (Generalitat de Catalunya, ref. 1999 FI 00199).
References
- (1) Antonucci R.R.J., 1993, ARAA, 31, 473
- (2) Ballantyne D.R., Ross R.S., Fabian A.C., 2002, MNRAS, 332, L45
- (3) Barcons X., Carballo R., Ceballos M.T., Warwick R.S., González-Serrano J.I., 1998, MNRAS, 301, L25
- (4) Barcons X., Carrera F.J., Ceballos M.T., 2003, MNRAS, 339, 757
- (5) Blandford R.D., Znajek R.L., 1977, MNRAS, 179, 433
- (6) Canizares C.R., White J.L., 1989, ApJ, 339, 27
- (7) Cappi M., Matsuoka M., Comastri A., Brinkmann W., Elvis M., Palumbo G.G.C., Vignali C., 1997, ApJ, 478, 492
- (8) Carballo R., Warwick R.S., Barcons X., González-Serrano J.I., Barber C.R., Martínez-González E., Pérez-Fournon I., Burgos J., 1995, MNRAS, 277, 1312
- (9) Elvis M.S., et al., 1994, ApJS, 95, 1
- (10) Hasenkopf C.A., Sambruna R.M., Eracleous M., 2002, ApJ, 575, 127
- (11) Jansen F.A., et al., 2001, A&A, 365, L1
- (12) Magdziarz P., Zdziarski A.A., 1995, 273, 837
- (13) Marshall H.L. et al., 2001, ApJ, 555, 356
- (14) Meier D.L., 2001, ApJ, 548, L9
- (15) Nandra K., Pounds K.A., 1994, MNRAS, 268, 405
- (16) Panessa F., Bassani L., 2002, A&A, 394, 435
- (17) Pappa A., Georgantopoulos I., Stewart G.C., Zezas A.L., 2001, MNRAS, 326, 995
- (18) Pooley D.M., Waldram E.M., Riley J.M., 1998, MNRAS, 298, 637
- (19) Pounds K.A., Nandra K., Stewart G.C., George I.M., Fabian A.C., 1990, Nat, 344, 132
- (20) Reynolds C.S., Fabian A.C., 1995, MNRAS, 273, 1167
- (21) Risaliti G., Maiolino R., Salvati M., 1999, ApJ, 522, 157
- (22) Sambruna R.M., Eracleous M., Mushotzky R.F., 1999, ApJ, 526, 60
- (23) Strüder L., et al., 2001, A&A, 365, L18
- (24) Turner M.J.L. et al., 2001, A&A, 365, L27
- (25) Wilkes B.J., Elvis M.S., 1987, ApJ, 323, 243