11email: jgarcia@am.ub.es; josep@am.ub.es; mribo@am.ub.es
VLA multifrequency observations of RS CVn binaries
We present multiepoch Very Large Array (VLA) observations at 1.4 GHz, 4.9 GHz, 8.5 GHz and 14.9 GHz for a sample of eight RS CVn binary systems. Circular polarization measurements of these systems are also reported. Most of the fluxes observed are consistent with incoherent emission from mildly relativistic electrons. Several systems show an increase of the degree of circular polarization with increasing frequency in the optically thin regime, in conflict with predictions by gyrosynchrotron models. We observed a reversal in the sense of circular polarization with increasing frequency in three non-eclipsing systems: EI~Eri, DM~UMa and HD~8358. We find clear evidence for coherent plasma emission at 1.4 GHz in the quiescent spectrum of HD~8358 during the helicity reversal. The degrees of polarization of the other two systems could also be accounted for by a coherent emission process. The observations of ER~Vul revealed two U-shaped flux spectra at the highest frequencies. The U-shape of the spectra may be accounted for by an optically thin gyrosynchrotron source for the low frequency part whereas the high frequency part is dominated by a thermal emission component.
Key Words.:
stars: individual: DM~UMa, AY~Cet, HD~8358, HD~8357, EI~Eri, RS~CVn, $σ^2$ CrB, ER~Vul – radio continuum: stars – binaries: general1 Introduction
RS CVn systems are close, chromospherically active binary systems whose enhanced emission can be detected over a wide range of the spectral domain, from the X-ray to the radio region. Most of the phenomena observed in these systems at different wavelengths are attributed to the presence of magnetic fields generated by a dynamo mechanism.
In general, the radio emission from RS CVn binary systems is quite variable, with luminosity levels in the range 10141019 erg s-1 Hz-1 at centimeter wavelengths (Morris & Mutel Morris88 (1988), Drake et al. Drake89 (1989), Drake92 (1992)). Typical features of the radio emission from these systems are: a) low-level (quiescent) emission with moderately circularly polarized emission (degree of circular polarization 30–40%) and flat or negative spectrum (spectral index , where ); or b) high-level (flaring) emission, unpolarized or weakly polarized (%), and with positive spectral index ; or c) high-intensity, short-duration outbursts with high degrees of circular polarization (see Gunn Gunn96 (1996) for a review on RS CVn binary systems). The mechanisms generally invoked to account for the observed radio emission are gyrosynchrotron, synchrotron and coherent (electron-cyclotron maser or plasma radiation) processes. For reviews on these radio emission mechanisms see, for instance, Dulk (Dulk85 (1985)) and Güdel (Gudel02 (2002)).
Gibson (Gibson84 (1984)) suggested that stars that exhibit substantial circular polarization in their incoherent emission are those with lower orbital inclination angles, whereas stars with unpolarized or weakly polarized emission have higher inclination angles. Mutel et al. (Mutel87 (1987)) studied a small sample of late-type binaries, mainly of the RS CVn class, and found that non-eclipsing (low inclination angle) systems have an average circular polarization in their quiescent emission significantly larger than that for eclipsing systems.
The non-thermal nature of the electron distribution responsible for the flaring emission from RS CVn systems seems to be well established. The quiescent emission has been interpreted in two different ways, based on different assumptions for the distribution of the population of electrons responsible for the emission observed, namely gyrosynchrotron emission from a Maxwellian (thermal) distribution or from a power-law (non-thermal) distribution (Drake et al. Drake89 (1989), Drake92 (1992); Chiuderi-Drago & Franciosini Chiuderi93 (1993)). However, a thermal gyrosynchrotron emission model with uniform magnetic field predicts a spectral index after the peak, whereas the spectra observed are much flatter. Thermal emission in a magnetic field decreasing as , where is the distance from the active star, may reproduce the observed quiescent spectrum, but the magnetic field structure seems unrealistic. Emission from a non-thermal distribution appears to be the most plausible explanation for the observed properties of the quiescent emission.
Previous multifrequency polarization observations of several RS CVn systems (e.g., Mutel et al. Mutel87 (1987), Massi & Chiuderi-Drago Massi92 (1992), Umana et al. Umana93 (1993), White & Franciosini White95 (1995)) revealed properties of both low-level and high-level emission sources, showing a reversal in the sense of polarization between 1.4 GHz and 5 GHz for non-eclipsing systems. In addition, White & Franciosini (White95 (1995)) found an increase of the degree of polarization with increasing frequency at high frequencies, at least up to 15 GHz, independently of the shape of the spectrum. However, the polarization properties of the quiescent emission are not well reproduced by gyrosynchrotron models. These models predict the helicity inversion at frequencies where the spectral index is positive, whereas the observations show this occurrence with a flat or decreasing spectrum. White & Franciosini (White95 (1995)) proposed that weak, highly polarized, coherent plasma emission may be associated with the polarization inversion observed at low frequencies. Gyrosynchrotron models also predict a decrease of the degree of circular polarization with increasing frequency at high frequencies, which is the opposite to the observed tendency.
Thus, some details in the interpretation of the radio emission in active close binary systems remain still unclear or need additional observational support. Only a small fraction of RS CVn systems have measurements of their circular polarization emission at several frequencies. Multiband centimeter observations of low-level sources are, hence, important for a correct interpretation of the radio emission from these systems.
In the present paper we report four-frequency radio observations of a sample of eight RS CVn systems performed at several epochs. The systems are DM~UMa, AY~Cet, HD~8358, HD~8357, EI~Eri, RS~CVn, $σ^2$ CrB and ER~Vul, for which no four-frequency radio observations have been reported previously. The sample selected is representative of the RS CVn-type systems in the sense that it contains both eclipsing and non-eclipsing systems, with different degrees of orbital inclinations, as well as both short and long-period binaries. The short-period systems contain components that rotate synchronously whereas, in contrast, no such a synchronization occurs for the long-period systems.
2 Observations
We carried out radio observations of the eight RS CVn systems mentioned above at 1.4 GHz (L band), 4.9 GHz (C band), 8.5 GHz (X band) and 14.9 GHz (U band). The observations were made with the Very Large Array (VLA) interferometer of the NRAO111The National Radio Astronomy Observatory is a facility of the National Science Foundation operated under cooperative agreement by Associated Universities, Inc. during eight sessions in 1997. The epochs of observation were May 29 (B/C configuration), June 6 (B/C configuration), August 24 (C/D configuration), August 31 (C/D configuration), September 27 (C/D configuration), October 2 (C/D configuration), October 3 (C/D configuration), and October 29 (D configuration).
The sources were always observed at all frequencies, except in two epochs in which U band observations could not be performed for some systems due to time constraints. These exceptions were HD~8357 and HD~8358 on August 24, and DM~UMa and RS~CVn on October 3.
The multifrequency observations were performed sequentially. A typical observation consisted of 810 minutes on the target source at each band, preceded and followed by a phase calibrator observation. We used two bandwidths of 50 MHz at each band, with central frequencies 1385 and 1465 MHz at L band, 4835 and 4885 MHz at C band, 8435 and 8485 MHz at X band, and 14915 and 14965 MHz at U band. For flux calibration we used 0137+331 and, on October 3, 1331+305. The assumed flux densities for 0137+331 were 16, 5.5, 3.2 and 1.8 Jy at 1.4, 4.9, 8.5 and 14.9 GHz, respectively, whereas those for 1331+305 were 15, 7.5, 5.2 and 3.4 Jy at 1.4, 4.9, 8.5 and 14.9 GHz, respectively. For phase calibration the sources observed were 0059+001, 0115$-$014, 0125$-$000, 0149+059, 0423$-$013, 1035+564, 1310+323, 1613+342 and 2115+295.
The calibration and analysis of the data were carried out using the Astronomical Image Processing System (AIPS) data reduction software package. Maps were made with the task IMAGR. We measured the Stokes’ parameters I, the total intensity, and V, the circularly polarized intensity. Positive V corresponds to right circular polarization, whereas negative V corresponds to left circular polarization. The degree of circular polarization is defined as V/I. We also used the task DFTPL to analyze the light curves.
3 Results and discussion
The results of the observations are presented in Table 1. The measured values of the total intensity, I, and the degree of circular polarization, , as well as their uncertainties (one-sigma errors), are listed for each system and epoch of observation. We list the three-sigma values as upper limits if no radio emission is detected. The eight binary systems were detected at 4.9 GHz at all epochs of observation, and the corresponding radio luminosities at this frequency are included in the table, with values ranging from 6.11014 to 3.31017 erg s-1 Hz-1. The last two columns list the spectral indexes between 1.4 and 4.9 GHz and between 4.9 and 8.5 GHz.
| System | Date | I | Total Intensity (mJy) | Spectral | |||||
| Circular Polarization Degree () | (erg s-1 Hz-1) | Index | |||||||
| 1.4 GHz | 4.9 GHz | 8.5 GHz | 14.9 GHz | ||||||
| HD 8357 | May 29 | I | 1.5 | 6.71 0.04 | 5.92 0.03 | 3.7 0.1 | 1.51016 | 0.2 | |
| — | 3.7 0.6 | 4.2 0.5 | 10 2 | ||||||
| Aug. 24 | I | 2.4 0.4(∗) | 7.32 0.04 | 6.27 0.04 | — | 1.61016 | 0.9 | 0.3 | |
| 2.5 2.7 | 5.1 0.6 | 11.0 0.5 | — | ||||||
| Aug. 31 | I | 3.4 0.5 | 19.42 0.04 | 25.14 0.05 | 23.8 0.2 | 4.21016 | 1.4 | 0.5 | |
| 2.6 2.0 | 1.7 0.2 | 1.8 0.1 | 0.8 0.9 | ||||||
| Sep. 27 | I | 1.5 | 0.28 0.05 | 0.16 0.03 | 0.3 | 6.11014 | 1.0 | ||
| — | 20 10 | 37 13 | — | ||||||
| Oct. 29 | I | 0.7 0.2 | 1.43 0.04 | 1.48 0.03 | 0.6 0.1 | 3.11015 | 0.6 | 0.06 | |
| 4.3 4.7 | 13 2 | 17 2 | 26 17 | ||||||
| EI Eri | May 29 | I | 5.7 | 2.18 0.06 | 3.42 0.04(∗) | 0.8 0.1(∗) | 8.31015 | 0.8 | |
| — | 3.2 1.2 | 0.6 1.1 | 23 13 | ||||||
| Jun. 6 | I | 4.5 | 4.90 0.04 | 4.41 0.04 | 3.1 0.1 | 1.91016 | 0.2 | ||
| — | 2.2 0.6 | 2.0 0.8 | 5.1 3.0 | ||||||
| Aug. 31 | I | 8 2(∗) | 22.87 0.06 | 22.79 0.05 | 19.5 0.2 | 8.71016 | 0.8 | 0.01 | |
| 43 13 | 0.26 0.13 | 1.3 0.2 | 1.5 1.1 | ||||||
| Oct. 29 | I | 0.9 | 1.52 0.05 | 1.31 0.03 | 0.9 0.1 | 5.81015 | 0.3 | ||
| — | 10 2 | 17 3 | 21 11 | ||||||
| DM UMa | Jun. 6 | I | 9.2 0.3 | 14.37 0.05 | 12.29 0.08(∗) | 2.7 0.2(∗) | 3.31017 | 0.4 | 0.3 |
| 27 1 | 1.3 0.2 | 3.9 0.3 | 11 7 | ||||||
| Aug. 31 | I | 6.3 0.7 | 8.09 0.05 | 6.73 0.06 | 5.2 0.2 | 1.91017 | 0.2 | 0.3 | |
| 5 1 | 3.0 0.6 | 5.5 0.8 | 9 4 | ||||||
| Sep. 27 | I | 1.2 | 1.4 0.08 | 1.11 0.06 | 0.9 0.2 | 3.21016 | 0.4 | ||
| — | 5 6 | 7 5 | 22 22 | ||||||
| Oct. 2 | I | 1.5 | 0.79 0.05 | 0.62 0.05 | 0.6 0.2 | 1.81016 | 0.4 | ||
| — | 6 4 | 37 11 | 43 33 | ||||||
| Oct. 3 | I | 1.5 | 0.82 0.04 | 0.67 0.04 | — | 1.91016 | 0.4 | ||
| — | 8 4 | 15 4 | — | ||||||
| CrB | Sept. 27 | I | 18 | 1.28 0.05 | 1.17 0.04 | 0.5 0.1 | 7.21014 | 0.2 | |
| — | 9 3 | 15 3 | 10 20 | ||||||
| Oct. 3 | I | 12 | 4.43 0.06 | 2.45 0.05(∗) | 0.55 0.08 | 2.51015 | 1.1 | ||
| — | 3.4 0.9 | 3.2 1.4 | 32 12 | ||||||
| HD 8358 | May 29 | I | 1.7 0.5 | 3.09 0.04 | 2.79 0.03 | 2.06 0.09 | 1.61016 | 0.5 | 0.2 |
| 6 4 | 4.2 1.3 | 11 1 | 29 6 | ||||||
| Aug. 24 | I | 1.2 | 1.03 0.04 | 0.88 0.03 | — | 5.31015 | 0.3 | ||
| — | 17 4 | 9.0 3.4 | — | ||||||
| Aug. 31 | I | 2.2 0.4(∗) | 1.94 0.04 | 1.69 0.04 | 0.6 | 1.01016 | 0.1 | 0.3 | |
| 94 20 | 6 2 | 11 2 | — | ||||||
| Sep. 27 | I | 2.1 | 1.35 0.04 | 1.44 0.03 | 0.8 0.1 | 7.01015 | 0.1 | ||
| — | 5.9 2.4 | 10 2 | 48 15 | ||||||
| Oct. 29 | I | 0.9 | 0.76 0.03 | 0.79 0.03 | 0.3 | 3.91015 | 0.07 | ||
| — | 6 4 | 5.1 2.7 | — | ||||||
| System | Date | I | Total Intensity (mJy) | Spectral | |||||
| Circular Polarization Degree () | (erg s-1 Hz-1) | Index | |||||||
| 1.4 GHz | 4.9 GHz | 8.5 GHz | 14.9 GHz | ||||||
| ER Vul | Aug. 24 | I | 1.5 | 0.59 0.06 | 0.27 0.05 | 0.58 0.07 | 1.81015 | 1.4 | |
| — | 8 5 | 15 11 | 27 12 | ||||||
| Aug. 31 | I | 1.2 | 0.52 0.04 | 0.42 0.03 | 0.6 | 1.61015 | 0.4 | ||
| — | 8 6 | 16 7 | — | ||||||
| Oct. 2 | I | 6 | 0.64 0.04 | 0.41 0.04 | 0.5 0.1 | 1.91015 | 0.8 | ||
| — | 8 5 | 12 8 | 12 20 | ||||||
| Oct. 29 | I | 3 | 2.32 0.04 | 3.05 0.04 | 1.9 0.1 | 6.91015 | 0.5 | ||
| — | 2.6 1.4 | 1 1 | 7 5 | ||||||
| AY Cet | May 29 | I | 0.9 | 0.43 0.04 | 0.18 0.03 | 0.3 | 3.21015 | 1.6 | |
| — | 13 8 | 30 17 | — | ||||||
| Sep. 27 | I | 1.2 0.2 | 2.10 0.05 | 1.84 0.03 | 1.0 0.1 | 1.61016 | 0.4 | 0.2 | |
| 5 3 | 6 2 | 4 1 | 7 10 | ||||||
| Oct. 2 | I | 1.2 | 0.78 0.04 | 0.57 0.03 | 0.3 | 5.81015 | 0.6 | ||
| — | 7 4 | 16 5 | — | ||||||
| Oct. 29 | I | 0.7 0.2 | 0.29 0.03 | 0.09 | 0.3 | 2.11015 | 0.7 | ||
| 1 5 | 34 10 | — | — | ||||||
| RS CVn | Jun. 6 | I | 1.5 | 1.60 0.05 | 1.09 0.04 | 0.6 | 2.21016 | 0.7 | |
| — | 2.5 2.0 | 8.3 3.1 | — | ||||||
| Oct. 3 | I | 1.2 | 0.16 0.03 | 0.09 | — | 2.21015 | |||
| — | 94 30 | — | — | ||||||
The emission detected for most of the epochs corresponds to a low-level flux. Flaring emission at least one order of magnitude above the quiescent level is detected in three systems, namely HD~8357, EI~Eri and DM~UMa. We detected circularly polarized radio emission above a 3 level for all the systems, with the only exception of ER Vul. In general, the circular polarization measurements reveal weak or moderate levels of polarization, with values % for most of the detections. However, very highly polarized emission is also present in a few cases, with 90%.
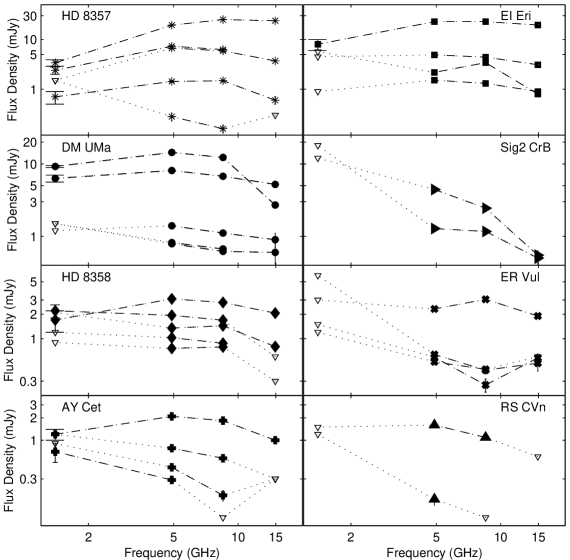
The radio spectra corresponding to the values listed in Table 1 are plotted in Fig. 1. We show the flux density as a function of the frequency of observation for each epoch of observation. The spectral indexes derived from these values reveal either the quiescent or the flaring nature of the observed emission. However, we caution that the non-simultaneous nature of the observations may affect the spectral shapes due to the possible variability of the emission on short timescales. We analized the radio light curves of all the observations and found several cases in which variability is clearly present. The variability is evidenced by the different modulation of the light curve of a given frequency with respect to the other frequencies at the same epoch of observation. These cases are indicated with an asterisk after the frequency at which such variability is found in Table 1, and some of them will be discussed in more detail below.
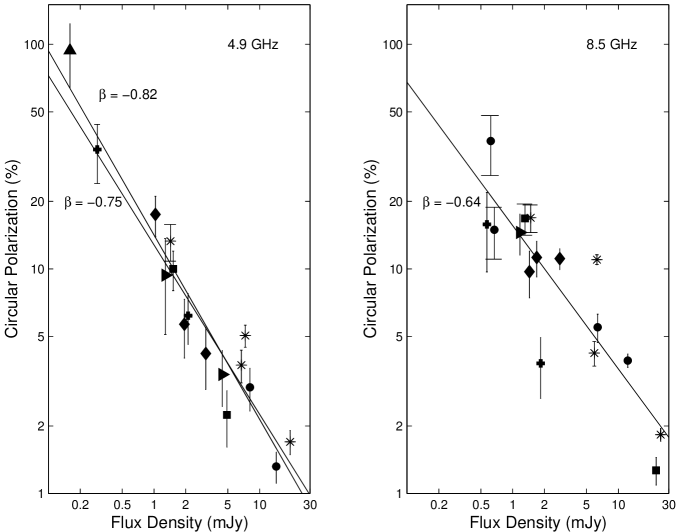
The circularly polarized emission is mainly detected at 4.9 GHz and 8.5 GHz. We show the degree of circular polarization, , as a function of the flux density at these two frequencies in Fig. 2. The plots show a decrease in the fractional circular polarization with increasing level of radio emission for both frequencies. The anticorrelation between the degree of circular polarization and the flux density shown in this figure, with a decrease in as the flux increases, is in agreement with gyrosynchrotron emission models in which the quiescent emission is associated with radiation from an optically thin source, whereas the unpolarized or weakly polarized flaring emission is associated with a self-absorbed source. The solid lines in the plots show a least-squares fit to the data using a function of the form Iβ. The fit to the 8.5 GHz observations has a slope = 0.64, whereas that to the 4.9 GHz observations has a steeper slope = 0.82. However, the circular polarization of RS~CVn at 4.9 GHz, unlike the other systems, may be attributed to a coherent emission mechanism, as we will see later. Thus, we also fit the same function to the data excluding the circular polarization measurement of RS~CVn at 4.9 GHz ( 94%, triangle at the top), and we find a slope =0.75, somewhat closer to the slope of the fit to the 8.5 GHz observations.
We discuss now the VLA observations of the eight binary systems separately. We include information on past radio observations of these systems found in the literature for the sake of comparison. The main properties of these systems are listed in Table 2. Data on the photometric, spectroscopic and orbital properties are taken from Strassmeier et al. (Strassmeier93 (1993)), unless a different reference is indicated. Heliocentric distances are from the astrometric data in the Hipparcos Catalogue (ESA ESA97 (1997)).
| System | Spectral Types | Massesa | Eccentricity | Eclipse | Distance | |||
|---|---|---|---|---|---|---|---|---|
| (M☉) | (days) | (days) | (∘) | (pc) | ||||
| HD 8357e | G7 Ve / K1 IVe | 0.92 / 1.12 | 14.3023e | 12.245 | 0.185e | 30e | none | 45 |
| EI Eri | G5 IV / ? | 1.4 / 0.53 | 1.947227 | 1.945 | 0.0 | 46 | none | 56 |
| DM UMa | K01 IVIII / ? | f(m)=0.011 | 7.4949 | 7.478 | 0.02 | 40 | none | 139 |
| CrB | F6 V / G0 V | 1.12 / 1.14 | 1.139791 | 1.1687 | 0.022 | 28 | none | 22 |
| HD 8358 | G5 / G5 | 0.9 / 0.8 | 0.515782 | 0.52006 | 0.0 | 30 | none | 66 |
| ER Vul | G0 V / G5 V | 1.10 / 1.05 | 0.698095 | 0.6942 | 0.0 | 67 | partial | 50 |
| AY Cet | WD / G5 III | 0.55 / 2.09 | 56.824 | 77.22 | 0.0 | 26 | none | 79 |
| RS CVn | F4 IV / G9 IV | 1.41 / 1.44 | 4.79785 | 4.7912 | 0.0 | 87 | total | 108 |
a Masses are given in the same order as for spectral types,
where f(m) indicates that the mass function is given.
b Orbital period.
c Rotation (photometric) period.
d Inclination of the pole of the orbital plane or of
the rotation axis.
e Data from Fekel (Fekel96 (1996)).
3.1 HD 8357
In a microwave survey at X band, Slee et al. (Slee87 (1987)) observed HD~8357 and found a maximum daily average flux density of 11.9 mJy and a median daily average flux density of 8.9 mJy. Observations at C band were conducted by Morris & Mutel (Morris88 (1988)) and also by Drake et al. (Drake89 (1989)), who reported values of 2.91 mJy and 2.35 mJy, respectively.
We observed HD~8357 at five epochs. HD~8357 is the source with the largest difference in our sample between the extreme values of , of about two orders of magnitude. Weak circular polarization was detected at C, X and U bands, whereas no circular polarization flux was detected above a 3 level of 14% at L band. We detected the highest levels of emission on August 31, which correspond to a flaring spectrum with positive spectral indexes 1.4 and 0.5, and a quite flat spectrum for frequencies higher than 8.5 GHz. The degrees of circular polarization at C and X bands are negative during this flare, in contrast with the positive values of the other epochs. These low negative of less than 2%, together with the positive spectral indexes, are consistent with gyrosynchrotron emission from an optically thick source.
Our observations of HD~8357 agree with the trend found by White & Franciosini (White95 (1995)), that is, tends to increase with frequency at high frequencies. In particular, we observed quiescent emission on May 29, with negative spectral indexes 0.2 and 0.8, while the degrees of circular polarization increased with frequency, that is, 3.7%, 4.2% and 10% at 4.9 GHz, 8.5 GHz and 14.9 GHz, respectively, in conflict with predictions by gyrosynchrotron models.
3.2 EI Eri
Mutel & Lestrade (Mutel85a (1985)) observed EI~Eri at C band and measured a radio flux of 4.3 mJy. Slee et al. (Slee88 (1988)) found fluxes of 4.7 mJy at C band and 18.6 mJy at X band. Slee et al. (Slee87 (1987)) reported a maximum and median daily average fluxes of 21.1 mJy and 11.4 mJy, respectively, in their survey at X band. VLBI observations at S band (2.3 GHz) were performed by White et al. (White90 (1990)), who found a flux density of 15 mJy. The decay phase of a flare was observed by Fox et al. (Fox94 (1994)) at X, C and L bands, with maximum fluxes of 20 mJy ( +5%), 14 mJy ( +20%), and 8.8 mJy ( +51%), respectively.
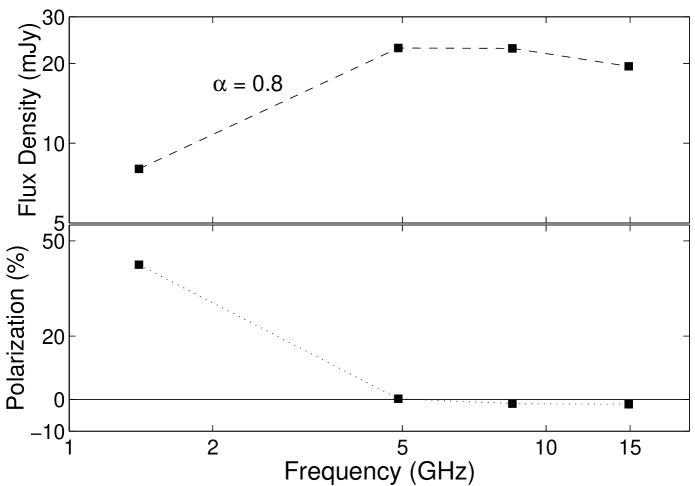
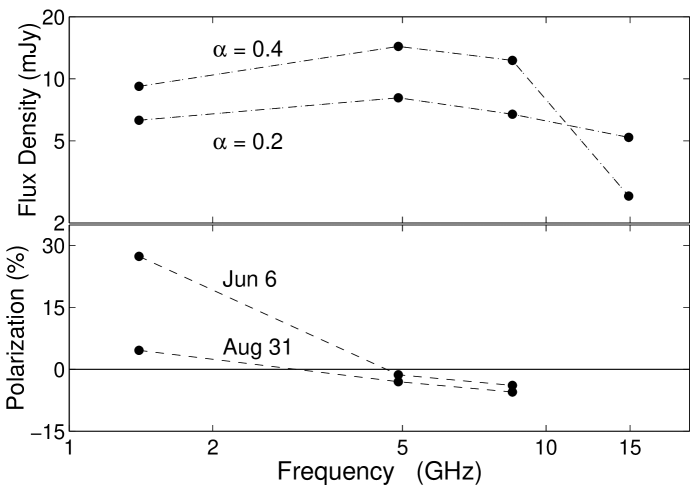
We observed EI~Eri at four epochs. This system was always detected at C, X and U bands, with low polarization fluxes. At L band there was only one detection, with a relatively high . On October 29 there is an increase of with increasing frequency. The highest radio luminosities correpond to the observations on August 31, in which we detected a flare with a reversal in the sense of circular polarization between 1.4 and 8.5 GHz. The flux and polarization spectra of the August 31 observations are plotted in Fig. 3. The flux spectrum (plot at the top) shows a positive spectral index 0.8.
The inversion in the sense of circular polarization could be explained in terms of a gyrosynchrotron model in which the reversal takes place when the frequency of observation passes from a low frequency optically thick source to a high frequency optically thin source. The V fluxes for gyrosynchrotron emission can be either positive or negative for each mode of propagation, the x-mode (in the optically thin part) and the o-mode (in the optically thick part), depending on the magnetic field orientation with respect to the observer’s line of sight. However, typical values of the degree of polarization for flaring, incoherent gyrosynchrotron emission are 10%, whereas the value measured at L band is relatively high, 43%. Thus, we also consider that a coherent emission process, such as electron-cyclotron maser or plasma emission, may be present at this band.
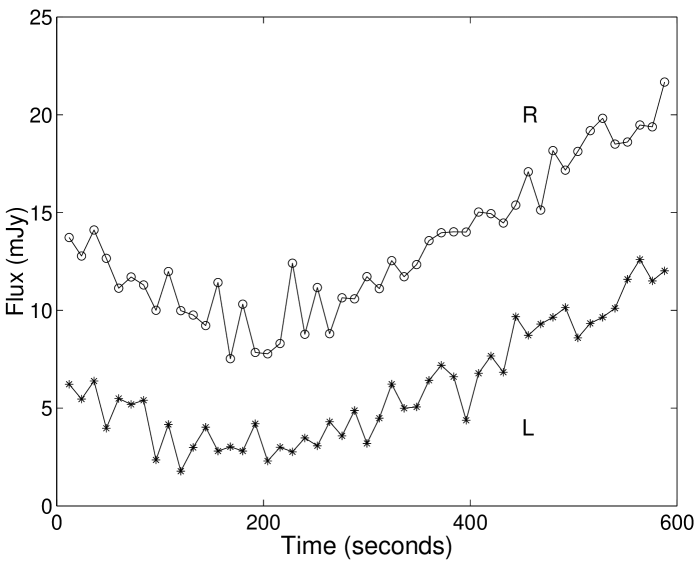
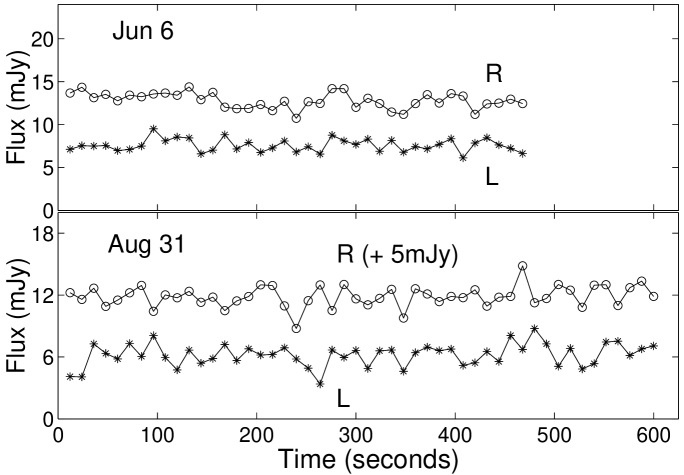
White & Franciosini (White95 (1995)) studied the reversal in the sense of polarization between low and high frequencies, and interpreted the difference between the flux evolution of the left and right polarizations at low frequencies as owing to the presence of plasma emission, with rapid variability of the coherent component on timescales of 10 seconds. In order to investigate if such a emission process is also present in our observations, we plot the time evolution of the right circular polarization (R) and the left circular polarization (L) fluxes at 1.4 GHz in 12 second intervals in Fig. 4. The overall evolution of the R and L components is practically the same, displaying a decreasing intensity trend in both profiles during the first third of the observing time interval, and increasing afterwards. The close resemblance between the evolution of the R and L components is not expected if only one of the polarization components is due to a coherent emission process, in which case the modulation of one component would be different than the other. However, such a high in the optically thick part of the spectrum can only be accounted for by coherent emission.
3.3 DM UMa
DM~UMa is the most distant system in our sample. The radio emission of DM~UMa has been measured at C band by Mutel & Lestrade (Mutel85a (1985)), who observed a flux of 3.0 mJy, and by Gunn et al. (Gunn94 (1994)), who reported a value of 2.04 mJy.
We observed DM~UMa at five epochs, in which the fluxes detected at C and X bands were left-handed circularly polarized, whereas its flux at U band was always unpolarized and the two detections at L band were right-handed circularly polarized. The highest levels of emission correspond to the observations performed on June 6 and August 31, for which emission at all four frequencies was detected. The corresponding radio spectra for these two epochs, shown in Fig. 5, are typical of moderate flares, with maxima between 1.4 and 8.5 GHz. DM~UMa is the source with the largest radio luminosity in our sample, 3.31017 erg s-1 Hz-1 for the June 6 observation. In contrast, the observations at the other three epochs are characterized by a lower flux level, one order of magnitude smaller, with negative spectral indexes typical of quiescent states.
We found a helicity reversal between 1.4 GHz and 4.9 GHz for the June 6 and August 31 observations. The flux spectra and the degree of circular polarization as a function of frequency are plotted in Fig. 5. The positive spectral index between these two frequencies, = 0.4 on June 6 and = 0.2 on August 31, evidences that the source is not quiescent during the helicity reversal. The degree of circular polarization increases with frequency after the helicity reversal for both epochs. The three-sigma upper limits on at 14.9 GHz, 22% and 12% on June 6 and August 31, respectively, do not exclude that the increase continues at the highest frequency of observation. On August 31, is small, less than 6%, at L, C and X bands, and this suggests that the inversion in the sense of polarization is consistent with a gyrosynchrotron process in which the sense of polarization observed is due to an optically thick source at low frequencies and an optically thin source at high frequencies. On June 6, the degree of polarization is also small at C and X bands, less than 4%, but in contrast 27% at L band. Such a seems to be too high to be produced by gyrosynchrotron emission from an optically thick source, so a coherent emission mechanism should be invoked. Analogously to EI~Eri, we plot the time evolution of the right circular polarization (R) and the left circular polarization (L) of DM~UMa at 1.4 GHz in Fig. 6, for the June 6 and August 31 observations. We find no evidence for a different modulation in the flux evolution of the two components of polarization, as for EI~Eri above.
3.4 CrB
This binary, the nearest in our sample, was first detected as radio source by Spangler et al. (Spangler77 (1977)), at C band, with a mean flux of 11 mJy. $σ^2$ CrB was also detected at C band by Florkowski et al. (Florkowski85 (1985)), who reported two measurements of 8.4 mJy and 19.6 mJy, by Morris & Mutel (Morris88 (1988)), with a flux of 8.5 mJy, by Mutel et al. (Mutel85b (1985)), with a flux of 1416 mJy, by Léfevre et al. (Lefevre94 (1994)), with a mean flux density from 8 mJy to 31 mJy, and by Gunn et al. (Gunn94 (1994)), who measured a flux of 6.69 mJy. At S band, Turner (Turner85 (1985)) measured a value of 6 mJy. At L band, the flux detected by Kuijpers & van der Hulst (Kuijpers85 (1985)) and by van den Oord et al. (Oord88 (1988)) was 9.3 mJy and 8.2 mJy, respectively. At X band, Paredes et al. (Paredes87 (1987)) observed a flux of 32 mJy, and Estalella et al. (Estalella93 (1993)) fluxes of 14 mJy and 19 mJy at two separate epochs. VLBI observations by Lestrade et al. (Lestrade92 (1992)) measured a flux of 12 mJy at X band, as well as flux levels in the range 750 mJy at C band. Observations of the radio emission at L, C and X band, coordinated with X-ray and UV observations, were performed by Stern et al. (Stern92 (1992)) and Osten et al. (Osten00 (2000), Osten03 (2003)). Stern et al. (Stern92 (1992)) found mean quiescent fluxes of 2.2 mJy at X band, 4.6 mJy at C band, and 9.3 mJy at L band, as well as strong flaring emission about ten times higher than the quiescent emission near the end of the observation at the three bands. They found no circular polarization greater than the 2–3 level. Osten et al. (Osten00 (2000)) observed large variations in the radio emission of $σ^2$ CrB, with flux peaks of 30 mJy ( +30%) at L band, 81 mJy ( +15%) at C band, and 110 mJy (practically unpolarized) at X band. Finally, Osten et al. (Osten03 (2003)) reported fluxes of some few mJy at C and X bands, with negative .
We detected low flux levels in our two-epoch observations of $σ^2$ CrB, with radio luminosities in the range 10141015 erg s-1 Hz-1, among the lowest in our sample. The circular polarization was always negative, with values typical of quiescent emission. On September 27 there is an increase of the degree of circular polarization with increasing frequency, contrary to what gyrosynchrotron models predict. The radio spectra for the two epochs of observation are consistent with an optically thin emitting source. The upper limits on the flux at L band are also compatible with this interpretation.
3.5 HD 8358
This binary system is a fast rotator, with the shorter rotation period in our sample (0.52006 days). HD~8358 exhibited low levels of emission at C band in the past. Drake et al. (Drake86 (1986), Drake92 (1992)) reported a flux of 2.72 mJy with a left-hand circular polarization of 9.2%, and Morris & Mutel (Morris88 (1988)) a flux of 3.23 mJy.
We observed HD~8358 at five epochs. The flux measured was always low, below 3.1 mJy. At C, X and L bands we detected negative circular polarization, within the range 4% 29%. The degrees of circular polarization at C band, 4%, 6% and 17%, indicate weakly polarized emission at this band, in agreement with the measurement by Drake et al. (Drake92 (1992)) above. On May 29, the flux spectrum for frequencies larger than 4.9 GHz corresponds to an optically thin source with spectral indexes 0.2 and 0.5, whereas the degree of circular polarization increases with frequency, 4% at 4.9 GHz, 11% at 8.5 GHz and 29% at 14.9 GHz.
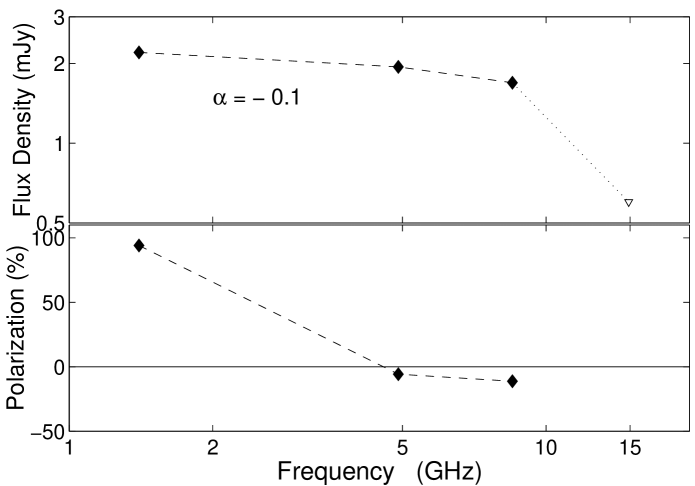
The source displayed a helicity reversal between L and C bands on August 31, with a highly polarized, right-hand emission, 94%, at L band, the only detection of polarization at this band in our observations. We show this reversal in Fig. 7. The spectrum at the top of the figure is compatible with quiescent emission from an optically thin source at all the frequencies of observation, with a negative spectral index = 0.1. The brightness temperature of the source is given by K, where is the angular size in milliarcseconds. At 1.4 GHz, and assuming a radius for the emitting region, we find R K. The high degree of polarization and the high brightness temperature at L band may be accounted for by a coherent emission process.
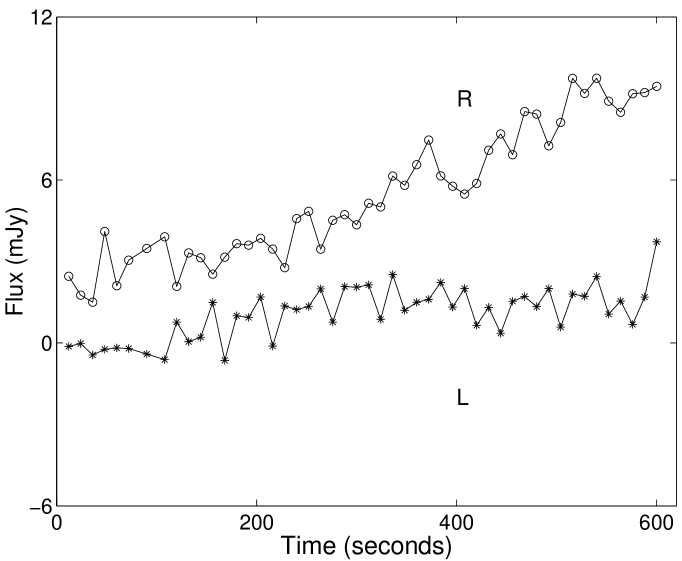
The time evolution of the R and L circular polarization flux at 1.4 GHz on August 31 is plotted in Fig. 8. There is a different evolution of the polarization components, with a rise trend in the R component for most of the observing time, whereas the evolution of the L component is quite flatter. The contrast is more evident in the second half of the observation. The different modulation and the high degree of polarization strongly suggests that coherent emission is present at this frequency. In particular, we consider plasma emission. The scenario proposed by White & Franciosini (White95 (1995)) to explain the helicity reversal, that is, that the observed reversal at low frequencies is due to the presence of two components, a gyrosynchrotron emitting source that is weakly polarized or unpolarized at 1.4 GHz, and a weak but highly polarized coherent component (plasma emission) that is responsible for the high polarization observed, is likely to apply to the emission of HD~8358 at 1.4 GHz, as evidenced by the different evolution of the polarization components. Thus, coherent emission at 1.4 GHz in the form of plasma emission (or alternatively electron-cyclotron maser emission) is the most likely explanation for the observed helicity reversal.
3.6 ER Vul
Observations at C band of this eclipsing binary were performed by Drake et al. (Drake86 (1986)) and by Morris & Mutel (Morris88 (1988)), who found values of 4.97 mJy and 2.7 mJy, respectively. Rucinski (Rucinski92 (1992)) observed ER~Vul in 1990 and 1991, and listed values between 0.661.9 mJy at L band and 2.827.23 mJy at C band for the 1990’s observations, and 0.233.23 mJy at X band and values of 0.65 mJy and 1.61 mJy at C band for the 1991’s observations. This author found no appreciable circular polarization at any time. At X band, Rucinski (Rucinski98 (1998)) measured fluxes below 3.5 mJy during his 1995’s observations. At L band, flux levels below 2.2 mJy were observed by Osten et al. (Osten02 (2002)), with an average %%.
We observed ER~Vul during four epochs in which its radio emission was detected at C and X bands and, except on August 31, also at U band, while the source was never detected at L band. The radio spectrum of ER~Vul on October 29 shows a flaring emission, with a positive spectral index 0.5. In contrast, lower, quiescent emission levels were observed at the other three epochs, with negative and luminosities ranging erg s-1 Hz-1. ER~Vul is the only source in our sample for which the circular polarization could not be detected above a 3 level at any of the frequencies of observation. This is not unexpected for such a high orbital inclination system if its emission is accounted for by a gyrosynchrotron emission process (Mutel et al. Mutel87 (1987)). However, the source was very weak for most of the observations, with fluxes below 1 mJy, which might also explain the non detection of polarization.
On August 24 and October 2, the quiescent emission of ER~Vul is characterized by a U-shaped spectrum at the highest frequencies of observation (see Fig. 1), suggesting two spectral components. The slope is negative up to 8.5 GHz and then becomes positive, with values 1.5 and 1.3 for August 24, and 0.8 and 0.4 for October 2. The negative slope and the low flux level are compatible with gyrosynchrotron emission from an optically thin source, whereas a different emission mechanism should be responsible for the highest frequency part of the spectrum. We find no evidence for a different modulation of the radio light curve at 14.9 GHz with respect to the light curves at the other frequencies. Such a difference would account for the U-shaped feature as due to variability at the highest frequency of observation. However, only simultaneous multifrequency observations may ultimately confirm the U-shaped spectra observed.
Similar U-shaped spectra have been observed in the quiescent emission of some radio active dMe stars like AU Mic (Cox & Gibson, Cox85 (1985)), the binary UV~Ceti and other dMe stars (Güdel & Benz, Gudel96 (1996)). The low-frequency part of the U-shaped spectra of these objects was interpreted as optically thin gyrosynchrotron emission, whereas the high-frequency component was attributed to thermal gyroresonance emission from the X-ray emitting plasma (Güdel & Benz Gudel89 (1989), Cox & Gibson Cox85 (1985)). We thus investigate if the high-frequency component of the spectra of ER~Vul may also be due to thermal emission.
ER~Vul has been detected in the X-ray band, with luminosities 691030 erg s-1 (White et al. White87 (1987)), and 3.761030 erg s-1 (Dempsey et al. Dempsey93 (1993)), both assuming a distance 45 pc, and 5.01030 erg s-1 (Osten et al. Osten02 (2002)), which is the measurement reported by Dempsey et al. (Dempsey93 (1993)) but assuming the Hipparcos distance. White et al. (White87 (1987)) used a two-component thermal plasma model to fit the spectrum, with temperatures of 6106 K and 4107 K. Gunn & Doyle (Gunn97 (1997)) derived a large filling factor of 0.53, as well as a large chromospheric thickness of 0.42 R☉, for the secondary component of ER~Vul. Despite the high orbital inclination of ER~Vul, no eclipses have been observed so far in the UV, radio and X-ray domain (Osten et al. Osten02 (2002)). The lack of either orbital or rotational modulation in the X-ray band seems to indicate that the emission likely originates in a region larger than the stellar size. Both components of ER~Vul have a radius 1.07 R☉, and are separated by a distance 2 R☉. Thus, assuming that the X-ray emitting plasma region encompasses both stars, the resulting radius of the region is 3 R☉. We consider that the total flux observed at 14.9 GHz is due to the contribution of two emitting sources, thermal plus non-thermal. The maximum flux emitted by the non-thermal, optically thin gyrosynchrotron source can be roughly estimated by assuming = , where . This gives a flux from the non-thermal source of 0.12 mJy on August 24 and 0.26 mJy on October 2. Hence, the thermal emission fluxes would be 0.46 mJy on August 24 and 0.24 mJy on October 2, resulting in lower limits on the brightness temperatures of 1.2107 K and 6.2106 K, respectively. On the other hand, assuming that the flux observed at 14.9 GHz is due entirely to the thermal source, we obtain upper limits 1.5107 K on August 24 and 1.3107 K on October 2. The range of brightness temperatures obtained are consistent with a thermal emitting source. Even decreasing the adopted size of the emitting region by a factor 2, which would result in a size similar to that of the secondary component plus chromosphere assuming maximum thickness, the brightness temperatures would be compatible with thermal emission as well.
On the other hand, the X-ray emission from ER~Vul might also be located at one of the poles of the star, and this could also explain the lack of modulation in the X-ray light curve. An example of X-ray emitting polar source is AB~Dor (Maggio et al. Maggio00 (2000)). Algol’s X-ray and radio emission has also been modeled in terms of a corona confined in the polar regions, with a compact flaring component smaller than the star and a more extended quiescent corona as large as, or larger than, the star (Favata et al. Favata00 (2000), Mutel et al. Mutel98 (1998)). VLBI images of UV~Ceti (Benz et al. Benz98 (1998)) reveal that this binary is another example of radio emitting polar source. Therefore, it would be possible to obtain brightness temperatures for ER~Vul consistent with thermal emission for sizes of the emitting X-ray source similar to those discussed above.
On August 31, the flux levels at C and X bands are similar to those for the two epochs above, but at U band we could only measure an upper limit of 0.6 mJy. Thus, we can not confirm a U-shaped flux spectrum for this epoch as well, though the upper limit on the flux does not rule out this possibility.
3.7 AY Cet
This single-lined binary was observed at C band by Mutel & Lestrade (Mutel85a (1985)), who reported fluxes of 1.1 mJy and 5.2 mJy, and by Morris & Mutel (Morris88 (1988)), who measured a value of 0.7 mJy. Simon et al. (Simon85 (1985)) observed AY~Cet at L, C and U bands, and measured highly variable and highly polarized emission at L band, with fluxes ranging between 10.6 and 17.7 mJy and negative degrees of polarization 62% 86%, whereas at C band the flux was 2.5 mJy with +5%, and at U band they found an upper limit of 5 mJy. These authors also measured an unpolarized flux of 18.2 mJy at C band two days before their multifrequency observations.
Our four-epoch observations of AY~Cet are characterized by relatively low fluxes at all bands. We detected left-hand circular polarization at C and X bands, 4% 34%. The flux spectra and the values of are compatible with gyrosynchrotron radiation. We detected AY~Cet at the four bands on September 27, with a degree of polarization 6% at C band for a flux of 2.1 mJy. This helicity is the opposite to that found by Simon et al. (Simon85 (1985)), +5%, for a similar flux (2.5 mJy). Mutel et al. (Mutel87 (1987)) found that for non-eclipsing systems the helicity at a given frequency is nearly the same over many years. Such a correlation is expected for AY~Cet since it is a low-inclination (non-eclipsing) system. However, the spectrum’s slope between L and C bands is 0.4 for our observations, whereas that of Simon et al.’s observations is clearly negative, 1.4. As pointed out by these authors, a coherent mechanism was likely acting during their L band observations. In contrast, a gyrosynchrotron emission mechanism is consistent with our observations, which explains the difference in helicity for the same frequency.
3.8 RS CVn
The eclipsing binary RS~CVn has the highest orbital inclination in our sample ( 87∘). RS~CVn was observed at C band by Gibson & Newell (Gibson79 (1979)), who found a flux of 7.2 mJy, by Florkowski et al. (Florkowski85 (1985)), who reported a value of 2.96 mJy, and by Gunn et al. (Gunn94 (1994)), with a flux of 1.86 mJy.
We observed RS~CVn at two epochs. The source was detected at X and C bands on June 6, with a negative spectral index . No circular polarization was found at these bands above a 3 level. Unpolarized or weakly polarized fluxes are expected for RS~CVn if its emission is due to an incoherent process, since it is a high orbital inclination binary.
On October 3, the flux detected at C band was highly polarized. The upper limit on the flux at X band indicates a negative spectral index . In addition, the upper limit at L band, more than seven times larger than the flux at C band, is compatible with a negative . Assuming a negative spectrum, and combined with the relatively low radio luminosity at C band, ( 2.21015erg s-1 Hz-1), ten times lower than that on June 6, the emission observed is consistent with a quiescent source. The very high degree of polarization at C band, 94%, suggests that the circular polarization observed is likely due to a coherent emission process. The brightness temperature at C band is R K, where is the radius of the emitting source. A brightness temperature K can be obtained assuming a size of the emitting region R☉ at C band, respectively, in agreement with typical source sizes for coherent emission, where is the radius of the star.
4 Conclusions
We have presented multi-frequency radio observations of several RS CVn systems with the VLA at different epochs. The main results of our observations are summarized as follows:
-
1.
The flux spectra and the values of the degrees of circular polarization at different frequencies for most of the observations are consistent with incoherent, gyrosynchrotron emission from mildly relativistic particles. In particular, the observations at 4.9 GHz and 8.5 GHz show a clear trend toward lower circular polarization with increasing flux.
-
2.
Gyrosynchrotron models predict a decrease of when the source becomes optically thin above a given frequency. In contrast, we found several examples for which such a correlation is the opposite, namely HD~8357, $σ^2$ CrB, HD~8358, EI~Eri and DM~UMa, which show an increase of with increasing frequency at high frequencies.
-
3.
We observed a helicity reversal with increasing frequency in the spectra of three non-eclipsing systems with different spectral shapes. Two of them, EI~Eri and DM~UMa, with a moderate flaring emission, showed the reversal for positive spectral indexes between 1.4 GHz and 4.9 GHz. On the other hand, the helicity reversal for HD~8358 took place for a quiescent spectrum with negative . We found evidence for coherent emission at 1.4 GHz in the helicity reversal of HD~8358, likely due to a plasma emission process, as suggested by the very high and brightness temperature, as well as the different flux evolution of one polarization component relative to the other. In contrast, the moderate flaring emission in the helicity reversal of EI~Eri and DM~UMa showed no evidence of a different modulation in the evolution of the polarization components at 1.4 GHz. However, the observed degrees of circular polarization, %, at 1.4 GHz are too high to be accounted for by emission from an optically thick gyrosynchrotron source. An alternative explanation for the helicity reversal of DM~UMa on August 31, with % at 1.4 GHz, is that the reversal is due to the transition from an optically thick source at low frequencies to an optically thin source at high frequencies.
-
4.
The non-detection of circular polarization in the fluxes of ER~Vul and RS~CVn is in agreement with the expected trend of decreasing degree of circular polarization with increasing orbital inclination for incoherent emission. The sole exception is the highly circularly polarized flux of RS~CVn, %, measured at 4.9 GHz in one epoch. However, the mechanism invoked to explain this very high is a coherent emission process.
-
5.
We observed U-shaped flux spectra at high frequencies for ER~Vul. To our knowledge, no previous observations of such U-shaped spectra have been reported for a RS CVntype system. The low frequency part of the spectra is consistent with gyrosynchrotron emission from an optically thin source. The contribution of a thermal plus a non-thermal emitting source is a plausible explanation for the observed shape at high frequencies. The range of values of the brightness temperature for the flux detected at the highest frequency is compatible with the thermal emitting source hypothesis.
Acknowledgements.
We acknowledge E. Franciosini for her useful comments and suggestions after reading through a draft version of this paper. We acknowledge detailed and useful comments from S. A. Drake, the referee of this paper. J. M. P. and M. R. acknowledge partial support by DGI of the Ministerio de Ciencia y Tecnología (Spain) under grant AYA2001-3092, as well as partial support by the European Regional Development Fund (ERDF/FEDER). During this work, M. R. has been supported by a fellowship from CIRIT (Generalitat de Catalunya, ref. 1999 FI 00199). This research has made use of the NASA’s Astrophysics Data System.References
- (1) Benz, A. O., Conway, J., & Güdel, M. 1998, A&A, 331, 596
- (2) Chiuderi-Drago, F., & Franciosini, E. 1993, ApJ, 410, 301
- (3) Cox, J. J., & Gibson, D. M. 1985, in Radio Stars, ed. R. M. Hjellming & D. M. Gibson, Reidel, Dordrecht, 233
- (4) Dempsey, R., Linsky, J. L., Schmitt, J. H. M. M., & Fleming, T. A. 1993, ApJ, 413, 333
- (5) Drake, S. A., Simon, T., & Linsky, J. L. 1986, AJ, 91, 1229
- (6) Drake, S. A., Simon, T., & Linsky, J. L. 1989, ApJS, 71, 905
- (7) Drake, S. A., Simon, T., & Linsky, J. L. 1992, ApJS, 82, 311
- (8) Dulk, G. A. 1985, ARA&A, 23, 169
- (9) Estalella, R., Paredes, J. M., Rius, A., et al. 1993, A&A, 268, 178
- (10) Favata, F., Micela, G., Reale, F., et al. 2000, A&A, 362, 628
- (11) Fekel, F. C., Quigley, R., Gillies, K., & Africano, J. L. 1987, AJ, 94, 726
- (12) Fekel, F. C. 1996, AJ, 112, 269
- (13) Fox, D. C., Linsky, J. L., Veale, A., et al. 1994, A&A, 284, 91
- (14) Florkowski, D. R., Johnston, K. J., Wade, C. M., & de Vegt, C. 1985, AJ, 90, 2381
- (15) Gibson, D. M., & Newell, R. T. 1979, IAU Circ., No. 3337
- (16) Gibson, D. M. 1984, in Cool Stars, Stellar Systems and the Sun, ed. B. Balimas & L. Hartmann, Springer, Berlin, 197
- (17) Güdel, M. 2002, ARA&A, 40, 217
- (18) Güdel, M., & Benz, A. O. 1996, in Radio Emission from the Stars and the Sun, ed. A. R. Taylor & J. M. Paredes, ASP Conference Series, Vol. 93, 303
- (19) Güdel, M., & Benz, A. O. 1989, A&A, 211, L5
- (20) Gunn, A. G., Spencer, R. E., Abdul Aziz, H., et al. 1994, A&A, 291, 847
- (21) Gunn, A. G. 1996, Irish Astr. J., 23, 137
- (22) Gunn, A. G., & Doyle, J. G. 1997, A&A, 318, 60
- (23) The Hipparcos and Tycho Catalogues 1997, ESA SP-1200, Noordwijk
- (24) Kuijpers, J., & van der Hulst, J. M. 1985, A&A, 149, 343
- (25) Léfevre, E., Klein, K. L., & Lestrade, J.-F. 1994, A&A, 283, 483
- (26) Lestrade, J.-F., Phillips, R. B., Preston, R. A., & Gabuzda, D. C. 1992, A&A, 258, 112
- (27) Maggio, A., Pallavicini, R., Reale, F., & Tagliaferri, G. 2000, A&A, 356, 627
- (28) Massi, M. & Chiuderi-Drago, F. 1992, A&A, 253, 403
- (29) Melrose, D. B., Hewitt, R. G., & Dulk, G. A. 1984, JGR, 89, 897
- (30) Morris, D. H., & Mutel, R. L. 1988, AJ, 95, 204
- (31) Mutel, R. L., & Lestrade, J.-F. 1985, AJ, 90, 493
- (32) Mutel, R. L., Lestrade, J.-F., Preston, R. A., & Phillips, R. B. 1985, ApJ, 289, 262
- (33) Mutel, R. L., Morris, D. H., Doiron, D. J., & Lestrade, J.-F. 1987, AJ, 93, 1220
- (34) Mutel, R. L., Molnar, R. A., Waltman, E. B., & Ghigo, F. D. 1998, ApJ, 507, 371
- (35) Osten, R. A., Brown, A., Ayres, T. R., et al. 2000, ApJ, 544, 953
- (36) Osten, R. A., Brown, A., Wood, B. E., & Brady, P. 2002, ApJS, 138, 99
- (37) Osten, R. A., Ayres, T. R., Brown, A., et al. 2003, ApJS, 582, 1073
- (38) Paredes, J. M., Estalella, R., & Rius, A. 1987, A&A, 186, 177
- (39) Rucinski, S. M. 1992, PASP, 104, 1177
- (40) Rucinski, S. M. 1998, PASP, 110, 272
- (41) Simon, T., Fekel, F. C., Jr., & Gibson, D. M. 1985, ApJ, 295, 153
- (42) Slee, O. B., Nelson, G. J., Stewart, R. T., et al. 1987, MNRAS, 229, 659
- (43) Slee, O. B., Stewart, R. T., Nelson, G. J., et al. 1988, Astrophys. Lett., 27, 247
- (44) Spangler, S. R., Owen, F. N., & Hulse, R. A. 1977, AJ, 82, 989
- (45) Stern, R. A., Uchida, Y., Walter, F., et al. 1992, ApJ, 391, 760
- (46) Strassmeier, K. G., Hall, D. S., Fekel, F. C., & Scheck, M. 1993, A&AS, 100, 173
- (47) Turner, K. C. 1985, in Radio Stars, ed. R. M. Hjellming & D. M. Gibson, Reidel, Dordrecht, 283
- (48) Umana, G., Triglio, C., Hjellming, R. M., et al. 1993, A&A, 267, 126
- (49) van den Oord, G. H. J., Mewe, R., & Brinkman, A. C. 1988, A&A, 205, 181
- (50) Welty, A. D., & Ramsey, L. W. 1995, AJ, 109, 2187
- (51) White, N. E., Culhane, J. L., Parmar, A. N., & Sweeney, M. A. 1987, MNRAS, 227, 545
- (52) White, G. L., Lestrade, J.-F., Jauncey, D. L., et al. 1990, AJ, 99, 405
- (53) White, S. M., & Franciosini, E. 1995, ApJ, 444, 342