Molecular Hydrogen in Damped Ly Systems: Spatial Distribution
Abstract
To interpret H2 quasar absorption line observations in Damped Ly clouds (DLAs), we model the H2 spatial distribution within a DLA. Based on numerical simulations of disk structures with parameters similar to those derived for such absorbers, we calculate the H2 distribution as a function of ultraviolet background (UVB) intensity and dust-to-gas ratio. For typical values of these two quantities we find that the area in which the H2 fraction exceeds (typical observational detection limit) only covers % of the disk surface, i.e. H2 has a very inhomogeneous, clumpy distribution even at these low abundance levels. This explains the relative paucity of H2 detections in DLAs. We also show the dependence of the covering fraction of H2 on dust-to-gas ratio and UVB intensity and we comment on the physics governing the H2 chemical network at high redshift.
keywords:
ISM: molecules — galaxies: evolution — galaxies: high-redshift — cosmology galaxies — quasar absorption lines1 Introduction
In the recent years, evidence has been found for the existence of heavy elements in damped Ly clouds (DLAs), i.e. quasar absorption line systems whose neutral hydrogen column density is larger than cm-2 (e.g. Pettini et al. 2001; Prochaska & Wolfe 2002). The evolution of metal abundance in DLAs can trace the chemical enrichment history of present galaxies. Based on this, and on other clues, DLAs have been suggested to be the progenitors of nearby galaxies; the similar values of the baryonic mass density in DLAs around redshift and the stellar mass density at has further supported this idea (Lanzetta, Wolfe, & Turnshek 1995).
It is natural to consider that the DLAs contain a certain amount of dust, because dust-to-gas ratio and metallicity are correlated even for metal-poor galaxies (Schmidt & Boller 1993; Lisenfeld & Ferrara 1998). Indeed, Fall, Pei, & McMahon (1989) have suggested that the reddening of background quasars indicates typical dust-to-gas ratios of –1/4 of the Milky Way (see also Zuo et al. 1997). The depletion of heavy elements also supports the dust content in DLAs (e.g. Vladilo 2002). The existence of dust implies the possibility that the formation of hydrogen molecules (H2) is enhanced because of the H2 grain surface reaction. Hirashita & Ferrara (2002) have recently shown that even in metal poor () galaxies, dust grains can drastically accelerate the formation rate of H2. They also argued that the enhancement of molecular abundance results in an enhancement of the star formation activity in the early evolutionary stages of galaxy evolution, because stars only form in molecular clouds. The important role of dust on the enhancement of the H2 abundance is also suggested by observations of DLAs (Ge, Bechtold, & Kulkarni 2001) and in the local Universe, e.g., in Galactic halo clouds (e.g. Richter et al. 2001) and in the Magellanic Clouds (Richter 2000; Tumlinson et al. 2002).
Although the H2 fraction, , where indicates the column density of the species , is largely enhanced for some DLAs, stringent upper limits are laid on a significant fraction of DLAs in the range – (Petitjean, Srianand, & Ledoux 2000). This can be interpreted as due to a low formation rate of H2 in dust-poor environments relative to the Milky Way (Levshakov et al. 2002; Liszt 2002) and high H2 dissociation rate by strong ultraviolet background (UVB) radiation (e.g., Petitjean et al. 2000). However, we should keep in mind that such upper limits do not exclude the existence of molecular-rich clouds in these systems, because molecular clouds may have a very low volume filling factor. If the covering fraction of molecular-rich regions on a galactic surface is extremely small, it is natural that H2 is hardly detected in DLAs. Thus, the argument on the H2 abundance in DLAs is strongly dependent on the geometry of H2 distribution within those systems.
In order to get a better understanding of the spatial distribution of H2, which can then be used to interpret observations, we present here a study of such problem based on high-resolution numerical simulations. This allows us to tackle the problem of the H2 formation/destruction and distribution in DLAs in a realistic way. We calculate the spatial structure of H2 distribution in a galactic disk under various conditions by varying the UVB intensity and dust-to-gas ratios. As the underlying gas density and temperature distribution is, to a first approximation, independent of the H2 properties (for example, it does not contribute to cooling at the metallicity level typical for DLAs), this approach offers the opportunity to explore the parameter space with the required accuracy.
Throughout this Letter, we assume a flat CDM cosmology111We use the following values of the cosmological parameters: , , km s-1 Mpc km s-1 Mpc-1, and . (Mo & White 2002). We first describe the simulation that we used to derive the density and temperature maps (Section 2). The maps are presented in Section 3, where the H2 distribution maps are also shown. Based on these results, we discuss our interpretation of current observations of H2 in DLAs (Section 4).
2 Numerical Simulation of DLA disks
It is still unclear whether DLAs are large protogalactic disks (Prochaska & Wolfe 1998), protogalactic clumps (Haehnelt, Steinmetz, & Rauch 1998; Ledoux et al. 1998), or a mixture of various populations (Cen et al. 2002). Here, we assume that DLAs are large protogalactic disks. We use a two-dimensional hydrodynamical simulation assuming a disk-like geometry (for the method, see Wada & Norman 2001). However, the statistical properties of density and temperature are determined by non-linear hydrodynamical effects (Wada & Norman 2001), and we expect that the results of this Letter remain valid if other scenarios for DLA formation are adopted.
We have run the hydrodynamical calculation code described by Wada & Norman (2001) to obtain density and temperature spatial distributions. The parameters for the simulation are set as follows. The velocity dispersion derived from the line width is roughly 100 km s-1 (ranging from 40 to 300 km s-1; e.g., Prochaska & Wolfe 1998). Therefore, we fix the circular velocity as km s-1. We assume a formation redshift . By using the spherical collapse model for galaxy formation (see equations 2 and 7 of Hirashita & Ferrara 2002), those values yield a virial mass of and a radius of the dark matter halo of kpc. If the baryon fraction is assumed to be equal to , the gas mass contained in the galactic disk within the halo is estimated to be , where is the gas fraction contained in the disk. According to Navarro & Steinmetz (2000), we estimate for our cosmological parameters. We do not include star formation and stellar feedback. The UV radiation for the photoelectric heating is assumed to be 1/100 of the local Galactic value. The following conclusions, however, are not affected by the details of the local radiation field, because the density and temperature distributions of the dense gas where H2 molecules are mainly formed are not very sensitive to the UV intensity. We have confirmed that the dense regions survive even in the strongest UV intensity treated in this Letter.
To solve our problem it is necessary to follow the evolution of the system from galactic scales down to the small regions where H2 forms. We use a resolution of cells with a fixed cell size of 0.49 pc, so as to reach a global 1 kpc scale simulation. The typical radius of the gaseous disk can be estimated to be kpc (e.g., Ferrara, Pettini & Shchekinov 2000). With this size, the column density of hydrogen nuclei in the vertical direction of the disk is cm-2. We simulated the central 450 pc radius of the disk, in which we assume that a fraction of is contained. Then, we simulate an exponential disk with a scale length of 100 pc, to check the effects of radial density profiles. From a series of tests, we have been able to assess that the following results are not affected significantly by the specific profile assumption.
The whole timescale of the simulation is 60 Myr, when a quasi-stationary density distribution function is achieved. This timescale is larger than the rotation time in the simulated region: Myr. For the cooling function, we assume a metallicity of 0.1 , appropriate for DLAs.
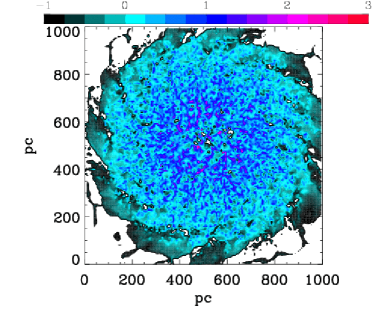
In Fig. 1, we show the density and temperature distributions calculated by the simulation. A major part (86%) of the disk is covered with regions with ( is the number density of hydrogen nuclei). This density is roughly consistent with that derived observationally by Silva & Viegas (2002). The gas temperature is higher than 500 K in a large part of the disk (62%), and indeed Chengalur & Kanekar (2000) observationally derived K for a large part of their sample. There are also a few DLAs detected with K (e.g. Chengalur & Kanekar 2000). For more detailed statistical study, a complete set of simulations that cover a range of mass, rotational velocity, etc. is necessary. The above qualitative agreement, however, assures a good basis on which we discuss the properties of DLAs. Those density and temperature maps are used to estimate the spatial distribution of molecular fraction in the following.
3 H2 spatial distribution
3.1 Estimate of molecular fraction
We estimate the molecular fraction () at each grid point. Since we are interested in the typical metallicity of DLAs (; Vladilo 2002), the gas phase formation of H2 through the formation of H- is negligible compared with the formation on dust (Liszt 2002). On the other hand, the dominant mechanism for the destruction of H2 is the photodissociation under a UVB intensity.
For simplicity, we assume equilibrium between H2 formation and destruction. In order to examine if this assumption is justified, we first estimate the formation timescale of H2 as yr, where we adopt the reaction rate cm-3 s-1 (defined in equation 1), (about the experimental detection limit), and cm-3 (typical density for molecule-forming regions). In this Letter, we are interested in structures down to 0.5 pc (grid size), and the hydrodynamical timescale in such structures can be estimated as 0.5 pc/10 km s yr. We are particularly interested in the cold clouds where H2 can form, and in such a region, the typical hydrodynamical timescale is yr because of their low sound speed. Thus, the chemical equilibrium can be reasonably assumed for and cm-3. Since such an equilibrium becomes a bad approximation for high , some of the molecular rich clouds with will disappear in the course of hydrodynamical evolution. In a diffuse gas with cm-3, the chemical equilibrium may not be realised because of a slow reaction rate. This suggests that H2 does not form so efficiently as estimated from the equilibrium assumption in a diffuse medium. Moreover, such a diffuse medium has a temperature K. With such a high temperature, hydrogen atoms may not stick to dust efficiently. Therefore, in diffuse region may be overestimated in this Letter. Fortunately this strengthen our conclusion on the lack of H2 in a diffuse medium. A more consistent treatment of H2 reaction and hydrodynamics will be tackled in the future.
We adopt the formation rate of H2 per unit volume and time, , by Hollenbach & McKee (1979) (see also Hirashita, Hunt, & Ferrara 2002):
| (1) | |||||
where is the number density of grains, is the radius of a grain (assumed to be spherical with a radius of 0.1 m), is the mean thermal speed of hydrogen, is the dust-to-gas mass ratio, is the grain material density (assumed to be 3 g cm-3), and is the sticking coefficient of hydrogen atoms onto dust. In equation (1) we have substituted the dust number density with the dust-to-gas ratio by using
| (2) |
where is the mass of a hydrogen atom. The sticking coefficient is given by (Omukai 2000)
| (3) | |||||
where is the dust temperature. In this Letter, is assumed to be 20 K (a typical temperature under the local interstellar radiation field), but the following result is insensitive to this value as long as K.
The photodissociation rate in units of cm-3 s-1, , is estimated by (Abel et al. 1997)
| (4) |
where (cm-3) is the number density of H2, ( erg s-1 cm-2 Hz-1 str-1) is the UVB intensity at the Lyman limit wavelength (912 Å) averaged for all the solid angle, is the correction factor of the reaction rate for H2 self-shielding and dust extinction. We adopt the correction for the H2 self-shielding by Draine & Bertoldi (1996) (see also Hirashita & Ferrara 2002). Then, we estimate as
| (5) |
where is the typical thickness of the disk which is assumed to be 100 pc in this Letter.
In fact, in some DLAs with H2 detection, the H2 excitation is consistent with the radiation field comparable to the local Galactic radiation field (Ge & Bechtold 1997; Ledoux, Srianand, & Petitjean 2002; Petitjean, Srianand, & Ledoux 2002). In this case, the photo-dissociation rate can be much higher. However, the H2-detected DLAs could be biased to star-forming molecular regions, and it is still unknown if DLAs in general are exposed to such a strong radiation field. Thus, we concentrate on the UVB, which is common for all the DLAs. The equilibrium condition with temperature and density at each grid point gives for each point. Thus, we obtain the spatial distribution of under a certain set of .
3.2 Molecular fraction maps
The metallicity level of DLAs () implies that the dust-to-gas ratio of DLAs is typically 10% of the Galactic (Milky Way) value. In this Letter, we assume the Galactic dust-to-gas ratio to be 0.01. Therefore, we examine the dust-to-gas ratio around 0.001. The UVB intensity is considered to be –1 around (Giallongo et al. 1996; Cooke, Espey, & Carswell 1997; Scott et al. 2000; Bianchi, Cristiani, & Kim 2001). Since the UVB intensity is likely to be lower at (e.g. Scott et al. 2002), we examine –1 in this Letter.
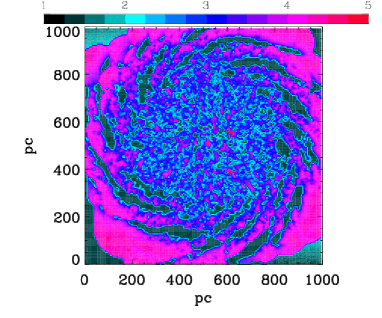
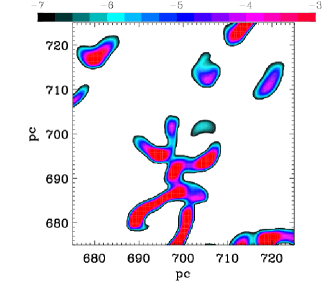
In Fig. 2, we show the molecular fraction () for (a) (10% of the Galactic dust-to-gas ratio and , (b) and , and (c) and . The contour levels are for , , and . In order to see the fine structure of the molecular distribution, we also zoom on the region around (700 pc, 700 pc) in Fig. 3. We find that molecular-rich regions are distributed very inhomogeneously and concentrate in small ( pc) clumps.
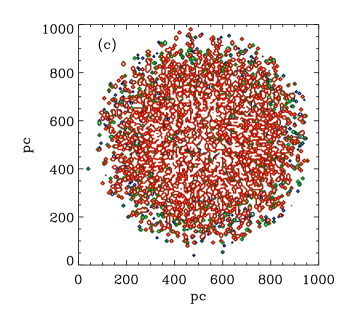
We define the covering fraction as the fraction of the area where the molecular fraction is larger than in the central 450 pc ( radius of the simulated area) region. The disk is seen face-on and projection effects of disk inclination is not considered in this paper. Since the disk thickness is much smaller than the size of the galaxy, the effect of the inclination on the surface covering fraction is expected to be small. Such a projection effect can be quantitatively investigated in a future three-dimensional simulation.
Since the typical detection limit for is , we are particularly interested in . Observationally, can be interpreted as the probability of detecting a gas with under a condition that such a disk as simulated in this Letter hits the line of sight to a distant quasar. If we assume that the simulated disk is typical for DLAs, approximates the probability of detecting H2 in a given DLA with a level of . In Table 1, we show as a function of and . The covering fraction is very sensitive to both parameters in the range of interest. For another observational thresholds, a power-law scaling is applicable in with , 0.13, and 0.10, for the same parameter sets as Figs. 2a, b, and c, respectively.
| 0.0001 | 0.0003 | 0.001 | 0.003 | 0.01 | ||
|---|---|---|---|---|---|---|
| 0.01 | 3.8 | 15 | 34 | 57 | 85 | |
| 0.03 | 1.7 | 8.5 | 25 | 46 | 72 | |
| 0.1 | 0.75 | 3.7 | 16 | 34 | 60 | |
| 0.3 | 0.43 | 1.8 | 9.5 | 25 | 48 | |
| 1 | 0.26 | 0.81 | 4.9 | 16 | 37 |
4 SUMMARY AND DISCUSSION
Our results indicate that the fraction of the area with detectable molecular fraction (typically ) is very small for small dust-to-gas ratio (, i.e. % of the Galactic dust-to-gas ratio) and in a strong UVB radiation (). Thus, it is rare that a molecular-rich region hits the line of sight to a distant quasar. This means that DLAs with a detectable molecular fraction are rare objects.
The lack of H2 detection from DLAs does not necessarily mean the lack of gas in molecular form. Under a strong UVB, molecules are predominantly confined in small areas. However, in such areas, the molecular fraction is as high as . This molecular fraction is large enough to provide the minimum radiative cooling necessary to ignite the star formation process.
Table 1 shows that the covering fraction of molecular-rich regions sensitively changes as the dust-to-gas ratio and/or the UVB intensity vary. If the dust-to-gas ratio is 10% of the Galactic value and the UVB is as strong as expected at high redshift (), %; on the contrary % if the dust-to-gas ratio is % of the Galactic value. Such sensitive dependence on may explain the observational correlation between molecular fraction and the dust abundance for DLAs (Ge et al. 2001), similar to the local Universe. This underlines the importance of dust for the H2 chemical network at high redshift.
We also found that a detectable amount of H2 is localised in regions with and . Those ranges of density and temperature are consistent with those observationally derived for H2-detected DLAs (e.g., Ledoux et al. 2002). Although most of the DLAs may contain H2, molecular clouds are difficult to detect in absorption if they are embedded in a dust-poor and/or UV-intense environment, because a large fraction of the area is covered by a diffuse, molecule-poor medium. Indeed, most of DLAs are observationally suggested to arise selectively in diffuse neutral gas not associating with a detectable amount of H2 (e.g. Petitjean et al. 2000). Therefore, the observed lack of molecules from absorption measurements does not necessarily indicates the lack of molecular clouds, but probably reflects the small size of molecular-rich regions.
Acknowledgments
We thank the anonymous referee for helpful comments and F. Sigward for helping with IDL programming. HH is supported by JSPS Postdoctoral Fellowship for Research Abroad. PR is supported by the Deutsche Forschungsgemeinschaft. Hydrodynamical simulations were carried out on Fujitsu VPP5000 at ADAC, NAOJ.
References
- [Abel et al.(1997)] Abel, T., Anninos, P., Zhang, Y., Norman, M. L. 1997, NewA, 2, 181
- [Bianchi et al.(2001)] Bianchi, S., Cristiani, S., & Kim, T.-S. 2001, A&A, 376, 1
- [Cen et al.(2002)] Cen, R., Ostriker, J. P., Prochaska, J. X., & Wolfe, A. M. 2002, ApJ, submitted
- [Chengalur & Kanekar(2000)] Chengalur, J. N., & Kanekar, N. 2000 MNRAS, 318, 303
- [Cooke et al.(1997)] Cooke, A. J., Espey, B., & Carswell, R. F. 1997, MNRAS, 284, 552
- [Draine & Bertoldi(1996)] Draine, B. T., & Bertoldi, F. 1996, ApJ, 468, 269
- [Ferrara, Pettini, & Shchekinov (2000)] Ferrara, A., Pettini, M., & Shchekinov, Y. 2000, MNRAS, 319, 539
- [Ge & Bechtold(1997)] Ge, J., & Bechtold, J. 1997, ApJ, 477, L73
- [Ge et al.(2001)] Ge, J., Bechtold, J., & Kulkarni, P. 2001, ApJ, 547, L1
- [Giallongo et al.(1996)] Giallongo E., Cristiani S., D’Odorico S., Fontana A., Savaglio S., 1996, ApJ, 466, 46
- [Haehnelt et al.(1998)] Haehnelt, M. G., Steinmetz, M., & Rauch, M. 1998, ApJ, 495, 647
- [Hirashita & Ferrara(2002)] Hirashita, H., & Ferrara, A. 2002, MNRAS, 337, 921
- [Hirashita, Hunt, & Ferrara(2002)] Hirashita, H., Hunt, L. K., & Ferrara, A. 2002, MNRAS, 330, L19
- [Hollenbach & McKee(1979)] Hollenbach, D. J., & McKee, C. F. 1979, ApJS, 41, 555
- [Lanzetta et al.(1995)] Lanzetta, K. M., Wolfe, A. M., & Turnshek, D. A. 1995, ApJ, 440, 435
- [Ledoux et al.(1998)] Ledoux, C., Petitjean, P.. Bergeron, J., Wampler, E. J., & Srianand, R. 1998, A&A, 337, 51
- [Ledoux et al.(2002)] Ledoux, C., Srianand, R., & Petitjean, P. 2002, A&A, 392, 781
- [Levshakov et al.(2002)] Levshakov, S. A., Dessauges-Zavadsky, M., D’Odorico, S., & Molaro, P. 2002, ApJ, 565, 696
- [Lisenfeld & Ferrara(1998)] Lisenfeld, U., & Ferrara, A. 1998, ApJ, 496, 145
- [Liszt(2002)] Liszt, H. 2002, A&A, 389, 393
- [Mo & White(2002)] Mo, H. J., & White, S. D. M. 2002, MNRAS, 336, 112
- [Navarro & Steinmetz(2000)] Navarro, J. F., Steinmetz, M., ApJ, 538, 477
- [Petitjean et al.(2000)] Petitjean, P., Srianand, R., & Ledoux, C. 2000, A&A, 364, L26
- [Petitjean et al.(2002)] Petitjean, P., Srianand, R., & Ledoux, C. 2002, MNRAS, 332, 383
- [Pettini et al.(1999)] Pettini, M. H., Ellison, S. L., Steidel, C. C., & Bowen, D. V. 1999, ApJ, 510, 576
- [Prochaska & Wolfe(1998)] Prochaska, J. X., & Wolfe, A. M. 1998, ApJ, 507, 113
- [Prochaska & Wolfe(2002)] Prochaska, J. X., & Wolfe, A. M. 2002, ApJ, 566, 68
- [Richter 2000] Richter, P., 2000, A&A, 359, 1111
- [Richter et al.(2001)] Richter, P., Sembach, K.R., Wakker, B.P., Savage, B.D., 2001, ApJ, 562, L181
- [Schmidt & Boller(1993)] Schmidt, K. H., & Boller, T. 1993, Astron. Nachr., 314, 361
- [Scott et al.(2000)] Scott, J., Bechtold, J., Dobrzycki, A., & Kulkarni, V. P. 2000, ApJS, 130, 67
- [Scott et al.(2002)] Scott, J., Bechtold, J., Morita, M., Dobrzycki, A., & Kulkarni, V. P. 2002, ApJ, 571, 665
- [Silva & Viegas(2002)] Silva, A. I., & Viegas, S. M. 2002, MNRAS, 329, 135
- [Tumlinson et al. 2002] Tumlinson, J., et al., 2002, ApJ, 566, 857
- [Vladilo(2002)] Vladilo, G. 2002, A&A, 391, 407
- [Wada & Norman(2001)] Wada, K., & Norman, C. A. 2001, ApJ, 546, 172
- [Zuo et al.(1997)] Zuo, L., Beaver, E. A., Burbidge, E. M., Cohen, R. D., Junkkarinen, V. T., & Lyons, R. W. 1997, ApJ, 477, 568