XMM-Newton observations of High Mass X-ray Binaries in the SMC ††thanks: XMM-Newton is an ESA Science Mission with instruments and contributions directly funded by ESA Member states and the USA (NASA).
Based on XMM-Newton EPIC data of four pointings towards the Small Magellanic Cloud (SMC), results on timing and spectral analyses of 16 known high mass X-ray binaries (HMXBs) and HMXB candidates in the SMC are presented. We confirm the pulse periods of four sources which were known to show pulsations. In addition, two new X-ray pulsars are discovered: XMMU J005605.2–722200 with s and RX J0057.8–7207 with s. Due to the low Galactic foreground absorption, X-ray binary systems in the Magellanic Clouds are well suited for studies of the soft component in their X-ray spectrum. Spectral analysis reveals soft emission besides a power law component in the spectra of three sources. The existence of emission lines in at least one of them corroborates the thermal nature of this emission with temperatures of 0.2 – 0.3 keV and heavy element abundances lower than solar. For the HMXB SMC X-2 which was in a low luminosity state, we determine a flux upper limit of erg cm-2 s-1 (0.3 – 10.0 keV). Furthermore, two new sources (XMMU J005735.7–721932 and XMMU J010030.2–722035) with hard spectrum and emission line objects as likely optical counterparts are proposed as new X-ray binary candidates.
Key Words.:
X-rays: galaxies – X-rays: binaries – Stars: neutron – Magellanic Clouds1 Introduction
After the discovery of X-ray emission from the Magellanic Clouds (MCs) in 1970 (Price et al., 1971), surveying observations of each MC were performed by different X-ray observatories. As for the Small Magellanic Cloud (SMC), source catalogues were created from observations with Einstein (Seward & Mitchell, 1981; Bruhweiler et al., 1987; Wang & Wu, 1992), ROSAT (Kahabka et al., 1999; Haberl et al., 2000; Sasaki et al., 2000), and ASCA (Yokogawa et al., 2000).
The analysis of these X-ray sources has shown, that a large number of X-ray bright objects belongs to the class of X-ray binaries (XRBs) in which a neutron star or a black hole forms a binary system with a companion star. In these systems, mass is accreted from the donor star onto the compact object. X-ray binaries can be divided into low mass X-ray binaries and high mass (or massive) X-ray binaries (HMXBs), depending on the mass of the companion star. Therefore, the identification of optical counterparts of the X-ray sources is crucial for the understanding of the nature of these sources. Furthermore, HMXBs form two subgroups with either an OB supergiant or a Be star as donor. A detailed catalogue of HMXBs was compiled by Liu et al. (2000). Negueruela & Coe (2002) performed high resolution spectroscopy of optical counterparts of HMXBs in the Large Magellanic Cloud (LMC) and studied the population of HMXBs. In the Milky Way or in the LMC, the fraction of Be/X-ray binary systems (Be/XRB) is 60 – 70% of all HMXBs, whereas more than 90% of the HMXBs in the SMC turned out to be Be systems (Haberl & Sasaki, 2000, and references therein).
Since pulsed X-ray emission can be observed from neutron star HMXBs, these sources are also called X-ray binary pulsars. Based on ASCA, RXTE, ROSAT and Beppo SAX observations, more than 20 X-ray binary pulsars have been discovered in the SMC so far (Haberl & Sasaki, 2000; Yokogawa et al., 2000, and references therein). Moreover, in one of the first observations of XMM-Newton (Jansen et al., 2001), pulsed emission from another HMXB was found, which was identified with a Be star (Sasaki et al., 2001).
In order to improve our understanding of the X-ray source population in the SMC, we proposed and analysed pointed observations of the SMC by XMM-Newton and performed spectral and temporal studies of detected sources. In this paper, we focus on the class of HMXBs and present the results on each HMXB and candidate in the observed fields.
2 Data
| 1 | 2 | 3 | 4 | 5 | 6 | 7 | 8 | |
| Rev. | Obs. ID | Pointing direction | Inst. | Mode | Filter | Start time (UT) | End time (UT) | |
| RA | Dec | (EPIC) | ||||||
| (J2000.0) | ||||||||
| 157 | 01100002 | 00 59 46.6 | –72 09 30 | PN | Full | Medium | 2000/10/17 16:16:36 | 2000/10/17 20:41:09 |
| M1 | Full | Medium | 2000/10/17 15:10:44 | 2000/10/17 20:39:43 | ||||
| M2 | Full | Medium | 2000/10/17 15:10:35 | 2000/10/17 20:39:42 | ||||
| 247 | 01357206 | 01 03 29.0 | –72 02 33 | PN | Full | Thin1 | 2001/04/15 01:20:28 | 2001/04/15 05:50:27 |
| M1 | PW3 | Thin1 | 2001/04/14 20:47:25 | 2001/04/15 05:55:45 | ||||
| M2 | PW3 | Thin1 | 2001/04/14 20:47:25 | 2001/04/15 05:55:45 | ||||
| 340 | 00842008 | 00 54 54.3 | –73 40 12 | PN | Full | Thin1 | 2001/10/17 10:46:50 | 2001/10/17 15:55:11 |
| M1 | Full | Medium | 2001/10/17 10:07:40 | 2001/10/17 15:59:35 | ||||
| M2 | Full | Medium | 2001/10/17 10:07:40 | 2001/10/17 15:59:36 | ||||
| 422 | 00842001 | 00 56 24.4 | –72 21 33 | PN | Full | Thin1 | 2002/03/30 14:21:45 | 2002/03/30 19:39:38 |
| M1 | Full | Medium | 2002/03/30 13:48:28 | 2002/03/30 19:44:36 | ||||
| M2 | Full | Medium | 2002/03/30 13:48:29 | 2002/03/30 19:44:54 | ||||
Notes to column No 5: PW3: Partial Window 3.
Notes to column No 6: M1: MOS1, M2: MOS2.
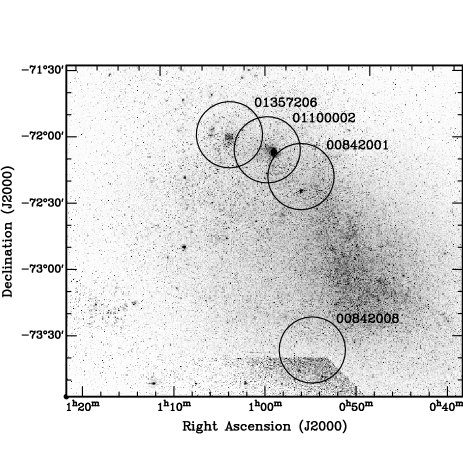
For AO-1 of XMM-Newton, we proposed observations of eight fields in the SMC in order to study the X-ray binary population (PI: W.P.). Two observations of this proposal were performed. During the first observation (ID 00842008), the telescope pointed towards the HMXB SMC X-2 in the south of the main galaxy. In order to perform source detection and analysis in the whole field of view, we used data from the European Photon Imaging Cameras EPIC PN (Strüder et al., 2001), EPIC MOS1, and EPIC MOS2 (Turner et al., 2001). The observation was performed with all the EPIC cameras in full frame mode. For EPIC PN the thin filter was used, whereas for the EPIC MOS cameras medium filters were chosen. The next observation, ID 00842001, covered a region in the north of the SMC. The CCD read out modes and the filters of the EPIC cameras were the same as in the first observation.
Moreover, we searched the XMM-Newton Science Data Archive for public data of the SMC, suitable for our purposes. We found two data sets (ID 01100002 and 01357206) of fields in the north of the SMC, slightly overlapping with each other as well as with the pointing ID 00842001. The details of the observations are summarised in Table 1.
2.1 Source detection
| 1 | 2 | 3 | 4 | 5 | 6 | 7 | 8 |
| No | Obs. ID | RA | Dec | Pos. err. | Count rate | Det. ML | Flux |
| (J2000.0) | [″] | [s-1] | [erg cm-2 s-1] | ||||
| 01 | 00842008 M1 | 00 51 56.05 | –73 41 51.4 | 2.1 | 84.2 | ||
| 02 | 00842008 PN | 00 54 33.4 | –73 41 04♢ | – | 3.4 | ||
| 03 | 00842001 PN | 00 54 56.02 | –72 26 48.6 | 1.0 | 267.1 | ||
| 04 | 00842001 PN | 00 56 05.24 | –72 22 00.9 | 2.0 | 76.0 | ||
| 05 | 00842001 PN | 00 57 19.58 | –72 25 35.1 | 0.5 | 225.6 | ||
| 06 | 00842001 PN | 00 57 35.71 | –72 19 32.6 | 0.9 | 478.5 | ||
| 06a | 01100002 PN | 00 57 35.56 | –72 19 36.8 | 2.9 | 55.9 | ||
| 07 | 01100002 PN | 00 57 50.22 | –72 02 37.0 | 0.7 | 1147.0 | ||
| 08 | 01100002 PN | 00 57 50.80 | –72 07 58.7 | 0.5 | 2798.1 | ||
| 09 | 00842001 PN | 00 58 11.68 | –72 30 50.4 | 1.7 | 120.2 | ||
| 10 | 01100002 M1 | 00 59 21.01 | –72 23 18.4 | 0.8 | 1269.6 | ||
| 10a | 00842001 PN | 00 59 21.10 | –72 23 15.8 | 0.9 | 828.9 | ||
| 11 | 01100002 PN | 01 00 16.18 | –72 04 45.8 | 1.2 | 237.5 | ||
| 12 | 01100002 PN | 01 00 30.23 | –72 20 35.1 | 3.2 | 25.8 | ||
| 13 | 01357206 PN | 01 01 02.98 | –72 06 59.5 | 2.9 | 38.2 | ||
| 13a | 01100002 PN | 01 01 03.87 | –72 07 02.4 | 3.8 | 23.0 | ||
| 14 | 01100002 PN | 01 01 20.82 | –72 11 21.1 | 0.6 | 1689.6 | ||
| 14a | 01357206 PN | 01 01 20.87 | –72 11 16.8 | 1.0 | 368.7 | ||
| 15 | 01357206 PN | 01 01 37.56 | –72 04 18.7 | 1.0 | 436.3 | ||
| 15a | 01100002 PN | 01 01 37.77 | –72 04 22.1 | 1.2 | 222.7 | ||
| 16 | 01357206 PN | 01 03 14.11 | –72 09 14.2 | 0.5 | 2049.8 | ||
| 17 | 01357206 PN | 01 03 37.57 | –72 01 33.2 | 0.2 | 17172.3 | ||
| 18 | 01357206 PN | 01 05 55.38 | –72 03 47.9 | 1.6 | 119.5 | ||
Notes to column No 1: Observation ID and the instrument with which the detection with the highest likelihood was achieved.
Notes to columns No 3 – 5: Position of the XMM-Newton detections with 1 statistical positional error, except for No 02, for which the position of the optical counterpart♢ is given.
Notes to column No 6: Count rate for EPIC PN detection (except for entries No 01 and 10 which are EPIC MOS1 detections, and † 3 upper limit for No 02).
Notes to column No 7: Maximum likelihood (ML) of detection for the total band (0.3 – 10.0 keV).
Notes to column No 8: Flux (0.3 – 10.0 keV) calculated from the best fit model spectrum, setting the Galactic foreground absorption to zero. See Sect. 2.2 for used models. In order to obtain the luminosity, multiply by cm2.
| 1 | 9 | 10 | 11 | 12 | 13 | 14 | 15 |
| No | HR1 | HR2 | HR3 | P | OGLE Name | [MA93] | |
| [s] | [″] | ||||||
| 01 | +0.150.20 | +0.090.18 | –1.000.26 | – | – | – | – |
| 02 | – | – | – | too weak | – | – | – |
| 03 | +0.410.12 | –0.030.11 | –0.300.17 | 59.000.02 | 1.2 | 00545617–7226476 | 810 |
| 04 | +1.000.23 | –0.150.17 | –0.130.25 | 140.10.3* | – | – | 904 |
| 05 | +0.490.05 | –0.290.05 | –0.360.08 | – | 1.8 | 00571981–7225337 | – |
| 06 | +0.450.11 | +0.040.09 | –0.410.11 | 1.9 | |||
| 06a | +0.800.31 | +0.100.26 | –0.540.43 | – | 3.5 | 00573601–7219339 | 1020 |
| 07 | +0.190.09 | +0.030.08 | –0.140.10 | 281.10.2 | – | – | 1036 |
| 08 | +0.480.07 | +0.250.05 | –0.060.06 | 152.340.05* | – | – | 1038 |
| 09 | +1.000.33 | +0.440.21 | +0.510.13 | – | 4.5 | 00581258–7230485 | – |
| 10 | +0.490.07 | –0.150.07 | –0.210.10 | 1.2 | |||
| 10a | +0.270.09 | –0.050.09 | +0.120.09 | – | 1.4 | 00592103–7223171 | – |
| 11 | +0.180.14 | –0.190.14 | –0.460.21 | – | – | – | – |
| 12 | +1.000.13 | –0.370.29 | +0.010.52 | – | – | – | 1208 |
| 13 | +0.370.29 | –0.300.25 | +0.060.41 | ||||
| 13a | –0.250.36 | –0.210.48 | +0.400.41 | – | – | – | 1240 |
| 14 | +0.140.08 | +0.210.07 | +0.060.07 | 452.20.5 | 2.6 | ||
| 14a | +0.260.12 | +0.060.12 | –0.100.15 | too weak | 2.2 | 01012064–7211187 | 1257 |
| 15 | +0.170.10 | –0.230.10 | –0.200.16 | ||||
| 15a | +0.170.13 | –0.360.12 | –0.260.30 | – | – | – | 1277 |
| 16 | +0.160.07 | +0.110.06 | +0.000.06 | 341.70.4 | – | – | 1367 |
| 17 | +0.280.03 | +0.180.02 | +0.070.02 | – | – | – | 1393 |
| 18 | –0.190.18 | +0.120.18 | +0.220.16 | – | – | – | 1557 |
Notes to columns No 9 – 11: Hardness ratios as defined in Eq. (1).
Notes to column No 12: Pulse periods from timing analysis. * New X-ray binary pulsar!
Notes to column No 13: Distance to OGLE object.
Notes to column No 15: Entry numbers in Meyssonnier & Azzopardi (1993).
| 1 | 16 | 17 | 18 | 19 | 20 | 21 |
| No | HRI | PSPC | [HS2000] | Source ID | Remarks | |
| [″] | ||||||
| 01 | – | – | – | – | RX J0051.7–7341 | XRB? |
| 02 | 22.8 | – | 547 | 28 | SMC X-2 | HMXB Be, P |
| 03 | 4.5 | 058 | 241 | 31 | RX J0054.9–7226 | HMXB Be, P |
| 04 | – | – | – | 32 | XMMU J005605.2–722200 = 2E 0054.4–7237? | HMXB?, P |
| 05 | 5.6 | – | 234 | – | 2E 0055.6–7241, RX J0057.3–7225 | AGN, = 0.15 |
| 06 | ||||||
| 06a | – | – | – | – | XMMU J005735.7–721932 = [YIT2000] 19? | new HMXB? |
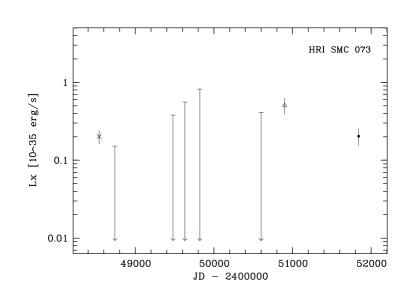
| 07 | 8.1 | 073 | 114 | 35 | AX J0058–720, RX J0057.8–7202 | HMXB?, P |
| 08 | 7.3 | 074 | 136 | 36 | RX J0057.8–7207 | HMXB?, P |
| 09 | 4.3 | 076 | – | 38 | RX J0058.2–7231 | HMXB Be |
| 10 | 2.9 | |||||
| 10a | 4.7 | 081 | 218 | – | RX J0059.3–7223 | XRB? |
| 11 | 6.6 | 088 | 123 | – | RX J0100.2–7204 | XRB? AGN? |
| 12 | – | – | – | – | XMMU J010030.2–722035 | new HMXB? |
| 13 | 4.8 | |||||
| 13a | 9.8 | 093 | 132 | 42 | RX J0101.0–7206 | HMXB Be |
| 14 | 6.3 | – | ||||
| 14a | 6.3 | 095 | 159 | 43 | RX J0101.3–7211 | HMXB Be, P |
| 15 | 5.3 | |||||
| 15a | 7.4 | 096 | 121 | 44 | RX J0101.6–7204 | HMXB? |
| 16 | 4.6 | 101 | 143 | 49 | AX J0103–722, SAX J0103.2–7209 | HMXB Be, P |
| 17 | 2.6 | 105 | 106 | 50 | RX J0103.6–7201 | HMXB? |
| 18 | 6.9 | – | 120 | 55 | RX J0105.9–7203 | HMXB? |
Notes to column No 16: Distance to ROSAT source.
Notes to columns No 17 – 19: Entry numbers in ROSAT HRI catalogue (Sasaki et al., 2000), ROSAT PSPC catalogue (Haberl et al., 2000), and Haberl & Sasaki (2000).
Notes to column No 20: YIT2000: Yokogawa et al. (2000).
Notes to column No 21: HMXB: High mass X-ray binary, HMXB?: HMXB candidate, XRB?: X-ray binary candidate, Be: Be system, P: pulsar.
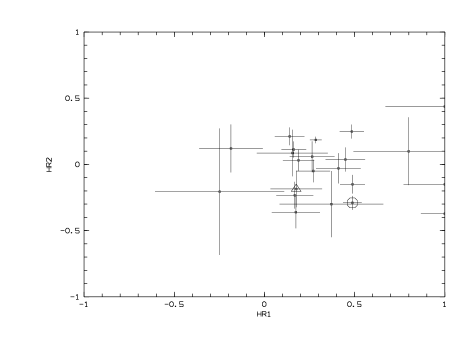
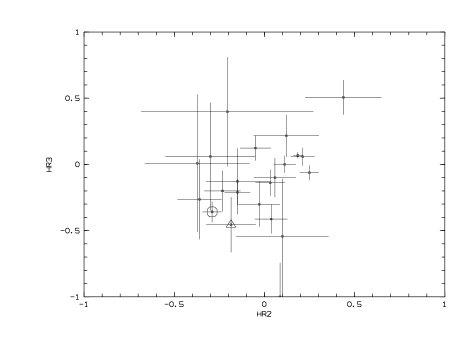
All the data were processed with the XMM-Newton Science Analysis System (SAS) version 5.3.3. For source detection, the events were separated into four energy bands: B1 = 0.3 – 1.0 keV, B2 = 1.0 – 2.0 keV, B3 = 2.0 – 4.5 keV, and B4 = 4.5 – 10.0 keV. In all these bands, images were created and source detection was performed using the sliding window and maximum likelihood methods of the SAS. Detections with likelihood of existence (ML) higher than 10.0 were accepted as real sources. This corresponds to the probability for the existence of the source. Hardness ratios were computed using the source counts in different bands:
| (1) |
for . The values of HR1, HR2, and HR3 are shown in two diagrams in Fig. 2. In most cases, X-ray binaries in the SMC or Active Galactic Nuclei (AGNs) behind the SMC have absorbed spectra and therefore show positive values for HR1. As can be seen in the second diagram, HR2 and HR3 which compare the events in the energy bands above 1.0 keV, cluster around zero. A large fraction of the sources (90%) is located in a region with HR2 and HR3 .
The detected sources were cross-correlated with catalogues of Einstein sources (Wang & Wu, 1992) as well as ROSAT sources detected by PSPC (Kahabka et al., 1999; Haberl et al., 2000) and by HRI (Sasaki et al., 2000) instruments. The positions of the X-ray sources were plotted on Digitized Sky Survey DSS2 (red) images of this field in order to find probable optical counterparts. The optical sources were also verified by cross-correlating the X-ray source list with the USNO-A2.0 catalogue produced by the United States Naval Observatory (Monet, 1996, 1998). In addition, we compared the source positions to the entries in the Optical Gravitational Lensing Experiment OGLE-II project list of variable sources in the Magellanic Clouds (Zebrun et al., 2001). For five out of 15 sources, correlations with an OGLE object were found. Finally, the source list was cross-correlated with the list of emission line objects in the SMC (Meyssonnier & Azzopardi, 1993, [MA93]). The existence of an emission line star at the position of a hard X-ray source indicates that the source might be an X-ray binary system with a Be-star companion.
The complete set of source lists will be presented in another paper. Here, we shall concentrate on the HMXBs and candidates in the four fields. The results on the eighteen sources are summarised in Table 2. The table includes the X-ray source coordinates, 1 positional error, count rate, likelihood for detection in the total band, flux, hardness ratios (see Eq. (1)), pulse period with 1 error (Sect. 2.2), and identifications. Correlations with ROSAT sources, OGLE objects, and emission line objects (Meyssonnier & Azzopardi, 1993) can be found as well. The sources are sorted by RA and Dec (J2000.0), and the entry numbers are used in the following. The positional errors which are given in this table are statistical errors. The systematic error of the X-ray position is about 3″ – 4″ (Barcons et al., 2002). In order to calculate the flux, model parameters resulting from the spectral analysis (see Sect. 2.2) were used for all sources.
In the following, the source number in the ROSAT HRI catalogue of the SMC (Sasaki et al., 2000) is given as RH NNN, and the number in the ROSAT PSPC catalogue (Haberl et al., 2000) as RP NNN. The entry number in the list of Haberl & Sasaki (2000, [HS2000]) is also mentioned using the format [HS2000] NN (also see Table 2).
2.2 Timing and spectral analysis
| 1 | 2 | 3 | 4 | 5 | 6 | 7 | 8 | 9 | 10 |
| No | ID | Abund. | Thermal | dof | No | ||||
| [cm-2] | [keV] | (solar) | model | ||||||
| 05 | 2E 0055.6–7241 | – | – | – | 41.4 | 51 | 2 | ||
| 06 | XMMU J005735.7–721932 | – | – | – | 84.6 | 63 | 4 | ||
| 07 | AX J0058–720 | – | – | – | 91.6 | 65 | 3 | ||
| 08 | RX J0057.8–7207 | – | – | – | 161.9 | 133 | 3 | ||
| 10 | RX J0059.3–7223 | – | – | – | 117.8 | 99 | 5 | ||
| 11 | RX J0100.2–7204 | – | – | – | 28.9 | 26 | 3 | ||
| 14 | RX J0101.3–7211 | MEKAL | 82.6 | 56 | 2 | ||||
| 15 | RX J0101.6–7204 | – | – | – | 68.0 | 58 | 6 | ||
| 16 | AX J0103–722 | MEKAL | 172.7 | 155 | 3 | ||||
| 17 | RX J0103.6–7201 (Model 1) | MEKAL | 295.1 | 240 | 3 | ||||
| (Model 2) | (O) | VMEKAL | 272.9 | 238 | 3 | ||||
| (Ne) |
Notes to column No 9: Degrees of freedom.
Notes to column No 10: Number of used spectra.
As the very first step of data analysis, we checked the EPIC PN data for incorrect time information. It has been reported that in some cases, there are time jumps of 1 s in the EPIC PN data which were not corrected in the SAS processing. Since we didn’t find any event which indicated such a time jump, we could proceed without any countermeasure.
After selecting the events for each source, they were analysed using the XANADU software package distributed by the High Energy Astrophysics Science Archive Research Center (HEASARC). It contains the packages XRONOS for timing analysis and XSPEC for spectral fitting.
Based on EPIC PN data, period search was carried out with XRONOS after correcting the photon arrival times for solar system barycentre. If a peak was found in the power spectrum indicating pulsations, a more detailed epoch folding search was performed around the preliminary value. Once we got the rough value for the pulse period, the distribution around this value was fitted with a Lorentz profile and the maximum of the Lorentz profile was determined together with the 1 error. Finally, folded light curves were created in three energy bands: B1 = 0.3 – 1.0 keV, B2 = 1.0 – 2.0 keV, B3+4 = 2.0 – 10.0 keV. In addition, the ratio of the count rates in the harder band to the softer band (B2/B1 and B3+4/B1+2, with B1+2 = 0.3 – 2.0 keV) were computed to illustrate the changes in the hardness ratios with pulse phase. Note that these hardness ratios are different to the numbers defined in Eq. (1).
Except for sources which were too faint, spectra were extracted for each source. These spectra were modelled with a power law component together with the fixed Galactic foreground absorbing column density of cm-2 (Dickey & Lockman, 1990) and a free column density :
| (2) |
being the energy in [keV], the photon index, and the normalisation. In some cases there was a deviation of the observed spectrum from a power law spectrum, suggesting the existence of an additional soft component. Since the spectra show features indicating emission lines, the soft component was modelled as thermal plasma emission. This thermal emission presumably arises from circumstellar matter, and the absorption must be negligibly low in comparison to the absorption of the hard X-ray emission from the neutron star. Moreover, if the column density was high, the soft emission would be absorbed and thus not detectable. Using the MEKAL model in XSPEC (Mewe et al., 1985, 1986; Kaastra, 1992; Liedahl et al., 1995) for the thermal component without additional absorbing column density, the spectrum can be written as
| (3) | |||||
is the MEKAL model spectrum with a temperature corresponding to in [keV] and elemental abundances with respect to solar. We also performed a fit with a blackbody component instead of the MEKAL model. Although for fainter sources, no significant difference was found in the fits, for bright sources like No 16 (Fig. 13) and No 17 (Fig. 14), the blackbody fit results in higher : 231.5 for 156 degrees of freedom for source No 16 and 322.5 for 241 degrees of freedom for source No 17 (compare to Table 3). This is because the blackbody model fits the low energy tail of the spectrum, but does not account for the peaks around 0.6 keV and 0.9 keV, which might indicate emission lines from highly ionized oxygen and neon, as well as iron lines. For sources which were bright enough to obtain a significant spectral fit, the results are shown in figures and the model parameters yielding the best fit results are listed in the Table 3 together with 1 errors. Moreover, for source No 17 which is very bright and shows emission lines most prominently, we also used the VMEKAL instead of the MEKAL model. In this more elaborate model, the abundance for each of the element is a variable fit parameter. We obtained an improved fit with high oxygen and neon abundances, whereas the other elements have values below solar, not differing significantly from zero.
From the spectral models for the emission we were able to estimate the flux of the sources in the ROSAT band (0.1 – 2.4 keV). The flux was calculated from the fitted models, except for four sources which were too faint: For No 02, a power law spectrum with and cm-2 (Yokogawa et al., 2001) was assumed to estimate the flux upper limit. For No 01, 09, and 12, and cm-2 were adopted. The resulting luminosity was used to create a long term light curve of all the ROSAT and the new XMM-Newton data. In the light curves, crosses are used for ROSAT PSPC data, triangles for ROSAT HRI data, and dots for XMM-Newton EPIC data. Upper limits determined from ROSAT observations are plotted as arrows. For the distance to the SMC, a mean value of 60 kpc was assumed (see review by van den Bergh, 1999).
3 Comments on individual HMXBs and candidates
In this section, we present the results on individual sources. All sources, which were detected in the four data sets and were proven to be HMXBs or candidates, are listed in Table 2.
3.1 Source No 1: RX J0051.7–7341
RX J0051.7–7341 which has been suggested as an XRB candidate by Kahabka et al. (1999) was only detected in MOS1/2 data. In the PN data the source was located on a bad column. It is faint, so neither spectral nor timing analysis was performed for this source. The PSPC count rate of s-1 (Kahabka et al., 1999) during the ROSAT observation corresponds to XMM-Newton MOS (medium filter) count rate of about s-1. This means that the luminosities of the source during the ROSAT and XMM-Newton observations were comparable (see Table 2).
3.2 Source No 2: SMC X-2
SMC X-2 was one of the first three X-ray sources which were discovered in the SMC (Clark et al., 1978). It was also detected in the HEAO 1 A-2 experiment (Marshall et al., 1979), but not in the Einstein IPC survey (Seward & Mitchell, 1981). In ROSAT observations, this transient source was detected only once (Kahabka & Pietsch, 1996). It is thought to be a Be/XRB, since a Be-star was found as its optical counterpart (Murdin et al., 1979). In early 2000, the RXTE All-Sky Monitor detected an outburst at the position of SMC X-2 (Corbet et al., 2001) and a pulse period of 2.3740.007 s was determined (Corbet & Marshall, 2000; Torii et al., 2000).
In the XMM-Newton data (Obs. ID 00842008), there was no detection with ML 10 (see Sect. 2.1) at the position of SMC X-2 which was apparently in low luminosity state during the XMM-Newton observation. Therefore, we performed source detection using the maximum likelihood routine at the position of the optical counterpart (SIMBAD): RA = 00h 54m 33.4s, Dec = –73° 41′ 04″ (J2000.0). Since we set the ML limit lower, the source was detected with a likelihood of ML = 3.4. The 3 upper limit count rate obtained from the ML source detection routine is s-1. The source counts were highest in the B3 band (2.0 – 4.5 keV). In order to estimate the flux upper limit, spectral parameters derived by Yokogawa et al. (2001) from the ASCA spectrum during the outburst were used: Photon index for a power law spectrum absorbed by a column density of cm-2. This results in an upper limit for the un-absorbed flux of erg cm-2 s-1, corresponding to erg s-1 (0.3 – 10.0 keV) during the XMM-Newton observation in Oct. 2001.
3.3 Source No 3: RX J0054.9–7226


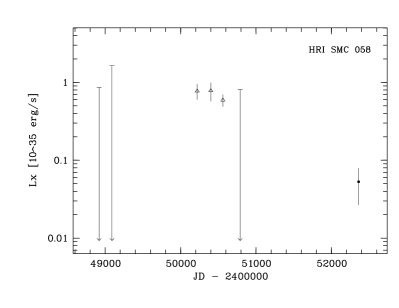
RX J0054.9–7226 is known to be an X-ray binary pulsar with a pulse period of 58.9690.001 s (Marshall et al., 1998; Santangelo et al., 1998) and is the only source in our sample, for which the orbital period has been measured: 65 d (Lochner et al., 1999). In the timing analysis of the new XMM-Newton data, the pulse period was verified to be 59.000.02 s. The folded light curves show variations especially above 1.0 keV, and there is no significant change in hardness ratios (Fig. 3). As can be seen in the long term light curve, compared to ROSAT data, the source was observed in low luminosity state. Due to the low flux, the statistics of the spectrum were not high enough and the spectrum is thus not discussed here. However, the results of the spectral analysis was used to estimate the flux of the source (see Table 2). The optical counterpart, a Be-star, is identified with the variable star OGLE 00545617–7226476 (Zebrun et al., 2001).
3.4 Source No 4: XMMU J005605.2–722200 = 2E 0054.4–7237?


The error circle of the Einstein source 2E 0054.4–7237 includes an emission line object. Therefore, it was suggested as a Be/XRB candidate ([HS2000]). In the XMM-Newton data, a source consistent with the position of the emission line object was detected (XMMU J005605.2–722200) and pulsations from this source was discovered. XMMU J005605.2–722200 is most likely consistent with 2E 0054.4–7237. The period is 140.10.3 s. As can be seen in Fig. 4, the pulses in the soft band are narrower than in the harder band.
3.5 Source No 5: 2E 0055.6–7241

2E 0055.6–7241 had been suggested as an XRB candidate by Kahabka et al. (1999). Timing analysis revealed no pulsations of the X-ray source. Also on longer timescales no flux change was verified: The ROSAT PSPC count rate was s-1 (Kahabka et al., 1999), corresponding to a count rate of s-1 for XMM-Newton EPIC PN (thin1 filter). This value is similar to the count rate of the XMM-Newton observation, which is s-1. The X-ray spectrum is shown in Fig. 5. It has a photon index of , which is higher than for other sources of our sample, and highest absorbing column density of cm-2 (also see Table 3). A difference to other sources is also seen in the hardness ratios, as the source has a relatively high HR1 and lower values of HR2 and HR3 (HR1 = +0.490.05, HR2 = –0.290.05, HR3 = –0.360.08, also see Fig. 2). The high absorption makes HR1 positive, whereas HR2 and HR3 are negative due to steeper power law spectrum.
On the DSS2 (red) image, there is a source at the X-ray position, which coincides with the variable object OGLE 00571981–72253375 (Zebrun et al., 2001) with and (USNO-A2.0 0150-00625436), i.e. . Sasaki et al. (2000) have shown, that all the HMXBs and candidates in the SMC HRI catalogue have and , whereas e.g. AGNs have and . Both the optical magnitudes and the X-ray spectra indicate that this source might as well be an AGN. Spectroscopy of the optical counterpart by Dobrzycki et al. (2003) showed that this object is a = 0.15 quasar located behind the SMC.
3.6 Source No 7: AX J0058–720


The pulse period of AX J0058–720 was determined from the ASCA data as 280.40.3 s (Yokogawa & Koyama, 1998), which we confirmed in the XMM-Newton data: 281.10.2 s. It shows strong pulses in the softer bands and its spectrum becomes harder during the ’off’ time (Fig. 6). The residuals of the power law fit (Table 3 and Fig. 6) indicate the existence of an additional soft component. The source has been suggested as a HMXB candidate due to the likely optical counterpart, which is an emission line object ([HS2000]).
3.7 Source No 8: RX J0057.8–7207


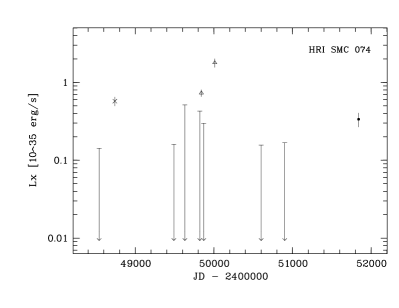
RX J0057.8–7207 is a HMXB candidate with an emission line object suggested as a likely optical counterpart ([HS2000]). We discovered pulsations in the new XMM-Newton data and derived a pulse period of 152.340.05 s. For this source, a period of 152.0980.016 s was independently found in Chandra data by Macomb et al. (2003). The folded light curves in Fig. 7 show, that there are correlated flux variations in all bands with a significant minimum at phase 0.4. Especially in the hard band, there is a slow increase and fast decay. Therefore, the hardness ratio falls off at phase 0.2 and increases slowly after phase 0.7. The source spectrum is well reproduced by a power law spectrum (see Table 3) with a significant absorption within the SMC or the source itself. As can be seen in the long term light curve, there was a weak flare observed by ROSAT, whereas the XMM-Newton observation was performed in a low luminosity state, 5.3 times lower than the maximum observed by ROSAT.
3.8 Source No 9: RX J0058.2–7231
The source corresponding to the optically identified HMXB RX J0058.2–7231 is very faint, so that no timing analysis could be performed. However, the hardness ratios HR1, HR2, and HR3 indicate, that this source has a hard spectrum. Its optical counterpart is a variable Be star in the SMC, OGLE 00581258–7230485 (Zebrun et al., 2001). From the ROSAT HRI count rate of s-1 (Sasaki et al., 2000) we estimated the corresponding XMM-Newton EPIC PN (thin1 filter) count rate: s-1. The source was about 3.6 times brighter when it was detected by ROSAT than when it was observed by XMM-Newton.
3.9 Source No 10: RX J0059.3–7223

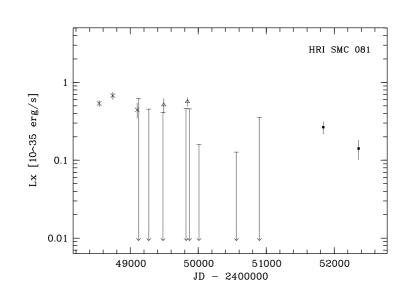
RX J0059.3–7223 has been suggested as an XRB candidate by Kahabka et al. (1999). It was observed by XMM-Newton in two pointings. Its spectrum mainly consists of a power law component typical for a HMXB with additional features (Fig. 8). For this source no pulsations were detected. At its position, there is the variable star OGLE 00592103–7223171 (Zebrun et al., 2001), which is suggested as the optical counterpart. Its magnitudes are and (USNO-A2.0 0150-00660299), which gives . The magnitude in particular is characteristic for a HMXB (see Sect. 3.5).
3.10 Source No 11: RX J0100.2–7204


At the position of the XMM-Newton detection corresponding to RX J0100.2–7204, a very faint object can be found on the DSS2 (red) image. However, there is no entry in the USNO-A2.0 catalogue for this source. We also looked for information in different catalogues using BROWSE of the HEASARC archive, but could not find the magnitudes of this optical source. The X-ray source was suggested as an XRB candidate by Kahabka et al. (1999). The spectrum of the source is a power law with and absorbing column density of cm-2 (Fig. 9). Since the probable optical counterpart is very faint and the power law photon index is higher than for most of the other sources presented here, it can not be ruled out that this source is an AGN (also see Table 3).
3.11 Source No 13: RX J0101.0–7206
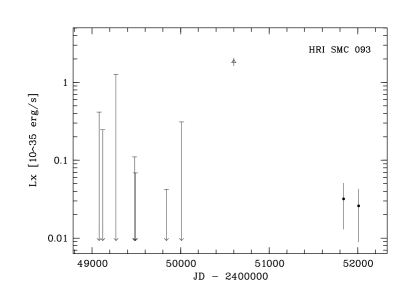
The Be/X-ray binary RX J0101.0–7206 showed a luminosity of erg s-1 in the ROSAT band (0.1 – 2.4 keV) during two XMM-Newton observations. It was about 60 times fainter than at the maximum observed by ROSAT (Fig. 10). Pulsations with a period of 304.490.13 s were discovered in Chandra data (Macomb et al., 2003). This period could not be verified in the XMM-Newton observation, because the source was too faint. Edge & Coe (2003) presented results on the optical analysis of likely counterparts, discussing two objects (No 1 and 4) in the ROSAT PSPC error circle. They conclude that the optical counterpart is object No 1 which is confirmed to be a Be star. This object is also the only optical source, which can be found on the DSS image within the XMM-Newton 1 error circle.
3.12 Source No 14: RX J0101.3–7211


The ROSAT source RX J0101.3–7211 is the first X-ray binary pulsar of which the discovery was based on XMM-Newton data. It was covered in two additional observations finding the source again in a low intensity state. The pulse period of 4552 s (Sasaki et al., 2001) was verified in the new data of the observation ID 01100002: 452.20.5 s. During the observation ID 01357206, the source was too faint for a timing analysis. The folded light curves show strong variation in all bands (Fig. 11). The spectrum of the source becomes harder during pulse minimum. The spectrum is well fitted with a soft thermal component described by a MEKAL model ( keV) with a low metal abundance ( times solar) and a power law component absorbed by a high column density (Table 3). The optical counterpart (OGLE 01012064–7211187) is a Be-star.
3.13 Source No 15: RX J0101.6–7204

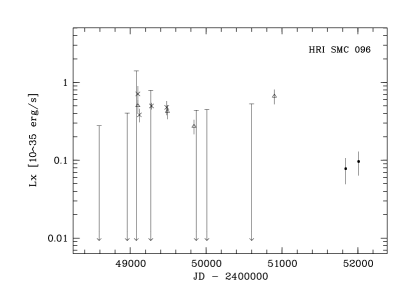
The Be/XRB candidate RX J0101.6–7204 with an emission line star at the ROSAT PSPC and HRI positions ([HS2000]), was observed in two XMM-Newton pointings. Its spectrum and long term light curve are shown in Fig. 12. The spectrum can be modelled as a moderately absorbed power law. No pulsations were discovered.
3.14 Source No 16: AX J0103–722


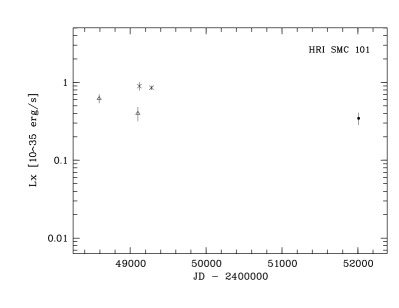
For the Be/X-ray binary AX J0103–722 a pulse period of 345.20.1 s was determined by Israel et al. (1998). In the XMM-Newton data, pulsations were confirmed with a period of 341.70.4 s. The folded light curves show strong variation below 2.0 keV (Fig. 13), whereas in the hard band, the variations are strongly reduced. The spectrum is well reproduced with a power law and a thermal component (see Table 3). The MEKAL model for the thermal component yields keV and metal abundances of with respect to solar.
3.15 Source No 17: RX J0103.6–7201

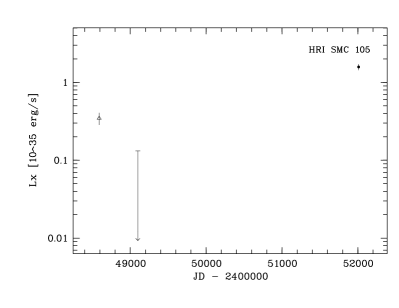
For the HMXB candidate RX J0103.6–7201 ([HS2000]), an acceptable fit was obtained for the spectrum with a power law and a thermal component (Table 3). Modelling the thermal component with MEKAL, we obtained and metal abundances of times solar. Since the source was bright, we also used the VMEKAL model instead of the MEKAL model, which allows to determine the abundance for each of the elements. This resulted in an improvement of the fit, the model reproducing the peaks around 0.6 and 0.9 keV. The photon indices and the absorbing column densities for both fits are comparable, as can be seen in Table 3. Also the temperature values agree well for MEKAL and VMEKAL within the 1 errors. The spectrum with the power law + VMEKAL fit is shown in Fig. 14. The comparison to ROSAT data shows that this source was in high luminosity state during the XMM-Newton observation with erg s-1 (0.3 – 10.0 keV). In spite of the high photon statistics with 3,300 counts, no pulsations were discovered. Also the analysis of the events separated into soft, medium, and hard band revealed no pulsations.
3.16 Source No 18: RX J0105.9–7203
RX J0105.9–7203 is a HMXB candidate, coinciding with an emission line object. Since the source was very faint during the XMM-Newton observation, the photon statistics are very low and no timing analysis was possible. The PSPC count rate derived from the ROSAT observation was s-1 (Haberl et al., 2000), corresponding to s-1 for XMM-Newton EPIC PN (thin1 filter). With a count rate of s-1 (Table 2), the source was fainter during the XMM-Newton observation.
4 Sources No 6 and 12: New HMXB candidates

To identify a HMXB, it is crucial to find an optical counterpart and confirm that it is an early-type star. If an emission line object is found at the position of a hard X-ray source and other objects are ruled out as counterpart, the source is presumably a Be/XRB. Cross-correlating the XMM-Newton source list with the emission line star catalogue of Meyssonnier & Azzopardi (1993), we discovered two new sources which met these criteria.
XMMU J005735.7–721932 (source No 6) is found at the position of [MA93]1020 and likely coincides with the source No 19 in Yokogawa et al. (2000). XMMU J010030.2–722035 (source No 12) is associated with [MA93]1208. Both X-ray sources are very faint. Only for XMMU J005735.7–721932, we had enough counts to extract a spectrum (Fig. 15). The best fit model is a moderately absorbed power law (Table 3). Furthermore, Chandra data showed that this source has pulsed emission with a period of 564.810.41 s (Macomb et al., 2003). This period could not be confirmed in the XMM-Newton data.
As indicated by the hardness ratio HR1, these sources have a hard spectrum. Therefore, these two sources are suggested as new Be/XRB candidates. For further investigation, we need to perform follow-up observation in the optical band in order to verify if the emission line objects are Be stars.
5 Discussion
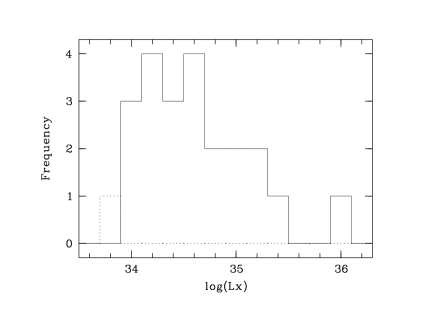
The comparison between the XMM-Newton sources detected with ML 10 and other X-ray catalogues (Wang & Wu, 1992; Kahabka et al., 1999; Haberl et al., 2000; Sasaki et al., 2000) demonstrates that we detected all known HMXBs and candidates which exist in the four observed fields, except for SMC X-2 which was very faint. SMC X-2 was marginally detected with a likelihood of ML = 3.4, and we derived an upper limit of erg s-1 (0.3 – 10.0 keV). The luminosities of all the other sources in the 0.3 – 10.0 keV band are higher than erg s-1 at an assumed distance of 60 kpc (van den Bergh, 1999), as is shown in Fig. 16. As we have seen in the long term light curves, most of the sources were in quiescence during the XMM-Newton observations, whereas they were mostly detected during outburst by previous missions. This indicates that all known HMXBs in the SMC have luminosities higher than erg s-1 in quiescence and can be detected by XMM-Newton in observations with an exposure of about 15 ks. Consequently, we have an extensive set of HMXBs for studying their properties.
In order to visualise the spectral characteristics of the HMXBs, we plotted the hardness ratios HR1, HR2, and HR3 in Fig. 2. The high absorption in XRBs causes positive values for HR1, while HR2 and HR3 have small absolute values around zero. AGNs typically show steeper X-ray spectra than HMXBs. Therefore, the two source classes can be disentangled using hardness ratios. This can also be applied to classification work on other nearby galaxies.
5.1 Pulsations and soft energy emission
X-ray spectra of high mass X-ray binaries below 10 keV can be in general modelled as a power law with a photon index of . For HMXBs located far away from the Galactic plane or in the Magellanic Clouds, the interstellar absorption in the line of sight is low, and an additional soft spectral component was discovered in supergiant X-ray binary systems like SMC X-1 (Marshall et al., 1983; Woo et al., 1995) or LMC X-4 (Woo et al., 1996), as well as in Be/X-ray binary systems like RX J0059.2–7138 (Kohno et al., 2000) or EXO 053109–6609.2 (Haberl et al., 2003).
In our sample of HMXBs and candidates in the SMC, pulsations were confirmed for six sources. Studying the pulsations and hardness ratio changes in different bands, we found that there are different types of pulsations. Furthermore, four out of these six were bright enough to allow us to test the existence of a soft component in their spectra. The pulsating sources of our sample can be divided into four groups:
- 1.
-
2.
Pulsations are discovered below 2 keV (AX J0058–720, Fig. 6 and AX J0103–722, Fig. 13). There might be pulsations also in the hardest band, although not significant due to low statistics. The hardness ratios seem to become higher during pulse minimum. The spectra of these sources include a thermal component. If it is confirmed that pulsations are in fact existent only in the soft band, this will suggest that their origin is of small size, probably locally illuminated surface or surroundings of the neutron star.
-
3.
In the case of RX J0057.8–7207 (Fig. 7), there are flux variations in all bands. Most pronounced pulsations are found above 2 keV with correlated increase of the hardness ratio, which follows the pulse shape of the hard band. Since the spectrum is a perfect power law, the coincidence of the maximum of the hardness ratio and that of the pulse might indicate a variation of the absorption ().
-
4.
RX J0101.3–7211 (Fig. 11) shows clear pulsations in all bands and becomes harder significantly at pulse minimum. In its spectrum, there is a low energy excess besides the power law component, which can be modelled as a thermal emission. The pulsations in the soft band might be caused by variations as well as by changes in the soft emission component.
The low energy component, which seems to be thermal was also found in the spectrum of RX J0103.6–7201. This source is variable on long timescales, as can be seen in Fig. 14. However, pulsations on short timescales were not discovered, although the source was brighter during the XMM-Newton observation than in former observations.
5.2 Origin of the soft emission
The low energy component in the spectrum of the supergiant systems SMC X-1 (Marshall et al., 1983) and LMC X-4 (Woo et al., 1996) was modelled as blackbody emission or thermal Bremsstrahlung which arises from the stellar wind of the supergiant, the accretion disk, or the fan-beam of the accretion column close to the neutron star surface. However, Paul et al. (2002) pointed out that a power law nature is most probable for the soft emission. They derived that the pulse shape of the soft emission from SMC X-1 is sinusoidal, similar to the soft energy light curve of Her X-1 (e.g. Oosterbroek et al., 1997). In our Galaxy, the supergiant system Vela X-1 is thought to show emission from the atmosphere and stellar wind of the companion as well as from the gas stream towards the neutron star (Haberl & White, 1990, and references therein). High resolution spectroscopy of Galactic HMXBs like Cen X-3 (with Chandra HETG, Wojdowski et al., 2002) or Her X-1 (with XMM-Newton RGS, Jimenez-Garate et al., 2002) resolved fluorescent lines and hydrogen- and helium-like lines of elements from Ne to Fe. The line fluxes of Cen X-3 are consistent with recombination radiation from photo-ionised and collisionally ionised plasma as well as resonant line scattering in photo-ionised plasma (Wojdowski et al., 2002).
As for the Be/X-ray binary systems, Kohno et al. (2000) analysed both ASCA and ROSAT data of RX J0059.2–7138 and found that there is a soft component in the spectrum, which can be modelled as a thermal emission with keV. Below 2.0 keV, the source shows no pulsations. Therefore they argue that the soft emission originates from a large region comparable to the full binary system. Using an XMM-Newton observation of a northern field in the LMC, Haberl et al. (2003) extracted emission from the Be/X-ray binary EXO 053109–6609.2 and showed that there are strong pulsations above 0.4 keV. In the spectrum there is a low energy thermal component, which is believed to arise from the equatorial disk around the Be star, illuminated by the X-ray source.
The origin of the soft emission from HMXBs is not clearly understood. One would expect that there are differences between a supergiant and a Be system. Most of the HMXBs which have been studied in detail (since they are located in the Milky Way and therefore closer) are supergiant systems, whereas the sources in the SMC we are confronted with, are Be systems. In Be/XRBs, the neutron star and the Be star are thought to form a binary system with an extended orbit. This makes the stellar material in the equatorial disk around the Be star as the origin of the soft pulsed emission rather implausible. The HMXBs in the MCs are ideal objects to study the soft part of their spectrum, since the absorption by Galactic foreground matter is low in the direction of the MCs. The existence of a soft thermal component in the spectrum and pulsations below 1 – 2 keV in our data indicates that the size of the origin of the soft emission is not as large as is assumed for e.g. RX J0059.2–7138. In addition to timescales and luminosities, a crucial parameter for the physical processes responsible for this emission is the magnetic field of the neutron star. In order to clarify the conditions in which the soft component is produced, at least we need to get information about the orbital motion and about a possible orbital phase dependence of the total source spectrum as well as the pulsed emission. As for the SMC Be systems discussed here, the orbital period is known only for one source.
5.3 OB systems vs. Be systems
In the last few years, the number of known Be/XRBs in the SMC increased drastically based on temporal studies of hard X-ray sources and optical observations. In order to identify an X-ray source as a HMXB and clarify the nature of the mass donor star, we need to perform spectroscopy of the optical counterpart. Since most of the HMXB candidates which are known now are correlated to emission line objects, we expect that additional Be/XRBs will be found in the near future. This will further increase the ratio between the Be systems and the OB systems among the HMXBs in the SMC. Be/XRBs are thought to evolve from binary systems in about yrs, whereas supergiant systems evolve faster due to the high mass of the companion star. The large number of Be/XRBs sets constraints on the secondary star formation in the SMC, making a burst some yrs ago most likely.
6 Summary
We analysed XMM-Newton EPIC PN and MOS 1/2 data of four pointings towards the SMC. One observation covered the field around the HMXB SMC X-2 in the south, whereas the fields of view of the other three are located in the northern part of the main body of the SMC. In total, there were 15 detections which were identified as known HMXBs or XRB candidates. For SMC X-2 which was faint during the observation, a flux upper limit of erg cm-2 s-1 (0.3 – 10.0 keV) was derived. We found two new sources (XMMU J005735.7–721932 and XMMU J010030.2–722035) which have a hard spectrum and positionally coincide with emission line objects (Meyssonnier & Azzopardi, 1993). These sources are proposed as new HMXB candidates, probably Be systems.
Four sources in our list were known to show pulsed emission and pulse periods had been determined in former observations. In this work, the pulse periods were confirmed for all four sources. Furthermore, we discovered that two other sources which had been proposed to be Be/XRB candidates, show pulsations: XMMU J005605.2–722200 with a pulse period of 140.10.3 s and RX J0057.8–7207 with 152.340.05 s.
Spectral analysis of the sources was performed. For faint sources, a good fit was obtained with a single power law spectrum. However, for three brighter sources, we could show that there is a significant low energy excess in the spectrum, if we only assume a power law. The spectra indicate emission line features, suggesting that the emission is thermal. This soft component was modelled as thermal emission, yielding temperatures of 0.2 – 0.3 keV. The abundances in the emitting plasma are below solar values, but comparable to typical SMC values (Russell & Dopita, 1992): for RX J0101.3–7211 it is times solar, and for AX J0103–722 best fit is obtained with times solar. The errors are 1 values. Only for RX J0103.6–7201 the abundance is higher with with respect to solar.
The flux of the sources in the MCs is low compared to the bright ( erg s-1) HMXBs in our Galaxy, making it difficult to perform a detailed analysis of their soft emission. However, the sources in the MCs have the advantage of low Galactic absorption. This allows us to study the thermal emission from a large sample of HMXBs and to increase the understanding of the interaction between X-rays from the compact object and the ambient stellar matter. It is also important to verify if there is a change in temperature or emissivity, which is related to the orbital phase of the binary system. Due to the improved time resolution and sensitivity, there is a large detection potential for new pulsating XRBs in further XMM-Newton observations.
Acknowledgements.
We would like to thank the anonymous referee for useful comments. The XMM-Newton project is supported by the Bundesministerium für Bildung und Forschung / Deutsches Zentrum für Luft- und Raumfahrt (BMBF/DLR), the Max-Planck Society and the Heidenhain-Stiftung. This research has been carried out by making extensive use of the SIMBAD data base operated at CDS, Strasbourg, France. The Digitized Sky Survey was produced at the Space Telescope Science Institute under U.S. Government grant NAG W-2166. The images of these surveys are based on photographic data obtained using the Oschin Schmidt Telescope on Palomar Mountain and the UK Schmidt Telescope. The plates were processed into the present compressed digital form with the permission of these institutions. This research has made use of data obtained through the High Energy Astrophysics Science Archive Research Center Online Service, provided by the NASA/Goddard Space Flight Center.References
- Barcons et al. (2002) Barcons, X., Carrera, F. J., Watson, M. G., et al. 2002, A&A, 382, 522
- Bruhweiler et al. (1987) Bruhweiler, F. C., Klinglesmith, D. A., Gull, T. R., & Sofia, S. 1987, ApJ, 317, 152
- Clark et al. (1978) Clark, G., Doxsey, R., Li, F., Jernigan, J. G., & van Paradijs, J. 1978, ApJ, 221, L37
- Corbet & Marshall (2000) Corbet, R. & Marshall, F. E. 2000, IAU Circ., 7402, 3
- Corbet et al. (2001) Corbet, R. H. D., Marshall, F. E., Coe, M. J., Laycock, S., & Handler, G. 2001, ApJ, 548, L41
- Dickey & Lockman (1990) Dickey, J. M. & Lockman, F. J. 1990, ARA&A, 28, 215
- Dobrzycki et al. (2003) Dobrzycki, A., Stanek, K., Macri, L., & Groot, P. 2003, AJ, submitted, astro-ph/0301617
- Edge & Coe (2003) Edge, W. R. T. & Coe, M. J. 2003, MNRAS, 338, 428
- Haberl et al. (2003) Haberl, F., Dennerl, K., & Pietsch, W. 2003, A&A, submitted, astro-ph/0212319
- Haberl et al. (2000) Haberl, F., Filipović, M. D., Pietsch, W., & Kahabka, P. 2000, A&AS, 142, 41
- Haberl & Sasaki (2000) Haberl, F. & Sasaki, M. 2000, A&A, 359, 573
- Haberl & White (1990) Haberl, F. & White, N. E. 1990, ApJ, 361, 225
- Israel et al. (1998) Israel, G. L., Stella, L., Campana, S., et al. 1998, IAU Circ., 6999, 1
- Jansen et al. (2001) Jansen, F., Lumb, D., Altieri, B., et al. 2001, A&A, 365, L1
- Jimenez-Garate et al. (2002) Jimenez-Garate, M. A., Hailey, C. J., Herder, J. W. d., Zane, S., & Ramsay, G. 2002, ApJ, 578, 391
- Kaastra (1992) Kaastra, J. S. 1992, An X-Ray Spectral Code for Optically Thin Plasmas (Internal SRON-Leiden Report, updated version 2.0)
- Kahabka & Pietsch (1996) Kahabka, P. & Pietsch, W. 1996, A&A, 312, 919
- Kahabka et al. (1999) Kahabka, P., Pietsch, W., Filipović , M. D., & Haberl, F. 1999, A&AS, 136, 81
- Kohno et al. (2000) Kohno, M., Yokogawa, J., & Koyama, K. 2000, PASJ, 52, 299
- Liedahl et al. (1995) Liedahl, D. A., Osterheld, A. L., & Goldstein, W. H. 1995, ApJ, 438, L115
- Liu et al. (2000) Liu, Q. Z., van Paradijs, J., & van den Heuvel, E. P. J. 2000, A&AS, 147, 25
- Lochner et al. (1999) Lochner, J. C., Whitlock, L. A., Corbet, R. H. D., & Marshall, F. E. 1999, Bulletin of the American Astronomical Society, 31, 905
- Macomb et al. (2003) Macomb, D. J., Fox, D. W., Lamb, R. C., & Prince, T. A. 2003, ApJ, 584, L79
- Marshall et al. (1983) Marshall, F. E., Becker, R. H., & White, N. E. 1983, ApJ, 266, 814
- Marshall et al. (1979) Marshall, F. E., Boldt, E. A., Holt, S. S., et al. 1979, ApJS, 40, 657
- Marshall et al. (1998) Marshall, F. E., Lochner, J. C., Santangelo, A., et al. 1998, IAU Circ., 6818, 1
- Mewe et al. (1985) Mewe, R., Gronenschild, E. H. B. M., & van den Oord, G. H. J. 1985, A&AS, 62, 197
- Mewe et al. (1986) Mewe, R., Lemen, J. R., & van den Oord, G. H. J. 1986, A&AS, 65, 511
- Meyssonnier & Azzopardi (1993) Meyssonnier, N. & Azzopardi, M. 1993, A&AS, 102, 451
- Monet (1996) Monet, D. 1996, in American Astronomical Society Meeting, Vol. 188, 5404
- Monet (1998) Monet, D. G. 1998, in American Astronomical Society Meeting, Vol. 193, 12003
- Murdin et al. (1979) Murdin, P., Morton, D. C., & Thomas, R. M. 1979, MNRAS, 186, 43P
- Negueruela & Coe (2002) Negueruela, I. & Coe, M. J. 2002, A&A, 385, 517
- Oosterbroek et al. (1997) Oosterbroek, T., Parmar, A. N., Martin, D. D. E., & Lammers, U. 1997, A&A, 327, 215
- Paul et al. (2002) Paul, B., Nagase, F., Endo, T., et al. 2002, ApJ, 579, 411
- Price et al. (1971) Price, R. E., Groves, D. J., Rodrigues, R. M., et al. 1971, ApJ, 168, L7
- Russell & Dopita (1992) Russell, S. C. & Dopita, M. A. 1992, ApJ, 384, 508
- Santangelo et al. (1998) Santangelo, A., Cusumano, G., dal Fiume, D., et al. 1998, A&A, 338, L59
- Sasaki et al. (2001) Sasaki, M., Haberl, F., Keller, S., & Pietsch, W. 2001, A&A, 369, L29
- Sasaki et al. (2000) Sasaki, M., Haberl, F., & Pietsch, W. 2000, A&AS, 147, 75
- Seward & Mitchell (1981) Seward, F. D. & Mitchell, M. 1981, ApJ, 243, 736
- Strüder et al. (2001) Strüder, L., Briel, U., Dennerl, K., et al. 2001, A&A, 365, L18
- Torii et al. (2000) Torii, K., Kohmura, T., Yokogawa, J., & Koyama, K. 2000, IAU Circ., 7441, 2
- Turner et al. (2001) Turner, M. J. L., Abbey, A., Arnaud, M., et al. 2001, A&A, 365, L27
- van den Bergh (1999) van den Bergh, S. 1999, in IAU Symp. 190: New Views of the Magellanic Clouds, Vol. 190, 569
- Wang & Wu (1992) Wang, Q. & Wu, X. 1992, ApJS, 78, 391
- Wojdowski et al. (2002) Wojdowski, P., Liedahl, D., Mauche, C., et al. 2002, American Physical Society, April Meeting, Albuquerque, New Mexico, abstract #N17.069, 17069
- Woo et al. (1995) Woo, J. W., Clark, G. W., Blondin, J. M., Kallman, T. R., & Nagase, F. 1995, ApJ, 445, 896
- Woo et al. (1996) Woo, J. W., Clark, G. W., Levine, A. M., Corbet, R. H. D., & Nagase, F. 1996, ApJ, 467, 811
- Yokogawa et al. (2000) Yokogawa, J., Imanishi, K., Tsujimoto, M., et al. 2000, ApJS, 128, 491
- Yokogawa & Koyama (1998) Yokogawa, J. & Koyama, K. 1998, IAU Circ., 6853, 2
- Yokogawa et al. (2001) Yokogawa, J., Torii, K., Kohmura, T., & Koyama, K. 2001, PASJ, 53, 227
- Zebrun et al. (2001) Zebrun, K., Soszynski, I., Wozniak, P. R., et al. 2001, Acta Astronomica, 51, 317