An XMM-Newton view of the extended “filament” near the cluster of galaxies Abell 85
We have observed with XMM-Newton the extended 4 Mpc filament detected by the ROSAT PSPC in the neighbourhood of the cluster of galaxies Abell 85. We confirm that there is an extended feature, aligned at the same position angle as the major axis of the central cD, the bright cluster galaxies, and nearby groups and clusters. We find that the X-ray emission from the filament is best described by thermal emission with a temperature of keV, which is significantly lower than the ambient cluster medium, but is significantly higher than anticipated for a gas in a weakly bound extended filament. It is not clear whether this is a filament of diffuse emission, a chain of several groups of galaxies, or stripped gas from the infalling south blob.
1 Introduction
The complex of clusters Abell 85/87/89 is a well studied structure, whose dominant component is Abell 85 at a redshift of (Durret et al. 1998a).111At , 1 arcmin kpc, assuming , . Abell 89 comprises two background structures and will not be discussed further (see Durret et al. (1998b) for details).
In a combined X-ray (ROSAT PSPC) and optical (imaging and large redshift catalogue) analysis (Durret et al. 1998b), we have shown the existence of an elongated X-ray structure to the southeast of the main cluster Abell 85. This filament is at least 4 Mpc long (projected extent on the sky), and it is not yet clear whether this is a filament of diffuse emission or a chain made by several groups of galaxies.
The search for filaments or strings of groups lying along filaments visible in X-rays is obviously an exciting topic, since such structures could trace the filaments of dark matter along which large scale structures form, as commonly seen in N-body simulations of structure formation in cold dark matter (CDM) cosmological models (e.g. Frenk, White & Davis 1983; Jenkins et al. 1998). Large scale filaments are also observed in the distribution of galaxies in redshift surveys (e.g. Schmalzing & Diaferio 2000) and between clusters (West, Jones & Forman 1995). A large fraction of the baryons in the Universe are predicted to be in diffuse form in the network of filaments traced by the CDM. Although the detection of X-ray emitting gas in filaments has not always been successful (Briel & Henry 1995; Pierre et al. 2000), a few X-ray filamentary structures have been detected in Coma (Vikhlinin, Forman & Jones 1997), Abell 2125 (Wang, Connolly & Brunner 1997), and between Abell 3391 and Abell 3395 (Tittley & Henriksen 2001).
Based on ROSAT data, Durret et al. (1998b) showed that after subtracting the modelled contribution of Abell 85 the remaining emission has the appearance of being made of several groups, each of these small structures having an X-ray luminosity of about erg s-1, typical of small groups of galaxies. In order to analyse better the morphology and physical properties of the X-ray gas in the filament, we have reobserved Abell 85 with XMM-Newton, and present our first results below. With the greater sensitivity of XMM-Newton, we are able to estimate the temperature and metal abundance of the X-ray emitting gas in the inner part of the filament; however, we are still unable to decide whether the gas is diffuse or concentrated in group like structures. Note that Kempner et al. (2002) discuss the Chandra observation of Abell 85 with emphasis on the X-ray concentration at the northernmost end of the filamentary structure, but the filament itself lies outside their field.
2 Observations and data reduction
Two XMM-Newton (Jansen et al. 2001) observations were performed on January 7th, 2002. The first exposure was pointed between the centre of Abell 85 (coincident with the cD galaxy) and the southern substructure (the “South Blob”); the second observation was aimed at the southern filament. Both total exposure times were 12.5 ks using the medium optical filter in standard Full Frame mode. The basic data processing (the “pipeline” removal of bad pixels, electronic noise and correction for charge transfer losses) was done with SAS V5.3.
For the spectral analysis, we have used the southern filament observation made with both EPIC/MOS cameras. After applying the standard filtering, keeping only events with FLAG=0 and PATTERN 12, we have removed the observation times with flares using the light-curve of the [10–12 keV] band. The cleaned MOS1 and MOS2 event files have remaining exposure times of 12.36 ks and 12.40 ks, respectively.
The redistribution and ancillary files (RMF and ARF) were created with the SAS tasks rmfgen and arfgen for each camera, taking into account the extended nature of the filament.
The smoothed, merged image of the four cleaned MOS observations in the 0.3–5.0 keV energy band is shown in Fig. 1. To generate the image, we subtracted background from each data set (taken from Lumb et al. 2002), generated exposure maps, smoothed the background subtracted data and the exposure maps, and finally corrected for the exposure. Besides the well known main cluster and South Blob, emission can clearly be seen extending southeast of the South Blob. This confirms our detection of the “filament” with the ROSAT PSPC. Note from Fig. 1 that Abell 87 is not detected in X-rays by XMM-Newton, as it was already not detected by the ROSAT PSPC (Durret et al. 1998b) or by the ROSAT All Sky Survey (which did detect the south blob). This strongly suggests that this is not really a cluster but perhaps a concentration of several groups, in agreement with Katgert et al. (1996) who find two different redshifts in that direction, one coinciding with that of Abell 85 and the other at z=0.077.
In order to analyse the structure of the filament in more detail, we constructed a model of the overall cluster X-ray emission from an azimuthally averaged profile and subtracted it from the merged image, as previously done with the ROSAT data. The result is displayed in Fig. 2. The brightest structure coincides with the South Blob and the filament is clearly seen to be patchy, as already observed with ROSAT (see Fig. 2 in Durret et al. (1998b)). The positions of the various patches of X-ray emission do not exactly coincide with those previously detected with ROSAT, but the overall structure is comparable.
3 Physical properties of the filament
In order to analyse in more detail the physical properties of the filament and derive its temperature and metallicity, we extracted events inside an elongated region E1 of elliptical shape centered at R.A. and Decl. (J2000), with major and minor axes of 8 and 4 arcmin, respectively; three circular regions corresponding to point sources were excluded (see Fig. 2). We also extracted events in a second elliptical region (E2) having the same size as E1, with its major axis parallel to that of E1 and displaced towards the east. E2 is taken to be representative of the diffuse cluster emission.
The background was taken into account by extracting spectra (for MOS1 and MOS2) from the EPIC blank sky templates described by Lumb et al. (2002). We have applied the same filtering procedure to the background event files and extracted the spectra in the same region E1 and E2 in detector coordinates. Finally, the spectra have been rebinned with the grppha task, so that there are at least 30 counts per energy bin.
| Region | counts/s | counts |
|---|---|---|
| E1 All MOS1 | 1354 | |
| E1 All MOS2 | 1115 | |
| E1 North MOS1 | 878 | |
| E1 North MOS2 | 810 | |
| E1 South MOS1 | 476 | |
| E1 South MOS2 | 305 | |
| E2 MOS1 | 123 | |
| E2 MOS2 | 87 |
The count rates after background subtraction in all the regions analyzed are given in Table 1. Since the brightest portion of the filament is at the northern edge of the elliptical extraction region, the difference in the MOS1 and MOS2 count rates in region E1 could arise from small uncertainties in the vignetting corrections at the edge of the FOV of the XMM image centered on the filament.
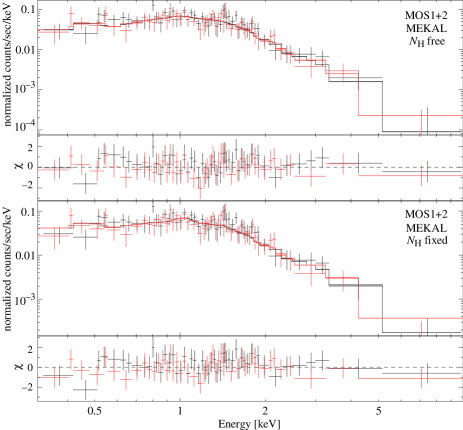
The spectral fits were done with XSPEC 11.2, with data in the range [0.3–10 keV], simultaneously with MOS1 and MOS2. A MEKAL model (Kaastra & Mewe 1993; Liedahl et al. 1995) with photoelectric absorption given by Balucinska-Church & McCammon (1992) was used to fit the spectral data. Since the spectra were rebinned, we have used standard minimization. Fig. 3 shows the MOS1 and MOS2 spectra, together with the best MEKAL fits and residuals.
| Region | dof | |||
|---|---|---|---|---|
| [keV] | [solar] | [cm-2] | ||
| E1 | 194/192 | |||
| 3.16 (fixed) | 200/193 | |||
| E1 North | 79/112 | |||
| 3.16 (fixed) | 81/113 | |||
| E1 South | 102/96 | |||
| 3.16 (fixed) | 107/97 |
Table 2 summarizes the spectral fits for the filament. If is left free to vary in the fit, it is not well constrained, since its 90% confidence interval is cm-2, and the corresponding X-ray temperature is in the range keV. For the metallicity, we only have an upper limit , which is almost the same as the mean metallicity obtained in the fit with fixed . The galactic neutral hydrogen column density in the direction of the filament is cm-2 (Dickey & Lockman 1990). When is fixed to this value, a MEKAL fit to the filament spectrum gives a gas temperature of keV and a metallicity of (90% confidence range). Due to the small number of counts in region E2, it was not possible to derive useful constraints on the spectral parameters.
Fluxes and luminosities were calculated with the best MEKAL fit and are shown in Table 3.
| Region | Band | (free ) | (fixed ) | ||
|---|---|---|---|---|---|
| [keV] | Flux | Lumin. | Flux | Lumin. | |
| E1 | 2.0–10. | 3.0 | 4.5 | 3.5 | 5.2 |
| 0.5–4.5 | 8.4 | 11.9 | 7.7 | 10.8 | |
| E1 North | 2.0–10. | 2.5 | 3.7 | 2.8 | 4.1 |
| 0.5–4.5 | 6.4 | 9.0 | 6.1 | 8.5 | |
| E1 South | 2.0–10. | 0.8 | 1.1 | 1.0 | 1.5 |
| 0.5–4.5 | 2.6 | 3.7 | 2.1 | 3.0 | |
Note: Flux units are erg cm-2 s-1.
Luminosity units are: erg s-1
We also attempted to fit a power-law to the spectra. Results are shown in Table 4. The resulting photon index is in the interval 2.5–3.0 and 1.8–2.0 when is left free to vary or is fixed, respectively.
| spectral index | [cm-2] | dof |
|---|---|---|
| 201.0/193 | ||
| 3.16 (fixed) | 242.7/194 |
The MEKAL and power law fits are of comparable statistical quality when is left free to vary; however, when is fixed, the MEKAL fit is significantly better (compare the bottom rows of Tables 2 and 4). Since the fitted value of for the power law is unreasonably large and the value of unacceptable when is fixed at the Galactic value, we reject the power law as a possible spectral model and favour thermal emission.
The computed fluxes and luminosities are actually from the filament plus the cluster ICM at that position. The cluster count rate in region E2 (after background subtraction) is given in Table 1. The cluster contribution to the fluxes and luminosities presented in Table 3 for the filament (E1) is therefore about %.
Visual inspection of the filament (Fig. 2) reveals a North South gradient. We defined two halves of the filament region (E1 north and south) and analysed them in the same way as the whole E1 ellipse (as depicted in Fig. 2). The number counts in these two regions are given in Table 1; they can be compared to the total number of counts in the north and south halves of E2: 62 and 44 respectively. The MEKAL fitting results are summarized in Table 2 and the fluxes and luminosities are given in Table 3. Within error bars, there is no gradient of temperature or metal abundance.
4 Discussion and conclusions
Our XMM-Newton observations confirm that there really is a highly elongated filamentary like structure extending from the South clump to the south east of Abell 85 along the direction defined by all the structures pointed out by Durret et al. (1998b). The fact that the spatial structure of the X-ray filament detected by XMM-Newton cannot be exactly superimposed to that obtained from ROSAT data shows that it is still difficult to determine exactly its structure.
However, we have shown that the X-ray spectrum from this structure is most likely thermal and its temperature is about 2.0 keV, consistent with that of groups. This value is notably cooler than that of the main cluster: the temperature map by Markevitch et al. (1998) shows the presence of gas at about 3–4 keV in the region at a distance from the cluster center at least as far as the northern part of the ellipse. So, we appear to be seeing cool gas as it enters the cluster core.
Another possibility is that the filament is associated with the wake of cool stripped gas left behind by the south blob as it falls onto the cluster. In this case, the “filament”, whether it is diffuse or made of groups, would not really be a filament in the large scale structure formation sense. Besides X-ray observations with a much better signal to noise ratio, which probably will have to wait for the next generation of X-ray satellites, optical data can shed light on this question. With this purpose, we intend to perform wide field imaging in various bands to estimate galaxy photometric redshifts and determine how galaxies are distributed in the “filament” area.
Acknowledgements.
We acknowledge a demonstration of the XMM-Newton SAS software by Sébastien Majerowicz and help from Sergio Dos Santos to install SAS at the IAP and perform a preliminary data reduction. F.D. and G.B.L.N. acknowledge financial support from the USP/COFECUB. G.B.L.N. acknowledges support from FAPESP and CNPq. W. Forman thanks the Max-Planck-Institute für Astrophysik for its hospitality during the summer of 2002 and acknowledges support from NASA Grant NAG5-10044. This work is based on observations obtained with XMM-Newton, an ESA science mission with instruments and contributions directly funded by ESA Member States and the USA (NASA). May the referee be thanked for helping us improve the manuscript.References
- Balucinska-Church & McCammon (1992) Balucinska-Church M. & McCammon D. 1992, ApJ 400, 699
- Briel & Henry (1995) Briel U. & Henry P. 1995, A&A 302, L9
- Dickey & Lockman (1990) Dickey J.M. & Lockman F.J. 1990, Ann. Rev. Ast. Astr. 28, 215
- Durret et al. (1998a) Durret F., Felenbok P., Lobo C. & Slezak E. 1998a, A&A Suppl. 129, 281
- Durret et al. (1998b) Durret F., Forman W., Gerbal D., Jones C. & Vikhlinin A. 1998b, A&A 335, 41
- Frenk, White & Davis (1983) Frenk C.S., White S.D.M. & Davis M. 1983, ApJ 271, 417
- Jansen et al. (2001) Jansen F., Lumb D., Altieri B. et al. 2001, A&A 365, L1
- Jenkins et al. (1998) Jenkins A., Frenk C.S., Pearce F.R. et al. 1998, ApJ 499, 20
- Kaastra & Mewe (1993) Kaastra J.S. & Mewe R. 1993, A&AS 97, 443
- Katgert et al. (1996) Katgert P., Mazure A., Perea J. et al. 1996, A&A 310, 8
- Kempner, Sarazin & Ricker (2002) Kempner J.C., Sarazin C.L. & Ricker P.M. 2002, ApJ 579, 236
- Liedahl et al. (1995) Liedahl D.A., Osterheld A.L. & Goldstein W.H. 1995, ApJ 438, L115
- Lumb et al. (2002) Lumb D.H., Warwick R.S., Page M. & De Luca A. 2002, A&A 389, 93
- Markevitch et al. (1998) Markevitch M., Forman W.R., Sarazin C.L., Vikhlinin A. 1998 ApJ, 503, 77
- Pierre et al. (2000) Pierre M., Bryan G. & Gastaud R. 2000, A&A 356, 403
- Tittley & Henriksen (2001) Tittley E.R. & Henriksen M. 2001, ApJ 563, 673
- Schmalzing & Diaferio (2000) Schmalzing J. & Diaferio A. 2000, MNRAS 312, 638
- Vikhlinin, Forman & Jones (1997) Vikhlinin A., Forman W. & Jones C. 1997, ApJL 474, L7
- Wang, Connolly & Brunner (1997) Wang Q.D., Connolly A. & Brunner R. 1997, ApJ 487, L13
- West, Jones & Forman (1995) West M.J., Jones C. & Forman W. 1995, ApJL 451, L5