Conceptual Design of a Cosmic Ray Detector Operating Between and eV for the Study of the Galactic Center
Abstract
For our understanding of the origin of ultra high energy cosmic rays, the energy region between and eV is of crucial importance. Previous experiments have found indirect evidence that at these energies, the origin of cosmic rays changes from predominantly Galactic to extragalactic. In addition, weak evidence for an excess of cosmic rays from the direction of the Galactic center in a narrow energy band around eV has been claimed.
However, so far there is no direct evidence supporting this scenario. Neither Galactic nor extragalactic sources have been unambiguously established. Given the importance of this energy range, there is a strong case for a dedicated experiment to study the EeV energy region with high precision.
We present the conceptual design of GRaNDScan, a mobile stereo air fluorescence detector optimized to study the energy spectrum, composition, and arrival direction of cosmic rays in this important energy range. If located at a site on the southern hemisphere with good exposure to the Galactic center, this type of experiment will provide an accurate map of the Galactic center region, long suspected to harbor one or several sources of ultra high energy cosmic rays.
——————————————————
1tadams@hep.fsu.edu
2ecloh@umdgrb.umd.edu
3sybenzvi@nevis.columbia.edu
4westerhoff@nevis.columbia.edu
1 Introduction
The goal of GRaNDScan111Gamma Ray and Neutron Decay Scan of the Galaxy is to study the energy spectrum, chemical composition, and arrival direction of cosmic rays in the energy range from to eV with high sensitivity from a site with visibility of the Galactic center region.
The case for this study is strong in several respects. By concentrating on this energy range, GRaNDScan will provide data of unprecedented quality in a region where
-
•
the cosmic ray energy spectrum shows features, the ‘ankle’ and (less prominent) the ‘second knee,’
-
•
the chemical composition undergoes an important change from a heavier to a lighter mixture,
-
•
a cosmic ray flux enhancement from the region around the Galactic center has been claimed.
Most of these features have not been studied with a dedicated instrument, and consequently their statistical significance is unsatisfying at this point. With the wealth of information that this energy range offers, this study will provide crucial information on the origin of ultra high energy cosmic rays and the acceleration mechanisms at work.
In our current understanding, the changes in composition and energy spectrum are indicative of a transition in the nature of the cosmic ray origin itself. Whereas cosmic rays below eV are mostly Galactic in origin, a new extragalactic component becomes dominant at higher energies.
Unfortunately, there is no direct evidence that supports this general picture – neither Galactic sources at energies below the ankle nor extragalactic sources at higher energies have been unambiguously detected. The most likely acceleration site in our own Galaxy is the region around the Galactic center, which stands out as its most energetic region. Radio, far infrared and -ray data indicate that the star formation and supernova activity of our Galaxy peaks in the center. This general picture is confirmed by studies of other disk galaxies. Correlations of data at radio and infrared wavelengths suggest that the cosmic ray production is generally higher in galactic center regions, just as the star formation rate is higher.
We therefore propose to operate GRaNDScan from a site on the southern hemisphere, with good visibility of the center region. This location will enable us to combine the general study of the composition and the energy spectrum with a detailed analysis and mapping of the Galactic center region,
Earlier results from AGASA [1], SUGAR [2], and Fly’s Eye [3] indicate that the Galactic center region may indeed harbor one or several sources of cosmic rays at eV. However, the statistical significance of the results is poor, mainly because these experiments were not optimized for the study of the Galactic center region in this energy range. An important goal of GRaNDScan is to clarify this unsatisfying situation and establish or disprove claims of an enhanced flux from the Galactic center with high significance.
The AGASA and SUGAR results naturally raise the question of the chemical nature of the cosmic ray flux from sources inside our Galaxy. While protons cannot reach us without deflection, it is well known that neutrons with energy 1 EeV can traverse the Galactic field undisturbed and reach us un-decayed from the Galactic center, a mere 8 kpc from the solar system. With higher energies, neutrons could reach us from anywhere in our Galaxy. In short, a properly designed detector could use neutrons as a tool for performing tomographic searches for sources of cosmic rays in our Galaxy.
The basic requirements for a multi-purpose detector like GRaNDScan are therefore excellent energy resolution, good angular resolution, and the ability to discriminate between different primaries, mainly ’s, hadrons, and heavier nuclei like iron. All composition studies rely heavily on the quality of our understanding of the first interaction of cosmic ray primaries in the atmosphere and the development of the shower cascade. However, this dependence can be minimized with a detector that directly observes the development of the shower cascade. The air fluorescence technique meets all these requirements, and GRaNDScan is designed as an air fluorescence detector in the tradition of the Fly’s Eye and the HiRes experiment.
Taking the SUGAR detector as a baseline detector, GRaNDScan is designed with a factor of ten better angular resolution, a factor of ten improved energy resolution, more than a factor of ten larger aperture with shower profile measuring capability, a capability that SUGAR did not have. The profile measuring capability would enable the GRaNDScan detector to identify neutrons from a source by examining the mass composition of cosmic ray from the source and the mass composition of off-source cosmic rays. Similarly, -rays can also be identified by similar profile comparisons. The improved energy resolution would also allow one to compare on-source and off-source cosmic spectrum and thus to understand how cosmic rays are accelerated.
It should be noted that except for the Pierre Auger Array [4], there are no high energy cosmic ray detectors in the southern hemisphere. The main focus of the Auger Array is the study of cosmic rays above eV, and the layout of the Auger air fluorescence detectors is not optimized for studying cosmic rays far below this threshold. Using events that trigger a single fluorescence eye and one or more ground detectors, Auger can extend the sensitive range down to eV [5], but not far below that, and without the advantages of the stereo fluorescence technique.
2 Experimental Results
2.1 Energy Spectrum and Composition
There are two prominent breaks in the cosmic ray energy spectrum, a steepening around eV (the ‘knee’) and a flattening around eV (the ‘ankle’). The latter can be seen in Fig. 1, a summary plot of the current experimental status of cosmic ray energy spectrum measurements above eV [6]. The knee and the ankle are correlated with changes in the average chemical composition of the cosmic ray flux. The KASCADE [7] experiment has shown that the composition is mainly heavy (iron) at energies above the cosmic ray “knee” at eV. Around the ankle, data from the Fly’s Eye and HiRes-MIA hybrid experiment indicate a change to a proton-dominated composition.
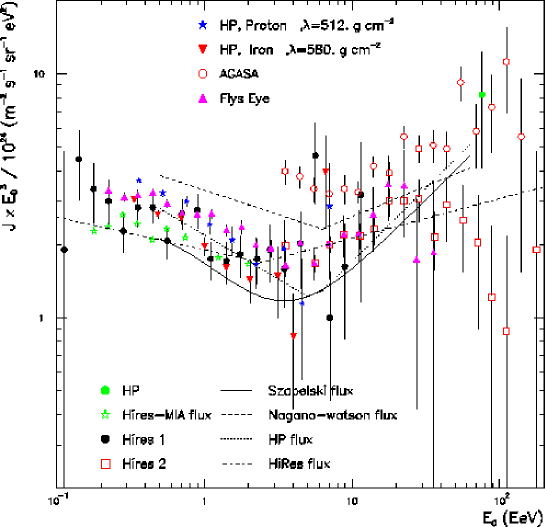
Both Fly’s Eye and its successor HiRes (High Resolution Fly’s Eye) are air fluorescence detectors, operated in the clean atmosphere of the Utah desert. Air fluorescence detectors observe the longitudinal shower profile and deduce the chemical composition using the fact that showers induced by lighter particles penetrate more deeply into the atmosphere. Due to large intrinsic fluctuations in the shower development, the determination of the particle type is not possible on an event-by-event basis, but the rate of change of the average shower maximum per logarithmic decade, the ‘elongation rate,’ is a good indicator of the chemical composition. Results from Fly’s Eye [8] and the HiRes-MIA hybrid detector [9, 12] suggest that near the ankle, the average mass composition changes from iron-dominated to proton-dominated, and stays consistently proton-dominated at higher energies.
Both results lend credibility to a scenario that attributes the dominant cosmic ray flux below and above the ankle to two different source populations. Galactic sources, dominating the flux at lower energies, run out of steam around the ankle, and extragalactic contributions become dominant.
The exact location of the end of the Galactic component and therefore the maximum energy Galactic sources can achieve might be slightly below the ankle. There is marginal evidence in the Haverah Park [10], Fly’s Eye [11], AKENO and HiRes/MIA [12] spectrum for a second steepening of the spectrum near eV. Various models claim that this ‘second knee’ caused by the disappearance of the Galactic component - the heavy elements that dominate the all-particle spectrum above the (first) knee finally reach the highest possible energy and subsequently drop out, causing the spectrum to steepen [16, 17, 18]. This means that the location of the second knee provides important information on Galactic acceleration mechanisms.
2.2 Excess From the Galactic Center
There is marginal evidence for a cosmic ray source in the vicinity of the Galactic center. To date, data from three different experiments have been used to search for this anisotropy: AGASA, Fly’s Eye, and SUGAR. A summary of the global coordinates and detector characteristics is given in Table 1.
In J2000 equatorial coordinates, the Galactic center is located at right ascension and declination . AGASA and Fly’s Eye, both located on the northern hemisphere, observe the Galactic Center near the edge of their acceptance. SUGAR is so far the only instrument to observe it from a location in the southern hemisphere. All three experiments were sensitive to very high energy cosmic rays ( eV), but used different detection methods.
The AGASA experiment used a ground based shower array located at the Akeno Observatory in Japan operated since 1984. A harmonic analysis was performed on a sample of 114,000 events passing their selection criteria [1]. The first harmonic revealed an excess in the region near eV with an amplitude of . Analysis of the energy dependence shows the most significant excess falls in the range eV.
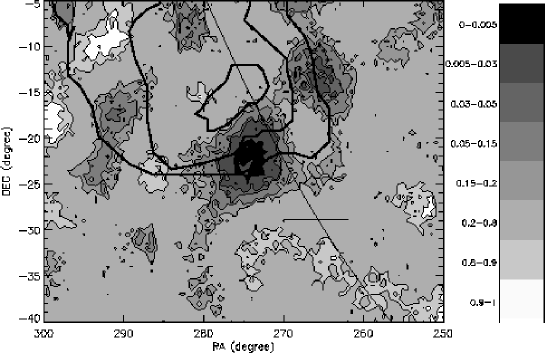
A sky map of the AGASA data shows a excess in the direction of the Galactic center, a excess in the Cygnus region and a deficit in the direction of the anti-Galactic center. The Galactic center is outside of the visibility of the AGASA detector and the excess lies in the Galactic plane at the edge of acceptance. Fig. 2 shows the AGASA map near the Galactic center.
| Experiment | Latitude | Longitude | Detector Type | Running Time |
|---|---|---|---|---|
| AGASA | N | E | ground based array | 1990 - present |
| Fly’s Eye | N | W | air fluorescence | 1981 - 1993 |
| SUGAR | S | E | ground muon array | 1968 - 1979 |
The Fly’s Eye anisotropy analysis [3] showed an enhancement in the Galactic plane which had a probability of 0.006 for resulting from a fluctuation. The enhancement was most significant in the energy range eV. A latitude gradient was searched for, but was not found to be statistically significant ().
The Sydney University Giant Air Shower Recorder (SUGAR) studied very high energy cosmic rays during the period 1968-1979. Located in New South Wales, Australia, the experiment measured shower muons GeV using a ground array [13] with 47 liquid scintillation counters buried 1.5 m deep under ground on a grid with 1.6 km spacing. A denser inner sub-array of size with 500 m grid spacing was sensitive to lower energy showers.
A re-analysis of the SUGAR data by Bellido et al. [2] determined a priori the energy range and binning based on the AGASA analysis to avoid the trial penalty which makes the interpretation of the AGASA results so difficult. The analysis found an excess of background probability 0.005 at , which is close to but significantly different from the location of the Galactic center and does not coincide with the position of the AGASA excess. Fig. 2 compares the excess in the Galactic center region as seen by AGASA and SUGAR. The positions differ by , and while the AGASA excess shows significant smearing, the SUGAR excess appears as a point source within the array’s resolution.
The statistically rigorous way the SUGAR analysis was performed allows a first estimate of the flux from the unknown source, which was found to be in the energy interval between . It should be noted that due to the small aperture of the instrument at these low energies, the accumulated excess amounts to only 10 events in 11 years of running time.
In summary, results from the northern hemisphere detectors, Fly’s Eye and AGASA, seem to indicate a broad cosmic ray enhancement near the Galactic center, while SUGAR reports an enhancement consistent with a point source. With the known Galactic magnetic fields, it is reasonable to conclude that the results from the three experiments are consistent with each other. If a source existed near the Galactic center, the two detectors in the northern hemisphere, with very limited exposure to the Galactic center, would detect mostly particles bent by the magnetic fields. The SUGAR detector, on the other hand, with a full view of the Galactic center, would be able to detect cosmic rays from the source. Albeit statistically not strong, the experimental results are consistent with each other, and they constitute strong and compelling reasons for pursuing the source study proposed in this paper.
3 Theoretical Issues
3.1 Cosmic Particle Sources and Acceleration
In our current understanding, cosmic ray particles are accelerated to ultra high energies by shock acceleration, a process initially proposed by Fermi [14]. If shock acceleration is indeed the dominant process, any potential source has to meet requirements summarized by Hillas [15]. The source must be able to (magnetically) confine the particles during the acceleration process, and the source environment must allow particles to eventually escape without substantial energy losses such as photopion production in region of high photon density. This limits the magnetic fields in the source vicinity, the source size, and the energy density of photons within the source. At eV, source parameters are at the edge of the allowed regions. Given all these requirements, conditions in known Galactic sources can not readily generate cosmic ray energies this high. Shock acceleration is at work in supernovae exploding into the interstellar medium, and in our current understanding, these supernovae are responsible for the cosmic ray flux below the knee at about eV.
If the energy spectrum continues above eV in violation of the Hillas limit, this might be an indication that our understanding of the acceleration process is wrong or incomplete, and other more efficient, but yet unknown processes, are at work.
A possible source for cosmic rays above eV has been proposed by Biermann [16, 19, 20]. The model suggests that these cosmic rays also originate from shock acceleration in supernovae, but their sources are supernovae which explode into their own strong stellar wind rather than into the interstellar medium. Wind supernovae are produced by massive stars with initial zero age main sequence masses above 20 solar masses. These stars explode near their birthplace, where the material from which they were formed is still around [21]. Wind supernovae have an energy of explosion near erg, and since the stellar wind has a density gradient, the shock speed stays high even at larger distances and energies up to eV for iron nuclei are possible.
This illustrates the impact of the study of cosmic particle origins at GRaNDScan energies. Understanding their origin may have consequences important for stellar evolution, supernova physics, and particle physics.
3.2 Galactic Magnetic Fields and Charged Particles
If the primary particles are protons or heavier nuclei, we also need to understand Galactic magnetic fields. Charged cosmic ray particles are subject to large deflections in ambient magnetic fields unless their Larmor radius is substantially larger than the distance between the source and the observer.
At present, the origin of Galactic magnetic fields is not well-understood. The strength of the field in the solar vicinity is about , with a regular and an irregular component both contributing about half the total (see the review and and summary in [22]). The regular component points along the spiral arms inward and is observed in all spiral galaxies which have been well-studied [23]. It seems consistent with what we know about our own Galaxy. The irregular component is turbulent and possibly a result of the superposition of supernova shells. It is non-uniform with a typical length scale of 100 pc. A eV proton in a field of strength has a Larmor radius of 300 pc, while the distance between the Galactic center and the solar system is about 8 kpc. Charged particles can therefore not get from the Galactic center to us on a straight line.
If we indeed see a charged component, then the AGASA excess might be explained by diffusion of cosmic rays from the Galactic center region past us. Clay et al. [24] have modeled the propagation of charged cosmic ray particles and shown that any gradient in the flux of cosmic rays leads to a weak anisotropy and creates an excess of events which is distributed as a halo around the source direction. The estimated halo diameter of is consistent with the AGASA results (although the results are weak and do not constitute much of a constraint). The anisotropy is expected to show a symmetry in opposite directions of the sky, and AGASA data in fact indicates a weak deficit in the direction of the Galactic anti-center.
As shown in [25], this diffusion model can also account for the relatively small energy region of the excess. At energies below eV, the propagation is diffuse and the expected anisotropy is small. With increasing energy (above eV for protons and eV for iron) the particles start to retain their directional information to some degree, and a directional excess with a broad halo around the source direction becomes visible. At even higher energies, the source itself may no longer be able to produce these energies, or, if it is, the flux from the source is overshadowed by other components, for example extragalactic sources. This would make a detection of the flux from the Galactic center statistically challenging with the limited amount of data currently available, and the conclusion is that any excess from the Galactic center is expected in a narrow energy range only.
The diffusion should result in a cosinusoidal dependence of the flux on angle from the Galactic center. Any future detector needs to be sensitive enough to measure the flux as a function of angular distance from the center to test this important prediction. The AGASA data, although skewed by the fact that the center itself is beyond the field of view and the center region is observed under a large zenith angle, also indicate that the excess might continue along the spiral arm, possibly funneled by the magnetic fields which are believed to follow the spiral arm structure.
In the diffusion model we would also expect deficits in the direction out of the Galactic plane, since the Larmor radius begins to exceed the thickness of the Galactic plane (300 pc) and particles can leak out. This leakage is currently not observed, which could mean that there are strong magnetic turbulences which extend well out of the Galactic plane into the halo and prevent the leakage. These halo fields have been observed in edge-on spiral galaxies observed by radio astronomers, but for only a small fraction () of edge-on galaxies [26].
3.3 Neutral Particles
Any model which assumes that charged particles are responsible for the observed enhancement predicts that the excess around eV should show substantial smearing, several tens of degrees in diameter. While the excess observed by AGASA does indeed show substantial smearing, the SUGAR array observes an excess which is compatible with a point source within the angular resolution of the array. This may be an indication that the excess flux stems at least in part from a neutral component, neutrons or -rays, which is not subject to deflection. However, the absence of any anisotropy below eV is hard to explain with -rays. In addition, SUGAR, with its buried counters, is sensitive only to the muonic component of air showers, which rules out -ray primaries if our current understanding of air shower development is correct. This leaves neutrons as a viable candidate.
Neutrons are produced by interactions between heavier nuclei and ambient photon fields in the source region, and by isospin flip in p-p-collisions. In a remarkable “coincidence,” neutrons of energies around eV have a -factor of and therefore a decay length which is close to the distance between us and the Galactic center. Since neutrons can propagate this distance without decay or deflection, they provide a natural explanation for the narrow energy range of the AGASA observations: below about eV, neutrons decay before reaching the Earth, and above eV, the acceleration mechanism runs out of steam.
The observed energies of eV cause a problem for both protons and neutrons. In particular, as Biermann et al. [27] point out, the black hole at the center of our Galaxy, a natural candidate for a cosmic ray source, does not have sufficient activity to produce neutrons near eV, and the same holds for mini-quasars in the Galactic center region.
4 Scientific Goals
The goal of GRaNDScan is a detailed study of the cosmic ray flux in the region from to eV. This includes
-
1.
a measurement of the energy spectrum and detailed study of spectral features like the ankle and the ‘second knee,’
-
2.
a measurement of the average chemical composition,
-
3.
a mapping of the Galactic center region, and a determination of the chemical composition and the energy spectrum in regions where an excess is found.
The study of the flux and the composition will bridge the energy gap between experiments like KASCADE [7], which studied the composition around the “knee” at eV, and HiRes and Auger, which cover the range from eV up to the GZK cutoff or beyond.
The mapping of the Galactic center region needs to establish where any excess originates, how many sources are responsible, and whether the source image shows smearing or appears to be point-like. If indeed particular acceleration sites can be identified, we need to measure their energy spectrum with high accuracy to learn about the acceleration mechanisms at work. In particular, the high energy end of the spectrum will provide valuable information on the conditions at the source (or sources).
The detector must be able to distinguish between -ray primaries, protons/neutrons, and heavier nuclei. While most cosmic ray models are based on the acceleration of charged particles, other particle types inevitably occur after these primaries interact with the interstellar medium and produce (again) charged particles, neutrons, and neutral pions which decay into photons. If SUGAR’s excess is caused by neutrons, then the flux of cosmic rays in the source region and thus nucleon interaction must be extremely high, and a strong flux of -rays from pion decay must inevitably accompany the hadron flux.
These protons, neutrons, and photons provide important orthogonal information on Galactic sources of cosmic rays, as all three particle types probe different distances within the Galaxy. From charged hadrons, we expect a direct component only from a very limited region of space. Only with neutrons near eV or with -rays can we study the Galactic center region directly. While -rays measure the line of sight integral through the entire disk and halo, neutrons decay after a decay length , so we measure the integral up to a distance .
The separation of heavier nuclei from protons and protons from -primaries is possible if the height of the shower maximum is known. While the intrinsically large fluctuations of the shower start and development make a separation on an event-by-event basis impossible, the average height of the shower maximum for an ensemble of showers is a strong indicator of the particle type. Neutron- and proton-initiated air showers have identical signatures and can not be separated, but here, the shape of the excess will provide important information. Since charged particles can not reach us directly, any gradient in the charged particle flux from the Galactic center region will cause a symmetric anisotropy with an excess from the direction of the center and a deficit from the anti-center.
The most accurate technique today to determine the energy, the interaction characteristics, and the arrival direction of cosmic ray primary particles at ultra high energies around eV is the stereo air fluorescence technique. This technique uses the Earth’s atmosphere as a large aperture calorimeter, where primary cosmic ray particles interact with air molecules to produce huge cascades of particles, so-called extensive air showers. The particles of the shower cascade excite and ionize air molecules which fluoresce in the UV. The fluorescence light can be detected by photomultiplier cameras watching the dark night sky, and a three-dimensional picture of the shower development in the atmosphere can be reconstructed from the measured trigger times and light intensitites observed by each tube along the shower trajectory. If the shower is observed by two detectors simultaneously, the three-dimensional geometrical reconstruction of the shower axis is more precise, and systematic uncertainties due to incomplete knowledge of atmospheric parameters are largely removed.
The air fluorescence technique was pioneered by the Fly’s Eye collaboration, which operated a monocular detector from 1981 to 1986 and a stereo detector from 1986 to 1993. The HiRes experiment is currently operating as a second-generation air fluorescence detector at the same site, on the Dugway Proving Grounds in Utah.
The air fluorescence technique requires clear dark nights and good and stable atmospheric conditions. The technique is therefore limited to dry desert areas in remote locations with minimum light pollution. These requirements severely reduce the duty cycle, to less than . In addition, constant monitoring of the atmosphere is necessary to correctly determine the aperture of the detector at any given time.
These shortcomings are outweighed by decisive advantages over ground arrays. A stereo air fluorescence detector can achieve angular resolution better than , energy resolution of , and can directly determine the position of the shower maximum to , an important requirement to determine the interaction characteristics and thus the type of the primary particle.
The design of GRaNDScan is therefore based on the stereo air fluorescence technique as the most appropriate technique to achieve the scientific goals outlined in this section.
5 GRaNDScan Design
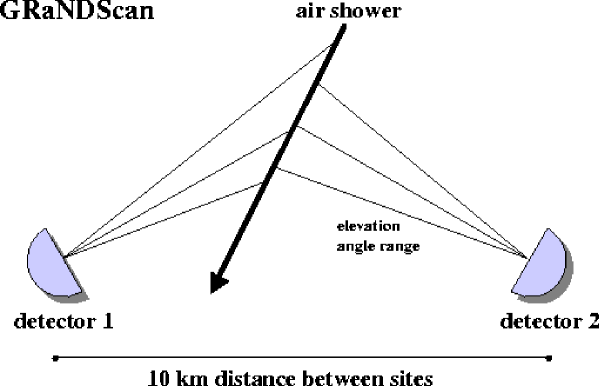
The design for GRaNDScan has been driven by the attempt to achieve a maximum aperture for stereoscopic observation of air showers while keeping the number of telescopes small. In the baseline design, GRaNDScan is an air fluorescence detector with two sites about 12 km apart which are facing each other and therefore view a common volume of atmosphere.
A schematic of the detector is shown in Fig. 3. Each site consists of several reflecting telescopes with a diameter mirror for light collection and a photomultiplier camera in its focal plane. Each telescope covers a field of view of by . The large field of view has been chosen to keep the number of detector units small. With 3 mirrors at each site, a range of in azimuth and in zenith angle can be covered. The axis of the mirror has an angle to the horizontal of . The number of camera units, the pointing direction in zenith angle and the distance between the sites are chosen to maximize the aperture of the detector in the relevant energy region around eV (see Section 5.2). Covering a larger range in azimuth and zenith increases the aperture, but at eV, detected showers are mainly “local,” i.e. close to both detector sites. Most of the sensitivity can be achieved with fewer units if we only consider the atmospheric volume in between the sites.
The configuration allows stereo observation of air showers and provides the angular resolution associated with this technique. The need for a good angular resolution is evident in the case of extended sources, where the exact structure of the source needs to be studied. However, a good angular resolution is also crucial for sensitivity to point sources.
The figure of merit for a telescope which is aimed at the detection of a point-like source over a dominating isotropic background is the signal to noise ratio
| (1) |
where is the exposure time, is the effective detector area, and is the angular resolution. The signal/noise relative trigger efficiency and the signal/noise identification efficiency are close to 1 in our case since background and noise presumably have similar chemical composition and a separation of the signal from the noise is not possible. (However, can be considerably larger than 1 for an excess produced by -ray primaries over a hadronic background).
In the following sections, we address how to optimize the exposure time and the effective detector area or aperture of the detector.
5.1 Location
The experimental challenge for GRaNDScan is to overcome an infrastructure problem. Air fluorescence detectors require sites without light pollution and with excellent atmospheric conditions, which implies remote (desert) areas. The costs for installing power lines to remote locations is prohibitive. However, with recent developments in low power electronics and large analog memories it is for the first time feasible to design and develop an air fluorescence camera that operates on solar power alone. This means that only a minimal amount of infrastructure is required and operating costs are kept at a minimum. The minimal infrastructure also allows the detectors to be easily moved or reconfigured.

Air fluorescence detectors have limited duty cycles since observation time is restricted to dark, moonless nights. The duty cycle of an instrument which aims at the detection of a specific source is even smaller, as the source can not be observed during the period of the year when it crosses the sky during daytime.
Neglecting downtime caused by bad weather, the observation time is determined by the geographical latitude of the detector location. The Galactic center is at declination . A good visibility of this region therefore requires a detector location in the southern hemisphere. Fig. 4 shows the duty cycle as a function of the detector latitude integrated over a full year of observation. The duty cycle is defined as the observation time divided by the total time (1 year), where observation time is defined as those time periods between moon set (or rise) and astronomical twilight where the Galactic center has a zenith angle of less than (solid line) and (dotted line) in local coordinates. For a good visibility with small zenith angles, a southern latitude corresponding to the declination of the Galactic center optimizes the observation time. If we allow the Galactic center to go down to , more southern locations are equally well-suited, but it should be stressed that at latitudes further south than , the Sun starts to stay continuously above twilight limit for long periods of the year, and further south, it will also stay continuously below twilight limit. In our case, this is not an advantage, as we need sunlight periods to recharge batteries. An ideal site is therefore at moderate southern latitudes approximately equal to the declination of the Galactic center where days are sufficiently long to allow daily recharging. Duty cycles of () can be expected for (), but this number is an upper limit, as it does not account for weather conditions. For comparison, a ground detector array at a latitude of has a duty cycle for Galactic center observations of ().
For measurements of the energy spectrum and the average chemical composition, which do not require the Galactic center to be in field of view, the duty cycle is more favorable and reaches .
5.2 Layout of the Sites
The distance of the two detector sites and the field of view in local coordinates will determine the aperture of the detector. The optimal distance varies with shower energies. The atmospheric volume observed should be as large as possible, but if the distance between the sites is too large, only a small fraction of events are seen by both detectors.
Another parameter which determines the aperture is the zenith angle range covered by the detector. To keep the number of mirror units small, the camera should not cover the whole zenith angle range from to , but only that fraction of the full range which contributes most to the total aperture and is most likely to contain the shower maximum. A reliable energy and shower maximum reconstruction requires that at least one of the sites observes the shower maximum in its field of view.
This optimal zenith angle range depends on the energy of interest. High energy showers reach their maximum later, so the average height of the shower maximum decreases with energy. A detector working at energies below eV should therefore preferentially observe higher elevations, whereas at eV and above, a lower elevation range will maximize the aperture.
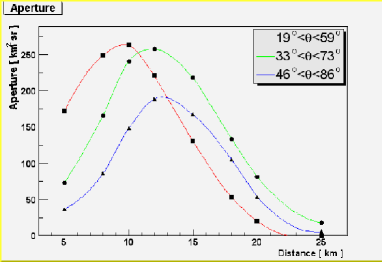
To find the site layout which maximizes the aperture of the stereo detector, we simulated the stereo aperture as a function of the distance between the sites and the zenith angle viewing range. To guarantee that the event can be reconstructed with good accuracy, an event is only accepted if each detector site has at least 5 signal tubes and the (reconstructed) shower maximum is in the field of view of at least one of the two sites.
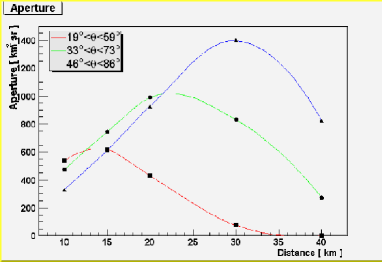
Fig. 5 shows the aperture as a function of the detector distance for two different energies ( eV and eV) and three zenith angle ranges. As expected, both the optimal distance between the two sites and the optimal zenith angle range strongly depend on energy. At higher energy, a larger distance and a field of view covering elevations closer to the horizon maximize the aperture.
The two energies illustrate a further advantage of a detector composed of movable units. Optimal detector parameters change rather dramatically with each decade in energy. It is conceivable that a mobile detector like GRaNDScan can be operated at different site distances over its life time. After an initial run at eV, the detector distance can be changed to increase the aperture at higher or lower energies.
5.3 Photomultiplier Camera and Electronics
A crucial element of GRaNDScan is the light detector used in the air fluorescence camera. At the lower end of the GRaNDScan energy range, the signal to noise ratio will limit the lowest signal that can be measured. This almost automatically leads to photomultiplier tubes as the best-suited camera element. Photomultipliers have typically high gain, single photon efficiency, low intrinsic noise, and do not require cooling, and important advantage if power consumption is to be kept at a minimum.
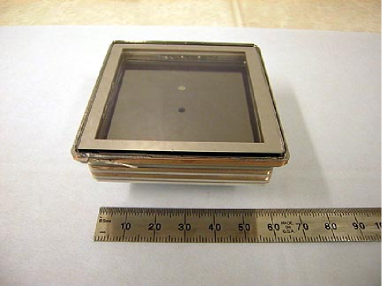
The GRaNDScan camera needs to be light in weight for instrumenting a remote detector. A wide field of view also requires a curved camera surface (see next section), which is difficult to achieve with conventional photomultipliers. Flat-panel multi-anode photomultipliers now overcome this limitation, and the anode pixellation of devices like the BURLE 85001 [28] can be chosen as to best match the application (see Fig. 6). 2 by 2 anode configurations in a phototube are readily available, which means each of these compact devices replaces four conventional photomultipliers. A camera using flat multi-anode photomultipliers will be considerably smaller and less heavy than a traditional air fluorescence camera.
Current off-the-shelf solar power units deliver about 50 W for 5 to 6 hours per paddle size. Therefore the limit on the power consumption per channel for an air fluorescence camera with a by field of view and just under 1000 photomultiplier channels running for 6 hours during a typical data taking night is 50 to 100 mW per channel for one or two paddles. This is roughly two orders of magnitude lower than the power consumption of a current HiRes camera. However, these are numbers referring to the average power consumption. Since a camera will ultimately consist of low power and high power elements, the goal is to keep the power consuming elements dormant most of the time and only activate them when an intelligent second-level trigger identifies a shower candidate. This trigger can be modeled after HiRes 2, the FADC based second site of the HiRes detector [29] in Utah, where a possible scheme has been successfully implemented. A Digital Signal Processor calculates the geometrical moments of the image formed by signal tubes on the photomultiplier camera and bases a trigger decision on the shape of this image. The event is accepted if certain criteria for a track-like image are met.
While the trigger decision is pending, the data goes through an analog delay line (switched capacitor array). For the expected signal from air showers at eV, a sampling rate of 10 MHz and a dynamic range of 12 bits are appropriate. Both sites function as independent units with their own solar power unit and central data acquisition combining the data from the camera units. A trigger is generated independently from the other site and the data is broadcast to a central station where the data sets are combined and matched. Fig. 7 (left) illustrates this scheme. The data can be stored on hardware RAID systems, and the main control of the experiment can be remote over the Internet, linked by a satellite.

5.4 Optical System
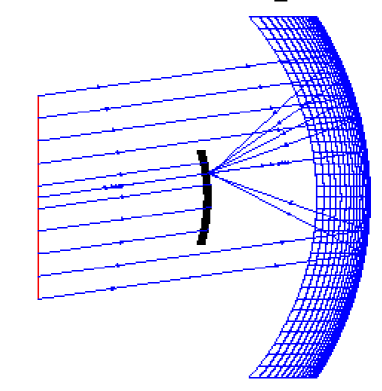
The need to image extremely weak light tracks over an extended field of view of order by suggests a Schmidt optical system. A Schmidt camera consists of a spherical mirror with a large aperture stop (e.g. ), located at its center of curvature. The mirror gives uniform images over a spherical surface concentric with itself, but the images suffer from spherical aberration, which in a classical optical Schmidt system are corrected with a refractive plate at the aperture.
| TABLE 2 — MCP Camera Parameters | |
|---|---|
| Aperture diameter | 1900.0 mm |
| Mirror radius of curvature | 3125.0 mm |
| Mirror size | 3400.0 mm |
| Camera radius of curvature | 1622.2 mm |
| Camera arc length | 883.9 mm |
| Anode pixelation | () 25.4 mm |
| Spot diameter | 25.4 mm |
| image size | 28.3 mm |
| Resolution | per pixel |
| Field of view | |
| Camera obscuration | 26.9% center, 24.4% corner |
The resolution of a photomultiplier camera is determined by the pixel size of the photomultiplier. Consequently, a reduction of the image spot to a dimension much smaller than the pixel is not necessary. Simulations using the ZEMAX [30] ray tracing code show that a Schmidt system without a corrector plate is therefore sufficient if the field of view is not much larger than by . For a given mirror radius of curvature radius , the diameter of the aperture stop largely determines the size of the circular image spot. In considering various geometries, we have been guided by the following requirements:
-
1.
a by field of view,
-
2.
per pixel resolution or better,
-
3.
the size of the image spot be roughly the pixel size,
-
4.
the camera obscures the mirror by not more than .
Calculations using ZEMAX show that an optical system meeting these requirements is feasible. Table 2 summarizes the dimensions of a microchannel plate PMT camera, Fig. 7 shows a wire frame schematic of the camera design. The aperture diameter is mm and the mirror size is mm. The image spot diameter of mm matches the pixel size of the BURLE 85001 tube with a anode pixellation. It should be noted that these optimization results are similar to the design of the air fluorescence cameras of the Auger detector [31, 32], although the final Auger design includes a partial corrector plate at the aperture stop.
For a larger field of view, for example by , a corrector plate becomes necessary. The Orbiting Wide-Angle Light Collectors (OWL) experiment for example proposes a Schmidt camera with corrector plate [33]. Ultimately, the cost of a corrector plate has to be weighted against the cost of additional camera units if the desired field of view has to be covered by a larger number of smaller telescopes.
5.5 Sensitivity to a Galactic Center Source
The only flux measurement so far is based on the excess seen in the SUGAR data. To estimate the sensitivity of GRaNDScan to a flux of this magnitude, we calculate the aperture required to observe the excess at a significance is one year of data taking. For this calculation, the SUGAR excess is treated as a signal coming from a point source. The angular resolution and the aperture of GRaNDScan have to compensate for the reduced duty cycle of an air fluorescence detector. If we estimate (conservatively) that the angular resolution will improve by a factor of 3 over SUGAR, then GRaNDScan needs an increase in aperture of a factor of 150 over SUGAR. Fig. 5 shows that this can easily be achieved with a detector of moderate size.
Acknowledgements
We want to thank Peter Biermann, Roger Clay, Bruce Dawson, and Cyrus Hoffman
for fruitful discussions and valuable comments on the manuscript. We also
benefited from discussions with Frank Jones and Minghuey A. Huang.
The development of a solar-powered air fluorescence camera is
supported by the National Science Foundation under grant number
NSF-PHY-0134007.
References
- [1] N. Hayashida et al., Astroparticle Phys. 10 (1999) 303.
- [2] J.A. Bellido, R.W. Clay, B.R. Dawson and M. Johnston-Hollitt, Astroparticle Phys. 15 (2001) 167.
- [3] D.J. Bird et al., Astrophys. J. 511 (1999) 739.
- [4] Auger Collaboration, The Pierre Auger Observatory Design Report, Second Edition (1997) (http://www.auger.org/admin/DesignReport/).
- [5] B. Dawson, P. Sommers, The Hybrid Aperture and Precision of the Auger Observatory, Proceedings of the International Cosmic Ray Conference, Hamburg, 2001.
- [6] L. Anchordoqui, T. Paul, S. Reucroft, and J. Swain, hep-ph/0206072.
- [7] K.-H. Kampert et al., The Physics of the Knee in the Cosmic Ray Spectrum, Proceedings of the International Cosmic Ray Conference, Hamburg, 2001.
- [8] T.K. Gaisser et al., Phys. Rev. D 47 (1993) 1919.
- [9] C. Song, PhD thesis, Columbia University (2001).
- [10] G. Cunningham et al., Astrophys. J. 236 (1980) L71.
- [11] D.J. Bird et al., Astrophys. J. 424 (1994) 491.
- [12] T. Abu-Zayyad et al., Phys. Rev. Lett. 84 (2000) 4276.
- [13] C.J. Bell et al., J. Phys. A 7 (1975) 990.
- [14] E. Fermi, Phys. Rev. 75 (1949) 1169.
- [15] A.M. Hillas, Ann. Rev. Astron. Astrophys. 22 (1984) 425.
- [16] P.L. Biermann, Astron. & Astroph. 271 (1993) 649; astro-ph/9301008.
- [17] P.L. Biermann, Supernova blast waves and pre-supernova winds: Their cosmic ray contribution, Invited Review Chapter in “Cosmic Winds and the Heliosphere,” Eds. J.R. Jokipii et al., Univ. of Arizona press, 1997, p. 887 - 957; astro-ph/9501030.
- [18] P.L. Biermann, S. Moiseenko, S. Ter-Antonyan, A. Vasile, Cosmic Rays from PeV to ZeV, Stellar Evolution, Supernova Physics and Gamma Ray Bursts, Invited Review at the Course of the Chalonge School on Astrofundamental Physics: “The Early Universe and The Cosmic Microwave Background: Theory and Observations”; astro-ph/0302201.
- [19] P.L. Biermann, J.P. Cassinelli, Astron. & Astroph. 277 (1993) 691; astro-ph/9305003.
- [20] P.L. Biermann, AGN and Galactic Sites of Cosmic Ray Origin, Invited Review Chapter in “High Energy Astrophysics”, Ed. J. M. Matthews, World Scientific, Singapore, 1994, p. 217; astro-ph/930505
- [21] P.L. Biermann, B.M. Tinsley, Publ. Astron. Soc. Pac. 86 (1974) 791.
- [22] R. Beck et al., Ann. Rev. Astron. Astrophys. 34 (1996) 155.
- [23] E. Krause, R. Beck, Astron. Astrophys. 335 (1998) 789.
- [24] R.W. Clay, B.R. Dawson, J. Bowen and M. Debes, Astroparticle Phys. 12 (2000) 249.
- [25] R.W. Clay, Pub. Astron. Soc. Aust. v18 (2001) 148.
- [26] E. Hummer et al., Astron. Astrophys. 197 (1988) L29; E. Hummel, R. Beck and R.J.Dettmar, Astron. Astrophys. Suppl.Ser. 87 (1991) 309.
- [27] W. Rhode, T.A. Ensslin, P.L. Biermann, astro-ph/9911361 (1999).
- [28] BURLE Product Reference, Version 3.1. BURLE Industries, Inc.: March 2002.
- [29] J. Boyer, B.C. Knapp, E.J. Mannel, and M. Seman, Nucl. Instr. Meth. A 482 (2002) 457.
- [30] ZEMAX Optical Design and Analysis Software, Focus Software, Inc., Tuscon, Arizona (2002).
- [31] M. Hrabovsky et al., The Optical Analysis of the Proposed Schmidt Camera Design. Auger Technical Memo GAP-99-025.
- [32] G. Matthiae, Optics and Mechanics of the Auger Fluorescence Detector. Proceedings of the International Cosmic Ray Conference, Salt Lake City, 2001: 1.
- [33] R.E. Streitmatter et al., Orbiting Wide-angle Light-collectors (OWL). Submitted to SEUS, 31 Jan. 2002.