Age and Abundance Discrimination in Old Stellar Populations
Using Mid-Ultraviolet Colors
Abstract
The restframe mid-ultraviolet spectral region (2000–3200 Å) is important in analyzing the stellar populations of the “red envelope” systems observed at high redshifts. Here, we explore the usefulness of the mid-UV spectral region for determining ages and abundances of old populations. We work with a theoretical set of low resolution spectra and broad-band colors because tests show that these are presently more realistic than high resolution models.
A mid-UV to optical/IR wavelength baseline provides good separation of population components because the main sequence turnoff dominates the integrated light between 2500 and 4000 Å. Mid-UV spectral features are not sensitive to the dwarf/giant mixture in the population, unlike those in the optical region. We find a six magnitude difference in the mid-UV continuum level (normalized at V) over the metallicity range and a comparable difference (per unit ) for ages in the range 4-16 Gyr. Logarithmic derivatives of mid-UV colors with respect to age or metal abundance are 3-10 times larger than for the UBV region. Most of the spectral information on old populations therefore resides below 4000 Å. Measurement of a single mid-UV color is capable of placing a strong lower bound on the mean metallicity of an old population. We investigate the capability of UBV and mid-UV broad-band colors to separately determine age and abundance, taking into account precision in the color measurements. We find that the mid-UV improves resolution in , space by about a factor of 3 for a given observational precision.
Contamination by hot, post-He-flash evolutionary phases can seriously affect the mid-UV spectra of old populations. A simple estimate shows that contamination can reach over 80% in some cases. However, this is straightforward to remove as long as far-UV measurements are available. We find that extinction should have relatively small effects on parameters derived for old populations from the mid-UV.
Finally, we show that a 4 Gyr, solar abundance model based on empirical spectra for nearby stars provides an excellent fit to the mid-UV spectrum of the Local Group elliptical galaxy M32. This indicates that the poorer results obtained from theoretical spectra do arise from limitations of the synthesis models for individual stars.
1 Introduction
1.1 Mid Ultraviolet Age Dating of Distant Galaxies
Recent deep surveys to redshifts beyond reveal galaxies in a wide range of evolutionary states. Among the most interesting types are the “red envelope” systems and the “extremely red objects” (ERO’s). These have integrated spectra or colors which suggest they have experienced little star formation in the preceding few billions of years (Aragon-Salamanca et al. 1993; Kauffmann et al. 1996; Spinrad et al. 1997; Ellis et al. 1997; Zepf 1997; Franceschini et al. 1998; Stanford, Eisenhardt, & Dickinson 1998; Dunlop 1999; Stiavelli et al. 1999; Menanteau et al. 1999; Cimatti et al. 1999; Daddi, Cimatti, & Renzini 2000; Ferreras & Silk 2000; Ferreras, Melchiorri, & Silk 2001; McCarthy et al. 2001; Bernardi et al. 2002). The systems which remain in such samples after dust-reddened galaxies have been purged (e.g. Yan & Thompson 2002) are the least active galaxies at their epochs in terms of star formation and are qualitatively similar to quiescent elliptical galaxies at low redshifts. They are key probes of the star formation history and chemical evolution of the universe at epochs considerably earlier than those at which they are observed. They can be used, for instance, to determine when rapid star formation began in the densest proto-galactic clumps and to what extent it was synchronized in different environments. Well-determined maximal ages for galaxies at different redshifts can be an important constraint on cosmological parameters (e.g. O’Connell 1988, Spinrad et al. 1997, Jimenez & Loeb 2002).
The restframe “mid-ultraviolet” spectral region (2000–3200 Å) is especially important in deducing the history of quiescent galaxies from their integrated light. At this region is redshifted into the observed optical/near infrared bands, where large ground-based telescopes can easily access it. More importantly, the mid-UV should also be more sensitive directly to the age and metal abundance of the stellar population than is the restframe optical band spectrum (O’Connell 1988; Burstein et al. 1988; MacLaren et al. 1988; Magris & Bruzual 1993; Dorman, O’Connell, & Rood 1995, hereafter Paper II; Bressan, Chiosi, & Tantalo 1996; Yi et al. 1997; Ponder et al. 1998; Smail et al. 1998; Rose & Deng 1999; Buson et al. 2000; Ferreras & Silk 2000; Ferreras, Scannapieco & Silk 2002). The mid-UV light is dominated by main sequence stars close to the turnoff. Turnoff light is much more sensitive to age than is the light of red-giant branch (RGB) stars, which contribute at least half of the flux at longer optical and IR wavelengths. The UV is also more sensitive to metal line blanketing and therefore abundance than are longer wavelengths.
A telling example of the stakes and controversies involved in studying the restframe mid-UV of ERO’s is the case of the extremely red radio galaxy LBDS 53W091 at 1.552. Dunlop et al. (1996) and Spinrad et al. (1997) estimated from the general shape of its mid-UV energy distribution and the amplitude of two spectral discontinuities (at 2640 and 2900 Å) that LBDS 53W091 had an age at its observed epoch of Gyr. They based their estimates on a combination of empirical stellar spectra and a variety of theoretical spectral synthesis models. Such a large age would rule out, for instance, an Einstein-de Sitter cosmology for km s-1 Mpc-1. It would imply that massive galaxy formation could be completed at high redshifts () even in cosmologies with nonzero parameters.
Because of its implications, this result has been criticized by several groups, not on the basis of the difficult observations of LBDS 53W091 itself but rather on the age calibration for the model spectra. Bruzual & Magris (1997) used a different set of UV models and fits to optical colors to estimate an age of 1–2 Gyr, permitting a more recent collapse time. Heap et al. (1998) recalibrated the 2640 Å discontinuity and likewise found a “young” age. Yi et al. (2000) presented fits to the mid-UV spectra and optical-band colors based on a full, independent grid of models and also obtained a young age. However, Nolan et al. (2001) point out an apparent error in the evolutionary timescale of the Yi et al. models and derive a 3–4 Gyr age for LBDS 53W091 and a slightly older one for a similar system, LBDS 53W069. More recently, Nolan et al. (2003) find that, after calibration using Hubble Space Telescope (HST) observations of two nearby F stars, their model grid with a range of metallicity and age places a strong lower limit of 2 Gyr on the age of the two galaxies and a best fit age Gyr.
1.2 Limitations of Theoretical Models for Mid-UV Spectra
The disagreements between these various groups suggest that the art of producing realistic and well-calibrated model spectra for composite systems in the mid-UV has not yet matured. The difficulties probably lie both in the adopted component models (stellar atmospheres and interiors) and in the calibration of these and conversion to observables. These studies all incorporate theoretical spectral synthesis models for the emergent UV spectra of stellar atmospheres. Such models are essential to fill out the grid of parameter space because the available empirical spectral libraries derived from observations of bright stars (e.g. Fanelli et al. 1992; Heap et al. 1998; Rose & Deng 1999) are largely restricted to metallicities near the Sun’s.
The most serious known weakness is in the synthesis calculations for cooler stars ( K). For abundances appropriate to elliptical galaxies, a true “continuum” is not present in the mid-UV spectra of stars cooler than 8000 K because of severe line blanketing. Relatively few of the hundreds of important absorption lines have empirical oscillator strengths. Despite the heroic efforts of Kurucz (1992), there are quantum-mechanical predictions of wavelengths and oscillator strengths only for the stronger lines. In these calculations, predicted features may be misplaced in wavelength or may be too strong or too weak. More reliable empirical determinations exist for only a much smaller number of UV lines. Predictions for narrow-band measures of spectral features can also be a strong function of the spectral resolution of the computations, with the highest feasible resolution being desired for the best fidelity.
The Kurucz (1992) models for individual stars, which were used in most of the synthesis attempts cited above, can be directly compared to the set of low spectral resolution (6 Å) data for nearby stars obtained by the International Ultraviolet Explorer satellite (IUE) (e.g. Fanelli et al. 1992). The agreement is discouraging. Lotz et al. (2000) find that in only one of seven narrow-band spectral indices measuring individual strong absorption lines is there good agreement between the models and the IUE data for stars of spectral types F-G (spanning the turnoff in old populations). Similarly, Nolan et al. (2002) find better general agreement for spectra at low (10-15 Å) resolution, although the fits are significantly poorer for an F8 V star () than for an F4 V star (), and deviate systematically in specific wavelength regions (e.g. 2400–2500 Å, 2650–2750 Å). It is not clear how to interpret models all of which deviate in some spectral regions in the observed range even if they can provide good fits to parts of the range. Formal statistical measures of goodness of fit are suspect under these circumstances.
Originally, we had intended this paper to discuss fits to mid-UV galaxy spectra at 5–10 Å resolution, based on the evolutionary tracks and isochrone interpolation methods developed in Paper II combined with Kurucz (1992) atmospheres. Unfortunately, we encountered the same difficulties as did Lotz et al. (2000): theoretical narrow-band indices mostly failed to match empirical values for solar abundance stars near the turnoff in old populations.
None of the existing theoretical model sets appear to be of a quality sufficient to match the observational signal-to-noise level of typical stellar or galaxy data in narrow bands. Until theoretical atmosphere models can demonstrate agreement with the spectral data for individual stars, we believe it is premature to attempt detailed fits of yet more complex, composite population models to empirical galaxy spectra. Fortunately, Heap et al. (1998) and Peterson, Dorman & Rood (2001) are now attacking the problem of improving the synthetic fluxes based on iteration against high resolution mid-UV stellar data from IUE and HST.
However, both we and Lotz et al. (2000) found that fits were better for broader-band measures such as the “Mg Wide” index of Fanelli et al. (1992), the spectral discontinuities at 2900 and 2640 Å, and for broad-band mid-UV colors. Even though accurate modeling of these features requires synthesis at high spectral resolution followed by smoothing over larger bandwidths, it appears that the uncertainties in line opacities are sufficiently stochastic that they are reduced in the wider bands.
1.3 The Mid-UV at Low Resolution
Although all existing mid-UV model sets are suspect at high resolution, they give a better approximation to reality at low resolution. Therefore, we decided to use our models to explore the general behavior of low-resolution mid-UV spectra and broad-band colors as a function of age and metal abundance. Although we calculate the theoretical spectra at 10 Å resolution, we examine the results only at lower resolutions. We do not attempt to calibrate the age-abundance relations in absolute terms, only to investigate relative dependencies.
Our main goal is to determine to what extent two well-known difficulties in studying the integrated light of old populations can be ameliorated using mid-UV observations. First, the integrated photometric properties of populations are approximately power-law functions of age (O’Connell 1988), i.e. , where I is any flux or flux ratio index. This means that their sensitivity to age declines as age increases. The slow photometric evolution of old populations is a serious obstacle to precise age-dating. Second, there is a serious “age-metallicity degeneracy” (O’Connell 1986, Worthey 1994, Worthey et al. 1995, Bressan et al. 1996, and references therein) in that changes of age or metal abundance can have nearly indistinguishable effects on colors or line strengths. Broadband optical colors are particularly susceptible to both these problems, and this has contributed to disagreements over the ages and abundances of old populations found in the literature. The stronger dependence of mid-UV light on age and abundance could offer a solution to both difficulties.
In the next section we discuss our modeling procedures. We then describe how long wavelength baselines permit separation of different population components. The overall sensitivity of our predicted energy distributions to age and abundance is discussed in §2.3. In §3 we describe the broad-band colors derived from the energy distributions and investigate their sensitivity in terms of error ellipses in the plane. We also discuss in §4 the importance of corrections for contamination of the mid-UV spectra of old populations from the high temperature “UV-upturn” or “UVX” component, which often dominates the light at wavelengths below 2000 Å. We investigate extinction effects in §5. Finally, we illustrate the comparison between a model based on empirical IUE spectra of stars and the integrated spectrum of M32.
2 Synthetic Mid-UV Spectra for Old Populations
2.1 Method
This study is based on synthetic spectral energy distributions (SEDs) at 10 Å resolution for single generation populations of a given abundance. The SEDs were computed with revised versions of the evolutionary tracks and the isochrone interpolation routines used in Dorman, Rood, & O’Connell (1993, hereafter Paper I) and Paper II. The evolutionary sequences for this study were computed with the Los Alamos Opacity Library, rather than the newer OPAL opacities, so that the results discussed in this paper are consistent with our earlier calculations. However, the gross properties of stellar sequences that affect integrated SEDs are modified only in small quantitative detail by the use of older physical inputs. The relative lifetimes of different evolutionary stages, which are the most important factors affecting SEDs, are not changed, although the mean temperature of a given isochrone—and thus the age interpretation of a given observation—may be slightly different. The effect is almost always much smaller than the random and systematic errors in the data and uncertainties in the other modeling assumptions, especially the stellar atmospheres.
We use theoretical atmospheres to compute our grid of model SEDs because no empirical library of stellar spectra has sufficient metallicity coverage yet. We generate integrated spectra for each assumed (age, abundance) pair in our grid by summing model stellar fluxes taken from the Kurucz (1992) database for each (, ) point along the evolutionary tracks. To improve the optical colors over those originally computed for Paper II, models with temperatures cooler than 3900 K are represented by empirical fluxes selected from the Gunn & Stryker (1983) atlas. Ages and compositions for the model grid we illustrate in this paper are tabulated in Table 1.
The 10 Å resolution we adopted for our model energy distributions would be entirely adequate for study of broad-band mid-UV colors if the underlying atomic data for individual spectral lines were accurate. As noted in the introduction, however, this is not the case. Accordingly, our UV colors are not expected to be highly accurate, but they are realistic enough for the general assessment of behavior we make here.
We have assumed a Salpeter IMF for all models, In old stellar populations, the optical/UV light is dominated by stars near the turnoff mass (0.8-1.0 ), and dependence of the energy distribution on the IMF is very weak.
2.2 Spectral Decomposition of the Integrated Light of an Old Population
The contributions from different components of a population can change dramatically with wavelength. This is a fundamental feature bearing on the interpretation of old populations in the UV-optical region, so it is worth illustrating here. Similar comparisons for other model sets, but emphasizing optical wavelengths, have been published by Buzzoni (1989) and Yi et al. (1997), among others.
It is important to divide the population into pre- and post-He-flash categories. This is because of the critical effects which mass loss near the point of the He-flash on the RGB has on the subsequent evolution. Since there is no satisfactory deterministic theory for mass loss, the connection between the pre- and post-flash evolution in largely ad-hoc (see Willson 2000 and the discussion in Paper II). As shorthand, we refer to the pre-He-flash stages as the “isochrone” stages.
We have divided the pre-He-flash isochrones into three sections: (a) the main sequence for ; (b) the turnoff contribution, which includes all points on the isochrone with (i.e. the upper part of the main sequence and the subgiant branch, or SGB); and (c) the red giant branch (RGB) itself from the point where . This decomposition allows us to see separately the contribution to the integrated light from hotter stars of the earlier evolutionary phases, whether they lie on the main sequence or the subgiant branch.
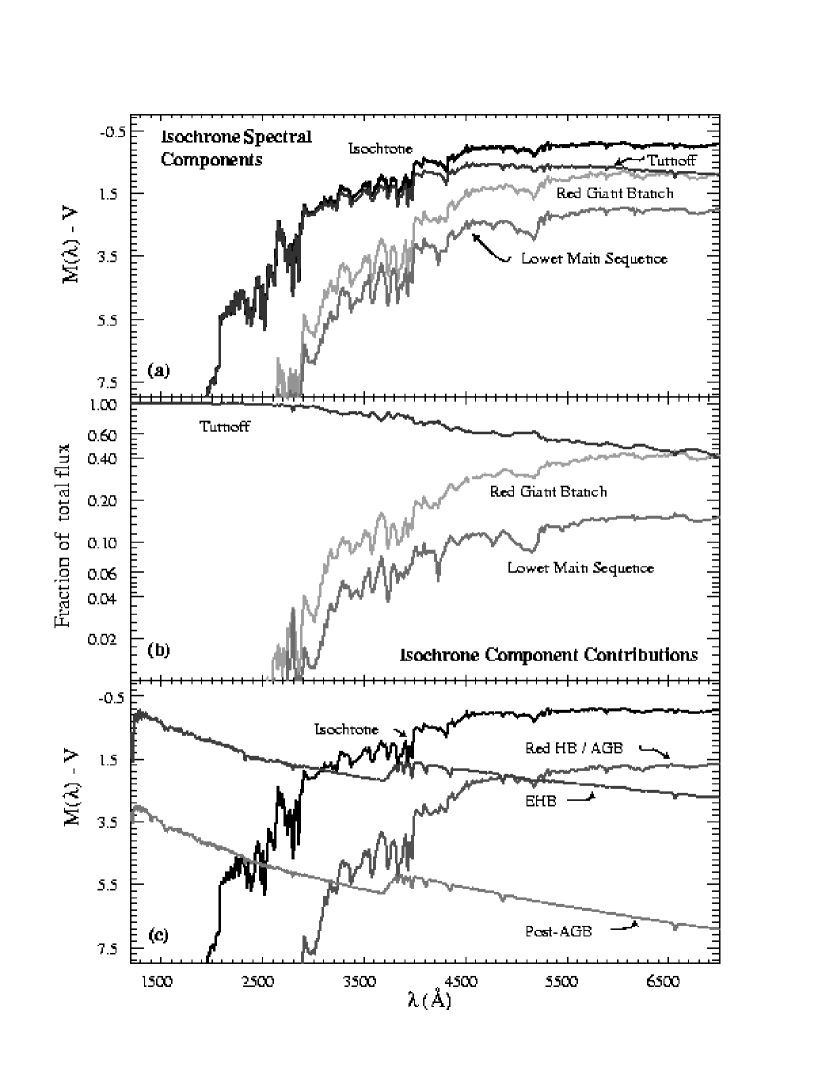
Figure 1 illustrates the relative contributions to the integrated SED of the various components. We take the models at 10 Gyr for solar metallicity as an example. We plot the wavelength range to contrast the behavior of the SED in the UV with the optical. Panel (a) shows the predicted SED of the isochrone and its components, plotted as , where is the flux per unit wavelength and is the mean flux per unit wavelength in the V filter band (see §3). Panel (b) shows the three components of the isochrone SED plotted as fractions of the total isochrone flux.
Panel (c) compares the SEDs of other potential components of an old stellar population. The post-He-flash, advanced evolutionary stages include the red horizontal branch and the asymptotic giant branch (RHBAGB), the extreme horizontal branch (EHB), and the post-asymptotic giant branch (P-AGB). The total population in these advanced phases has been scaled by the evolutionary flux predicted from the isochrone (see Paper II), but the spectra are illustrated here as if all the stars reaching the He-flash continued into that particular channel. The plotted spectra therefore represent upper bounds to the contribution from each phase.
The figure illustrates several points:
-
1.
While the contribution from the turnoff stars and the giants is each about 50% in the V band, the turnoff accounts for most of the flux in panels (a) and (b) shortward of 4000 Å, reaching at 3000Å. This dramatic change in component dominance allows observations with a long wavelength baseline to “dissect” the stellar population.
-
2.
The RHBAGB contribution is dominated by cool AGB stars. Its maximum contribution is about 1 mag fainter than that of the RGB stars, consistent with the shorter lifetimes of the more advanced phases. The amount of cool RHBAGB light depends on the amount of RGB mass-loss and in principle could vanish altogether if mass-loss were large enough. Thus, RGB mass-loss can affect both the UV and the optical-IR SEDs.
-
3.
Feature strengths in the optical region (Å) are influenced by both giants and dwarfs, meaning that detailed modeling of the surface gravity mixture is necessary to interpret them. By contrast, the cool RGB, RHB, and AGB objects do not contribute significantly to the mid-UV light, which means that a much “cleaner” interpretation of the population structure is possible there.
-
4.
The hot EHB and P-AGB components are responsible for the spectral upturns or “UVX” at wavelengths below 2000 Å. The EHB is defined to be those horizontal branch stars with such small envelope masses (typically ) that they do not evolve back up the AGB (Greggio & Renzini 1990, Paper II). If all post-RGB stars passed through the EHB, they would give rise to a UVX which is nearly 2 magnitudes brighter than the largest observed to date (Paper II and O’Connell 1999). Evidently, in the available sample of galaxies, only a minority of the post-RGB objects pass through this phase. The maximum P-AGB contribution is much smaller than the EHB maximum owing to the very short lifetimes of these objects (Greggio & Renzini 1990; Paper II).
-
5.
Depending on the fraction of post-He-flash stars in each channel, either the EHB or P-AGB components could significantly affect light in the 2000–3500 Å region. This UVX contamination complicates the interpretation of the mid-UV light but can be dealt with straightforwardly in practice (see §4).
In the remainder of this paper, we have normalized our model energy distributions in the V-band so that we can conveniently compare the behavior of the mid-UV and optical bands. The use of V-band normalization means that our results are not independent of the influence of the giant branch. They are partially subject to the various uncertainties which have been revealed in optical-band studies (e.g. Charlot et al. 1996). A surprising difficulty which has recently emerged is that the giant branch luminosity function is significantly underestimated by the theoretical models (Schiavon et al. 2002). In practice, one could avoid such complications while retaining the advantages of the mid-UV by confining one’s attention strictly to the shorter wavelengths where the main sequence dominates, using the 3400 Å region, for instance, as a normalization.
2.3 Sensitivity of Predicted Mid-UV Energy Distributions to Age and Abundance
In this section we illustrate the general sensitivity of the predicted mid-UV SEDs to metallicity and age, excluding complications such as UVX contamination.
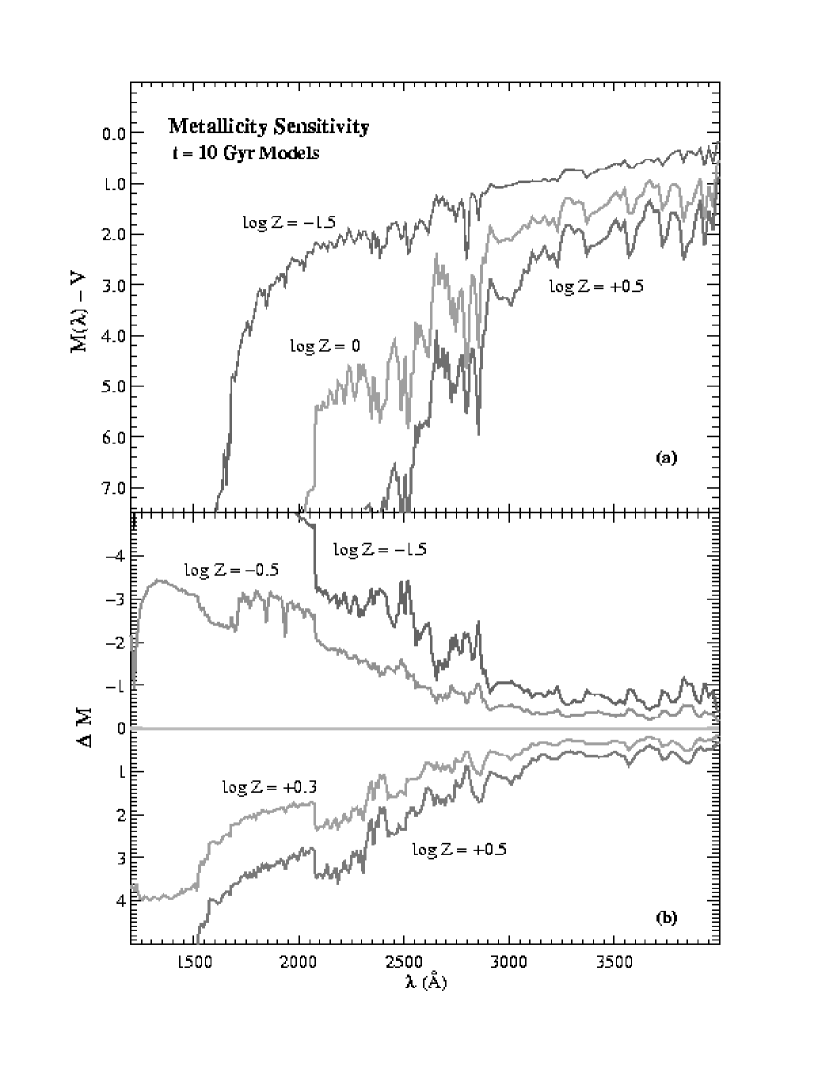
Figure 2 shows the integrated spectra and difference spectra for the “isochrones” (i.e. pre-He-flash evolution) with metallicities at 10 Gyr for the wavelength range . The spectra in Fig. 2 are all normalized at the V-band. The large range in flux level for Å graphically illustrates the extreme sensitivity of the mid-UV to metal abundance, which amounts to magnitudes in the cases plotted. The spectra at and 0 have a strong break at 2100 Å whereas at lower metallicity there is significant flux shortward of this limit. Blanketing in the super-solar metallicity spectra produces a sharp decrease in the continuum shortward of 2600 Å. Even over the range arguably of most interest for studies of galaxies, Fig. 2(b) shows that the continuum level at a fixed age of 10 Gyr differs by about 1 mag at 3500 Å, rising to a mag separation at 2400 Å.
Fanelli et al. (1992) explored the metallicity and temperature sensitivity of mid-UV features in stars observed by IUE. In general, stellar temperature is more important than metallicity. The effects seen in the predicted integrated spectra of Fig. 2 are therefore mainly driven by the influence of metallicity on the temperature of the isochrones, rather than by the influence of metallicity directly on line strengths. The contrast of individual UV spectral features with the local “continuum,” and therefore the apparent strength of the features, can be strongly affected by the very large blanketing in the continuum. Fanelli et al. and Rose & Deng (1999) found that the strength of some UV features (e.g. the Mg ii doublet) is actually larger in more metal poor stars, mainly because of diminished continuum blanketing. Some of these effects are apparent on close inspection of Fig. 2.
The rapid decline below 3000 Å in the flux of the more metal rich models in Fig. 2 clearly implies practical difficulties in obtaining spectra or photometry of such systems. It could contribute to selection effects in the samples of objects detected at high redshifts.
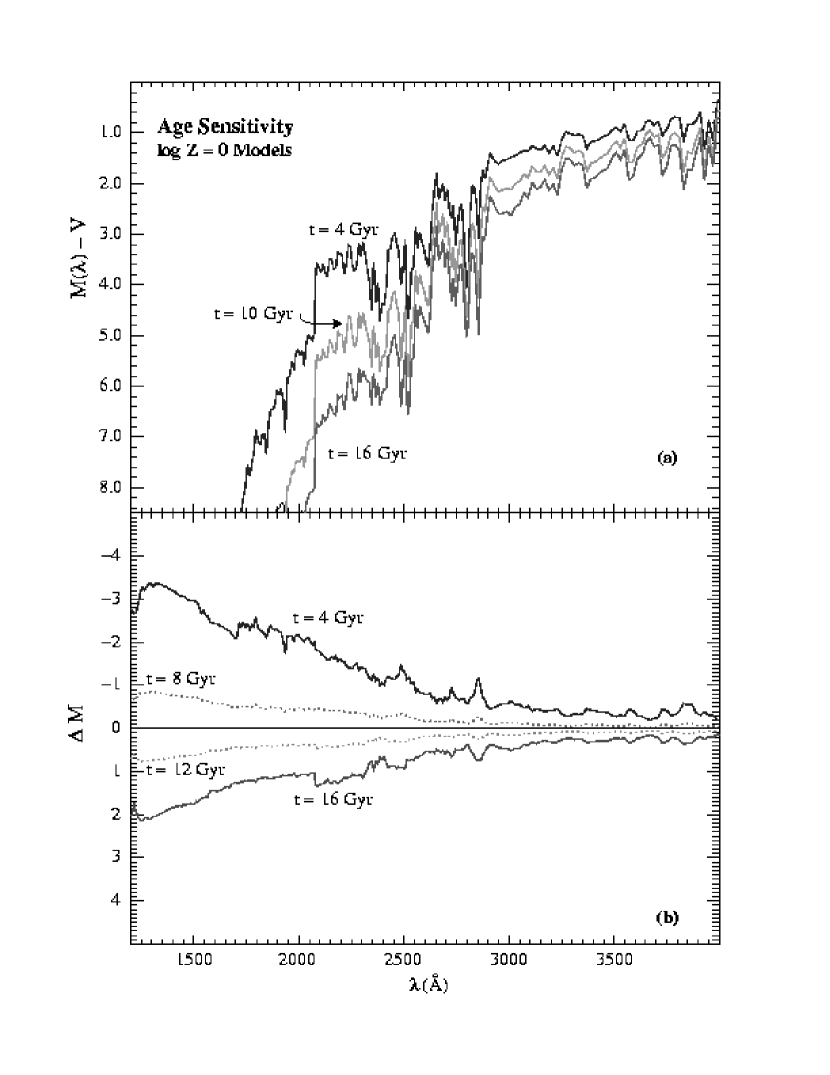
In Figure 3 we illustrate age effects on the spectra of isochrones for solar abundance in a format like that of Fig. 2. Difference spectra in the lower panel are relative to the 10 Gyr model. Qualitatively, the difference spectra resemble those of the metallicity difference spectra in Fig. 2. Their amplitudes are smaller because the total logarithmic range considered is smaller (0.6 dex in age compared to 2.0 dex in metallicity). However, the amplitude per unit change in is comparable. Their shapes also differ in detail, and the region 2500-3000Å looks promising for age-abundance discrimination.
Difference amplitudes such as those in Figures 2 and 3 become much smaller at wavelengths above 4500 Å. (Quantitative values for partial derivatives of color are discussed in the next section.) To put this another way, most of the spectral information on old stellar populations resides below 4000 Å.
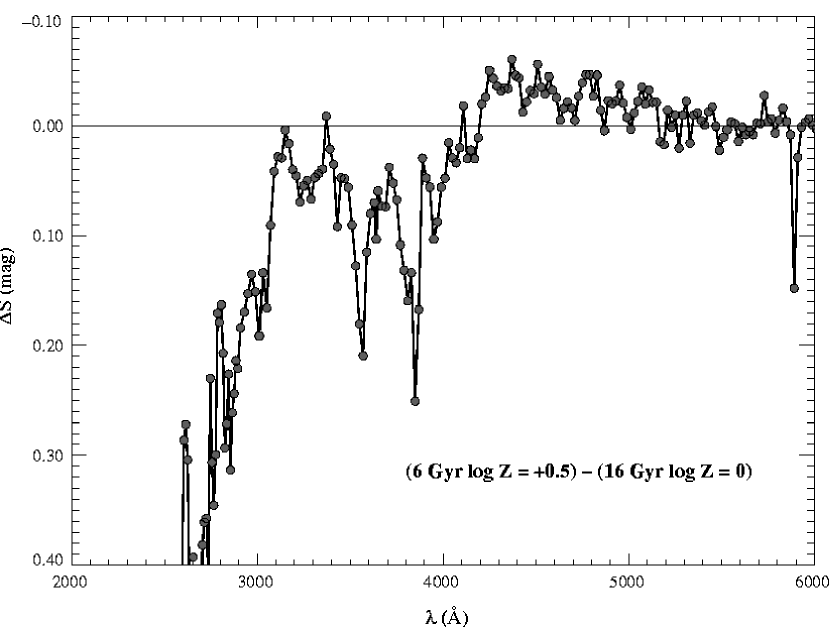
The sensitivity of the mid-UV to population parameters is obviously large, but is it sufficient to distinguish the effects of metallicity from those of age? Taking the models at face value, the answer is yes, as illustrated in Figure 4. Here we plot the difference between the spectra of a younger, metal rich model and an older, solar abundance model. This particular pair (6 Gyr, 3),(16 Gyr, ) was chosen because it was found by Worthey (1994) to be nearly indistinguishable at optical wavelengths. From Fig. 4, our models confirm Worthey’s (1994) conclusion for the spectral range 4500–6000 Å: apart from the strong Na I doublet at 5890 Å, the pair of SEDs is remarkably similar. But large differences between the two models appear at shorter wavelengths. The transition to higher sensitivity occurs near 4000 Å, where the strong decline in cool stellar energy distributions caused by both temperature and line blanketing effects begins. Both the continuum and strong absorption features (almost all of which are blends of different species) are useful age-abundance discriminants in the 3000–4000 Å region. Data with typical precisions of 0.05 mag for 3000–4000 Å can readily distinguish this pair of models. Very large differences appear at 3100 Å and increase sharply to shorter wavelengths.
The fidelity of the higher abundance model in this comparison is open to doubt, so Fig. 4 should be viewed only as broadly indicative of spectral behavior. More than anything else, this diagram emphasizes the importance of the largest practical wavelength coverage in studying old populations.
3 Mid-UV/Optical Broad-Band Colors
Now we consider the behavior of broad-band mid-UV colors computed from the full SEDs of our models. We use the colors primarily as tracers to characterize the general response of the mid-UV spectral region to population parameters. We anticipate that narrow-band spectral measures, once they are properly calibrated by accurate models, would yield yet better performance. However, broad-band colors are useful in practice for several reasons: (a) they are more easily and reliably modeled than are individual spectral features; (b) it is easier to achieve good observational precision in broader bands, an important consideration for high redshift galaxies; and (c) they are not strongly affected by complicating factors such as velocity dispersion or emission features. Here, we discuss the ability of combined mid-UV and optical colors to determine age and abundance.
Chiosi, Vallenari, & Bressan (1997) and Yi et al. (1999) discussed the usefulness of broad-band UV colors for the study of old populations, but they emphasized the far-UV region below 2000 Å and employed the UVX component as a primary dating tool. The UVX is certainly a potentially good index to galaxy ages and abundances, but its interpretation is subject to large prevailing uncertainties in mass loss physics (O’Connell 1999, Willson 2000). Despite the difficulties with model atmospheres, interpretation of the mid-UV is currently on surer physical ground. Chiosi et al. (1997) and Yi, Demarque, & Oemler (1995) also emphasize practical difficulties with red leaks in far-UV filters, such as those on the Hubble Space Telescope. Red leaks are less serious for the mid-UV range.
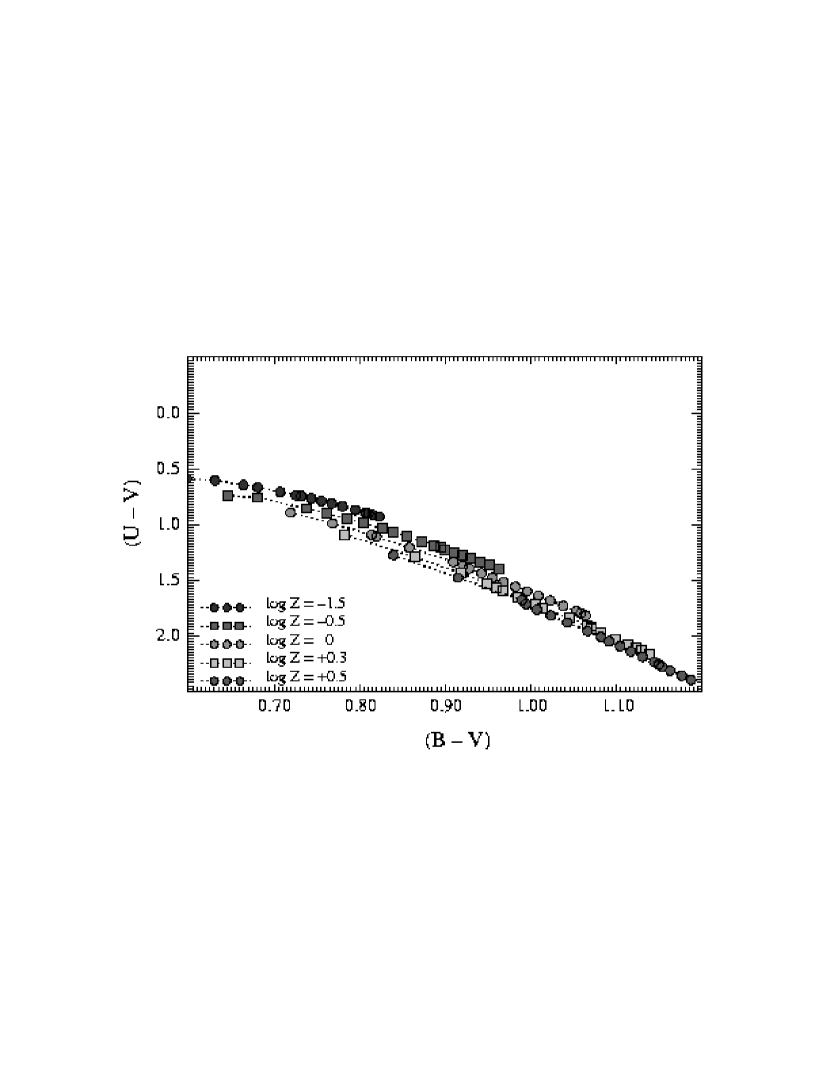
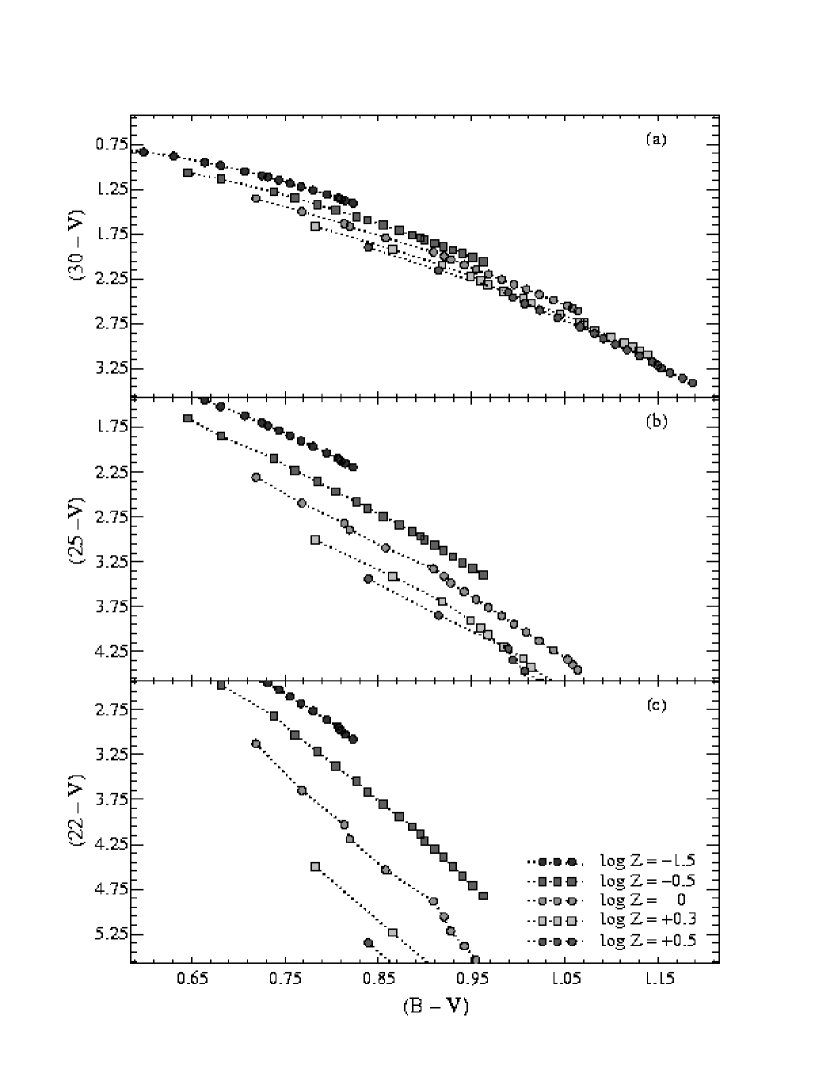
We have computed synthetic colors from our model SEDs by integrating filter transmission curves over them. The colors are given in Table 2(a–e) as a function of age and metallicity. We have used the HST/WFPC2 filters F218W, F255W, and F300W to illustrate the behavior of broadband mid-UV colors. These filters have central wavelengths and effective widths defined in Biretta et al. (1995) as follows: F218W: F255W: F300W: HST ultraviolet magnitudes are on the STMAG system, derived from monochromatic fluxes per unit wavelength as described in Biretta et al. (1996). We used the Johnson band filter response as given by Bessell (1990), and we computed for comparison the Johnson and colors, which have been normalized to 0 for the empirical spectrum of Vega given by Hayes & Lathan (1975). This differs slightly (a few 0.01 mag) from the standard UBV system. As shorthand, we refer to the colors produced from the F218W, F255W, and F300W filters as , , and , respectively.
Note that because of the precipitous decrease of flux in the SEDs of old populations below 3000 Å, predicted colors are sensitive to the exact center, shape, and width of the filters used. A small difference in the sensitivity of the red edge of the mid-UV filter transmission curves can change the UV colors by %.
In Figures 5 and 6 we plot the various colors as a function of . The overlap of the colors in Fig. 5 is symptomatic of the age/abundance degeneracy. The separation between the model sequences at different in Fig. 6 shows the extent to which the degeneracy has been lifted in the mid-UV. The separation is considerably greater in and than in and The separation between the model pair discussed in §2.3 is also evident here.
Applying the plotted models to existing UV data for E galaxies, we find that some ranges of metallicity are excluded altogether by a single mid-UV broadband observation (as discussed in Paper II). For example, for most of the luminous elliptical sample in Table 1 of Paper II. This excludes models with .
Another way to look at sensitivity is to consider the partial derivatives , where is either age or fractional metal abundance. Such logarithmic derivatives tend to be roughly constant for ages above 0.5 Gyr (e.g. O’Connell 1988, Bruzual & Charlot 1993, Girardi 2000). In Table 3 we have evaluated derivatives for the five computed colors in the vicinity of a fiducial model for Gyr, . We see from the table that the derivatives for mid-UV colors are 3–10 times larger than for optical bands. The derivatives increase rapidly below 3000 Å. This demonstrates quantitatively the improved sensitivity of the shorter wavelengths to age and abundance in old populations.
Nonetheless, the differences between the tabulated and derivatives are not as large as might have been hoped. Considered geometrically, the angular separation between surfaces of constant and constant in mid-UV broad-band color space is not much different than in the optical bands. However, the higher mid-UV sensitivity means that a given change will produce a larger amplitude effect. The age-metallicity degeneracy cannot be ignored even in the mid-UV. A multi-wavelength approach is clearly required.
3.1 Observational Discrimination Between Age and Metallicity in Broad Band UV Colors
Figures 4 and 6 indicate that age/abundance ambiguities ought to be significantly reduced in the mid-UV. However, UV fluxes cannot yet be measured with the same precision as optical fluxes due to remaining calibration problems and the faintness of galaxies in the UV. Therefore, the issue is not simply the sensitivity of the colors to population parameters, as measured by partial derivatives or diagrams like Figs. 2-6, but rather the sensitivity compared to typical observational uncertainties in the various bands (O’Connell 1988). In this section we compare the sensitivities of integrated mid-UV and optical colors to age and abundance while taking observational uncertainties into account. We consider here only the case of a simple stellar population: i.e. a single generation with a uniform metal abundance.
We denote the broad-band colors derived from the spectral energy distribution for a population of given age, , and abundance, by . The range of models that produce a value of within a given observational uncertainty, , of a given color, , is the set of such that
| (1) |
For a set of observed colors all of which have comparable observational uncertainties, the range of models consistent with the data is the error ellipse in the plane defined by the root mean square (rms) differences in colors between theory and observation is determined by
| (2) |
The ’s are related to the basic population parameters and as follows:
| (3) |
Worthey (1994) has presented a similar discussion of index sensitivity, though without explicit inclusion of observational uncertainties. He defined “metallicity sensitivity” indices in terms of the ratios of the partial derivatives in this expression for various combinations of line strengths in the optical band.
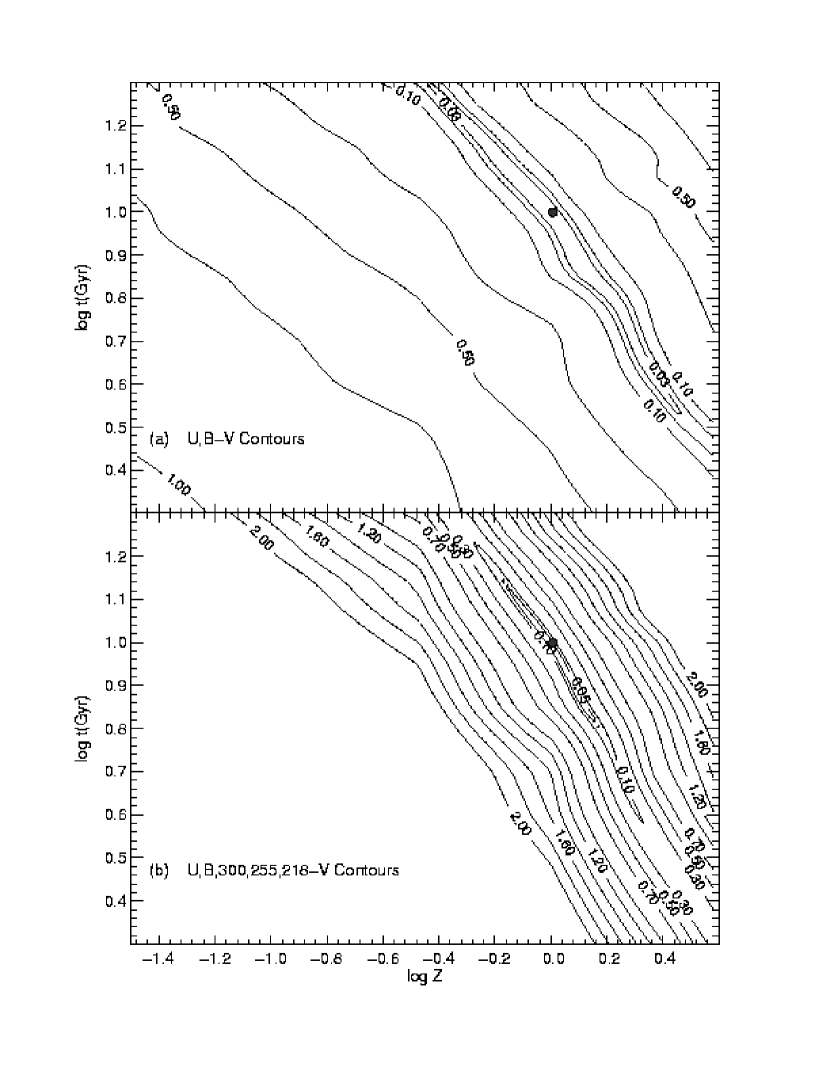
Figure 7 shows sample error ellipse contours of in the plane as defined in equation (2). To construct this plot, we have selected a fiducial model (10 Gyr, , indicated by the filled circle) and determined its rms separation from other models in various colors. In panel (a) the contours are derived using only while panel (b) is constructed for mid-UV plus optical colors.
In both diagrams there are obvious “valleys of degeneracy” running diagonally. Within these valleys an older, more metal poor model can be found which yields the same colors (for a given level of observational precision) as a younger, more metal rich model, so it is not possible to separate and unambiguously. These are the analogues in broad-band colors of the “3/2” degeneracy relation for optical absorption-line features discussed by Worthey (1994). However, the contours are much broader for a given observational precision in the optical than in the UV bands. The innermost contour plotted in both panels is 0.03 mag, a precision that can be routinely achieved for nearby galaxies in the optical but not currently in the UV. However precisions in the range 0.05–0.1 mag are possible in the mid-UV. The diagram shows that the mid-UV colors yield uncertainties for comparable to those of optical colors at .
One can therefore say that broad-band mid-UV colors improve resolution in space by about a factor of 3 for a given observational precision. Comparable or better improvement is expected if one uses narrower bands to measure the highly structured mid-UV spectrum, as Figures 2, 3, and 4 suggest. This advantage is such that it is certainly desirable to push for better quality in both observations and modeling of the mid-UV.
Note that we are addressing only the effects of observational error on derivation of population parameters. A different kind of uncertainty was discussed by Charlot et al. (1996): namely, the systematic uncertainties inherent in the models themselves, which would be reflected in changes in the contours in these diagrams with different authors. Needless to say, both factors contribute to the uncertainty of the results from population synthesis.
4 UVX Contamination of Mid-UV Galaxy Spectra
The mid-UV spectra of old populations cannot be considered in isolation from the UVX phenomenon. Old populations contain low-mass stars in advanced (post-He-flash) evolutionary phases with K, which produce copious UV flux (Greggio & Renzini 1990; O’Connell 1999, and references therein). Although their contribution is negligible at visible wavelengths, these UVX objects can contribute significantly to the mid-UV spectral range of interest here. The difficulty is that we do not yet have a firm enough understanding of these evolutionary phases to predict their contribution from first principles. Fortunately, the UVX affects the mid-UV spectrum only by contributing an essentially featureless continuum. Thus, if appropriate far-UV observations of the same object are available, this can be removed empirically, and the spectrum of the cool components can be extracted with good precision.
In the simplest approach to removing the UVX contamination, one can take advantage of the facts that the SEDs of the hot UVX objects are smooth in the mid-UV wavelength range and do not depend strongly on UVX temperature while the other components in E galaxy populations contribute little to the far-UV flux (Å). No assumptions need be made about the characteristics of the cool population other than that its far-UV contribution can be ignored. One can use either broad-band colors or narrow band fluxes at selected wavelengths.
Here, we use two broad-band colors to estimate the magnitude of UVX contamination. In equation form, if we observe galaxy broad-band colors and corresponding to UV/optical flux ratios and , then
| (4) |
where denotes the flux contributed by the component at wavelength . Defining to be the fractional contribution of the hot component to the V-band light, and using the fact that the sum of the fractional contributions of the hot and cool components is 1.0, we have
| (5) |
If we assume that , then for any photometric properties adopted for the UVX component, i.e. for a given pair of and values, we immediately obtain an estimate for . This also determines the value of of the cool component. The fractional contribution of the hot component to the light at 2500 Å is .
The spectrum of a star with K is a good approximation to the UVX energy distribution of luminous E galaxies (e.g. Brown et al. 1997). This has and . In Table 4 we show the results of applying these values to the extinction-corrected, observed broad-band nuclear colors of four bright galaxies (taken from Paper II). M60 and M89 have large UV-upturns, the center of M31 has a moderate upturn, and M32 has a weak upturn. The column headed shows the contribution of the UVX component to the -band light, while the column headed gives the UVX contribution at 2500 Å. For M32, the UVX contamination in the mid-UV is minor (only 10%), but in the two strong-UVX sources, the UVX light is actually dominant (60-80%). The column headed contains the estimated color in the absence of the UVX contamination; this can obviously be very different from the observed color. Because of the steep rise of the cool star energy distributions to longer wavelengths, UVX contamination will decline rapidly longward of 2900 Å.
The estimated mid-UV contamination in these examples is comparable to those inferred by Burstein et al. (1988) and Ponder et al. (1998). Rose & Deng (1999) also derived a good fit to narrow-band mid-UV features in M32 using a 10% UVX contamination. For the strong upturn cases, contamination strongly affects the mid-UV and produces a significantly bluer and weaker-lined appearance than the intrinsic cool-star spectrum. Correction for the contamination is obviously essential before the mid-UV spectra can be analyzed for age and abundances. (We do not attempt to interpret the values using our models because of the various calibration uncertainties discussed in §2.1.) The UVX itself should evolve with time and is not expected to be present in systems younger than a few Gyr (e.g. Bressan et al. 1996; Yi et al. 1997).
The confidence with which UVX contamination can be removed depends on the nature of the UV data at hand. If only a far-UV mean flux is available, then one must assume a surface temperature and metallicity for the UVX component. Uncertainties with such assumptions are likely to be K in temperature and dex in . According to the Kurucz (1992) models, the corresponding changes in the colors of hot stars are mags and mags, respectively. For a typical galaxy in Table 4, . With more data points, the far-UV spectral slope can be determined and the color of the hot component estimated directly.
In the case of high quality mid-UV spectra, it would be possible to obtain a simultaneous solution for the hot and cool components using optimizing synthesis techniques. That approach would take advantage of the fact that the UVX spectrum is expected to be smooth in the mid-UV. But even here, it would be desirable to have far-UV observations available.
5 Extinction Effects
A potential complication for analysis of mid-UV light is interstellar extinction, which is larger there than at optical wavelengths. In this section we discuss the likely impact of extinction effects on the mid-UV.
The fourth column of Table 3 lists the color changes expected for a color excess of based on the UV reddening law of Cardelli, Clayton, & Mathis (1989). The effects of a given amount of dust in the line of sight on the mid-UV colors are 3-6 times larger than at optical wavelengths. However, the net impact of an error in the extinction correction on a derived population parameter would be in proportion to the ratio of the derivative of color with respect to extinction to the derivative with respect to the parameter. Because the mid-UV sensitivity to age and abundance is so high, we find that extinction-driven errors in population parameters derived from broad-band colors are actually smaller in general in the mid-UV than in the optical bands.
Internal extinction is generally very small in most nearby elliptical galaxies. Far-UV observations by the Hopkins Ultraviolet Telescope (e.g. Ferguson & Davidsen 1993, Brown et al. 1997) provided excellent limits on internal extinction in a small sample of early-type systems. These showed that the slope of the far-UV spectral rise in the galaxies is nearly at the maximum encountered among hot stars (Dean & Bruhweiler 1985, Fanelli et al. 1992), leaving little room for internal interstellar reddening in excess of a few 0.01 mags in . Although high resolution HST images reveal dust lanes or filamentary structures in many early-type nuclei (e.g. Jaffe et al. 1994, Tran et al. 2001), these are on such a small scale that they usually do not importantly affect integrated light measures with apertures larger than a few arc-sec. Of course, the less mature systems observed at large lookback times might exhibit larger extinction effects than these local counterparts.
At higher spectral resolutions, where line strengths and spectral discontinuities can be well measured, it is possible to determine extinction reliably using optimizing spectral synthesis techniques (e.g. O’Connell 1980; Fanelli, O’Connell, & Thuan 1988). The method works because the absorption line strengths and sharp continuum breaks are sensitive only to the stellar population mixture while the continuum slopes over wider wavelength intervals also respond to extinction. For optical spectra, the technique yields uncertainties in of a few 0.01 mags, and comparable performance should be possible in the mid-UV given good quality data. Spinrad et al. (1997) based their age-dating for a galaxy at in part on the spectral breaks at 2640 and 2900 Å, which are essentially reddening-independent.
We have also examined the extent to which reddening will affect correction for the UVX contamination. For color excesses (or reddening correction errors) up to , we find that the effects on the derived (see §4 and Table 4) are small, of order 0.05 mag. The reason is that excess reddening reduces the far-UV flux relative to the mid-UV but simultaneously causes the far-UV energy distribution to look cooler, thereby partially compensating the estimated contamination fraction.
We conclude that, although extinction corrections should be part of any analysis of mid-UV spectra, extinction is not a major impediment to using the mid-UV to study old populations.
6 An Empirical Library Model for M32
The empirical mid-UV spectral libraries, based on bright stars, offer good coverage of the temperature and gravity grid for near-solar metallicity. Although these may be of limited usefulness for interpreting the spectra of luminous E galaxies, which tend to be more metal-rich, they should be satisfactory for systems which have solar-like abundances. The most important of these is the Local Group elliptical M32. This is well established to have a mean metallicity near solar (e.g. O’Connell 1980, Rose 1994, Worthey 1998, Rose & Deng 1999, Vazdekis & Arimoto 1999, Trager et al. 2000, del Burgo et al. 2001) and is bright enough that mid-UV data with good signal-to-noise is available. It is interesting to explore the extent to which the available empirical libraries are capable of providing good fits to the spectra of galaxies like M32.
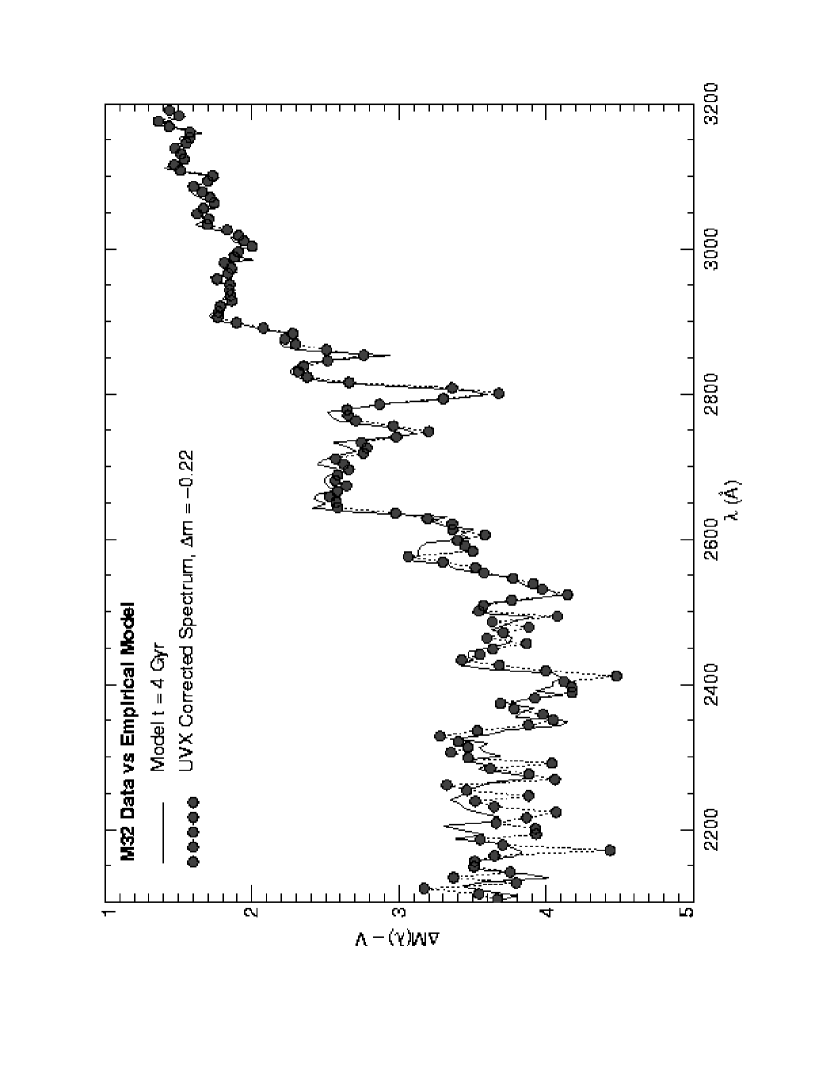
Here, we show a fit to the 6 Å resolution IUE spectrum of the center of M32 obtained by Burstein et al. (1988; data kindly provided by D. Burstein). The spectrum was corrected for foreground extinction using the Savage & Mathis (1979) law and adopting (Burstein & Heiles 1984). Correction for UVX contamination was based on the results of the previous section and employed a synthetic UVX SED matching the resolution of the data. Since the contamination is small, the resulting spectrum does not depend strongly on the correction. The model illustrated (Fanelli 1991) has solar abundance and a turnoff age of 4 Gyr, similar to that derived in the various optical-band studies cited above. The stellar spectra combined in the model were taken from the library of mean IUE spectra for stellar groups published by Fanelli et al. (1992). The assumed component contributions by each group are listed in Table 5.
The correspondence between the model and the data shown in Figure 8 is excellent. The model provides a good fit to the pseudo-continuum across the entire range illustrated (2100-3200 Å), showing slightly larger residuals below 2400 Å, where the signal-to-noise of both the galaxy and input stellar data becomes poorer. It also fits all the strong absorption features above 2500 Å. (Rose and Deng 1999 had already shown good agreement between solar abundance stars and M32’s spectrum for these features.) There was no attempt to optimize the fit (e.g. by varying the mixture of components) other than adding a zero point offset of magnitudes to the corrected data. This offset is probably within the uncertainty in matching the IUE and optical photometric apertures.
Figure 8 shows that empirical mid-UV stellar spectra can provide very good fits to galaxy spectra where metallicities match. This argues that the poorer results obtained with theoretical spectra do arise from limitations of the synthesis models for individual stars.
7 Summary
Good tools for the analysis of the mid-UV spectral range (2000-3200 Å in the rest frame) are needed to interpret stellar populations in old galaxies at high redshift. None of the existing theoretical model sets appear to be of a quality sufficient to match the observational signal-to-noise level of typical mid-UV data in narrow bands, mainly because of the difficulty of producing high fidelity synthetic spectra for metal rich stellar atmospheres. In this paper, we have used models at low spectral resolution, which are expected to be more realistic, to explore the usefulness of the mid-UV for estimating the ages and metal abundances of old populations.
We discussed the spectral decomposition of an old population, which shows that a mid-UV to optical/IR wavelength baseline allows good separation of the main sequence turnoff from giant branch light. The turnoff and giant branch each contribute about 50% of the V-band light, but the turnoff dominates between 2500 and 4000 Å. Unlike the optical region, spectral features in the mid-UV are not sensitive to the dwarf/giant mixture in the population.
Giant branch mass loss at the helium flash, which determines the behavior of post-flash stars, is important in two ways: high mass loss produces hot phases (like the EHB stars), which strongly influence the UV light; and very large amounts of mass loss will reduce the cool RHBAGB contribution to the infrared light.
We illustrate the general sensitivity of the mid-UV to age and metal abundance using differential spectral diagrams. There is a six magnitude difference in the mid-UV continuum level (normalized at V) over the metallicity range and a comparable difference (per unit ) for ages in the range 4-16 Gyr. The rapid decline in flux below 3000 Å in metal rich populations may contribute to selection effects in the samples of objects detected at high redshifts. Sensitivity to age and abundance declines longward of 4500 Å, meaning that most of the spectral information on old stellar populations resides below 4000 Å.
We derived a set of broad-band colors from our model spectra for the range 2200 to 5500 Å. Logarithmic derivatives of mid-UV colors with respect to age or metal abundance are 3–10 times larger than for the UBV region. Measurement of a single mid-UV color, such as , is capable of placing a strong lower bound on the mean metallicity of an old population. We investigated the ability of UBV and mid-UV broad-band colors to separately determine age and abundance taking into account observational precision in the color measurements. Figure 7 shows that the mid-UV improves resolution in , space by about a factor of 3 for a given observational precision. The “age-metallicity degeneracy” is significantly reduced for both the continuum and spectral features in the mid-UV, but it cannot be ignored even there.
Contamination by the hot UVX (or “UV-upturn”) component is important in the mid-UV. We confirm earlier investigations which found that this can be very large, reaching over 80% of the mid-UV light in galaxies with the brightest far-UV sources. In general it is straightforward to remove its effects. The true energy distribution of the cool components, on which age and abundance estimates must be based, can be very different from the uncorrected observations.
We find that extinction should have relatively small effects on parameters derived for old populations from mid-UV observations.
Finally, we compared a 4 Gyr, solar abundance model derived from IUE observations of nearby stars to the integrated mid-UV spectrum of the Local Group elliptical galaxy M32, which has near-solar abundances. The continuum and feature fit is excellent. This shows that empirical mid-UV stellar spectra can provide good fits to galaxy spectra (where metallicities match) and indicates that the poorer results obtained from theoretical spectra do arise from limitations of the synthesis models for individual stars. The importance of a concerted effort to improve the fidelity of theoretical models for the emergent mid-UV spectra of stars near the main sequence turnoff in old populations is clear.
References
- (1) Aragón-Salamanca, A., Ellis, R.S., Couch, W.J., & Carter, D. 1993, MNRAS, 262, 764
- (2) Barger, A.J., Cowie, L.L., Trentham, M., Fulton, E., Hu, E.M., Songaila, A., & Hall, D. 1999, AJ, 117, 102
- (3) Bernardi, M. et al. 2002, AJ, 123, 2990
- Bessell (1990) Bessell, M. S., 1990 PASP, 102, 1181
- (5) Biretta, J. et al. 1996, The WFPC2 Instrument Handbook (Baltimore: STScI) and http://www.stsci.edu/instruments/wfpc2
- (6) Bressan, A., Chiosi, C., & Fagotto, F., 1994 ApJS, 94, 63
- (7) Bressan, A., Chiosi, C., & Tantalo, R. 1996, A&A, 311, 425
- (8) Brown, T. M., Ferguson, H. C., Davidsen, A. F., & Dorman, B. 1997, ApJ, 482, 685
- Bruzual & Charlot (1993) Bruzual A., G. & Charlot, S. 1993, ApJ, 405, 538
- Bruzual & Magris (1997) Bruzual A., G. & Magris, G. 1997 in The Ultraviolet Universe at Low and High Redshift eds. W. H. Waller, M. N. Fanelli, J. Hollis, & A. C. Danks (AIP:Woodbury), 291
- (11) Burstein, D., Bertola, F., Buson, L. M., Faber, S. M., & Lauer, T. R. 1988, ApJ, 328, 440
- (12) Burstein, D., & Heiles, C. 1984, ApJS, 54, 33
- Buzzoni (1989) Buzzoni, A. 1989, ApJS, 71, 817
- (14) Buson, L. M., Bertola, F., Cappelari, M., Chiosi, C., Dressler, A., and Oemler, A., 2000, ApJ, 531, 692
- (15) Cardelli, J. A., Clayton, G. C., & Mathis, J. S. 1989, ApJ, 345, 245
- Charlot, Worthey, & Bressan (1996) Charlot, S., Worthey, G. S., & Bressan, A. 1996, ApJ, 457, 625
- (17) Chiosi, C., Vallenari, A., & Bressan, A. 1997, A&AS, 121, 301
- (18) Cimatti, A., Daddi, E., di Serego Alighieri, S., Pozzetti, L, Mannucci, F., et al. 1999, A&A, 352, L45
- Clegg & Middlemass (1987) Clegg, R. E. S. and Middlemass, D. 1987, MNRAS, 228, 759
- (20) Daddi, E., Cimatti, A., & Renzini, A. 2000, A&A, 362, L45
- (21) Dean, C. A., & Bruhweiler, F. C. 1985, ApJS, 57, 133
- (22) del Burgo, C., Peletier, R. F., Vazdekis, A., Arribas, S., & Mediavilla, E. 2001, MNRAS, 321, 227
- (23) Dorman, B., O’Connell, R.W. and Rood, R.T., 1995 ApJ, 442, 105 (Paper II)
- (24) Dorman, B., Rood, R.T., & O’Connell, R. W. 1993, ApJ, 419, 596 (Paper I)
- (25) Dunlop, J. 1999, in The Most Distant Radio Galaxies, eds. J. Rottgering, P. Best, & M. Lehnert (Royal Netherlands Academy of Arts & Sciences), 71
- (26) Dunlop, J., Peacock, J. A., Spinrad, H. J., Dey, A., Jimenez, R., Stern, D., & Windhorst, R., 1996, Nature, 363, 581
- (27) Ellis, R.S., Smail, I., Dressler, A., Couch, W.J., Oemler, A., et al. 1997, ApJ, 483, 582
- (28) Fanelli, M. N. 1991, PhD Thesis, University of Virginia
- (29) Fanelli, M. N., O’Connell, R. W., Burstein, D., & Wu, C.-C., 1992, ApJS, 82, 197
- (30) Fanelli, M. N., O’Connell, R. W., & Thuan, T. X. 1988, ApJ, 334, 665
- Ferguson & Davidsen (1993) Ferguson, H. C. & Davidsen, A. F. 1993, ApJ, 408, 92
- (32) Ferreras, I., & Silk, J. 2000, ApJ, 541, L37
- (33) Ferreras, I., Melchiorri, A., & Silk, J. 2001, MNRAS, 327, L47
- (34) Ferreras, I., Scannapieco, E., & Silk, J. 2002, ApJ, 579, 247
- (35) Francis, P. J., et al. 1996, ApJ, 457, 490
- (36) Franceschini, A., Silva, L, Giovanni, F., Granato, L, Bressan, A., Arnouts, S., & Danese, L. 1998, ApJ, 506, 600
- (37) Girardi, L. 2000, in Massive Stellar Clusters, eds. A. Lancon & C. Boily (San Francisco: ASP Press), p. 133
- Greggio & Renzini (1990) Greggio, L. and Renzini, A. 1990, 364, 35
- Gunn & Stryker (1983) Gunn, J. E. and Stryker, L. L. 1983, ApJS, 52, 121
- Hayes & Latham (1975) Hayes, D. S. & Latham, J. 1975, ApJ, 197, 593
- (41) Heap, S.R., et al. 1998 ApJ, 492, L131
- (42) Jaffe, W., Ford, H. C., O’Connell, R. W., van den Bosch, F. C., & Ferrarese, L. 1994, AJ, 108, 1567
- (43) Jimenez, R. & Loeb, A. 2002, ApJ, 573, 37
- (44) Kauffmann, G., Charlot, S., & White, S.D.M. 1996, MNRAS, 283, L117
- (45) Kurucz, R.L. 1992, in The Stellar Populations of Galaxies (IAU Symposium 149), eds. B. Barbuy & A. Renzini (Dordrecht: Kluwer), p. 225
- (46) MacLaren, I., Ellis, R.S., & Couch, W. J. 1988, MNRAS, 230, 249
- Magris & Bruzual (1993) Magris, G. & Bruzual A. G., 1993, ApJ, 417, 102
- (48) McCarthy, P. J. et al. 2001, ApJ, 560, L131
- (49) Menanteau, F., Ellis, R.S., Abraham, R.G., Barger, A.J., & Cowie, L.L. 1999, MNRAS, 309, 208
- (50) Nolan, L. A., Dunlop, J. S., & Jimenez, R. 2001, MNRAS, 323, 385
- (51) Nolan, L. A., Dunlop, J. S., Jimenez, R., & Heavens, A. F. 2003 MNRAS, in press
- (52) O’Connell, R. W. 1980, ApJ, 236, 430
- O’Connell (1986) O’Connell, R. W. 1986, in Stellar Populations, eds. C. Norman, A. Renzini, and M. Tosi (Cambridge: Cambridge University Press), 167
- (54) O’Connell, R. W. 1988, in Towards Understanding Galaxies at High Redshift, eds. A. Renzini & R. G. Kron (Dordrecht: Kluwer), p. 177
- (55) O’Connell, R. W. 1999, ARAA, 37, 603
- Park & Lee (1997) Park, J. H. & Lee, Y.-W. 1997, ApJ, 476, 28
- (57) Peterson, R. C., Dorman, B., & Rood, R. T. 2001, ApJ, 559, 372
- (58) Ponder, J. M., Burstein, D., O’Connell, R. W., Rose, J. A., Frogel, J. A., Wu, C.-C., Crenshaw, D. M., Rieke, M. J., & Tripicco, M. 1998, ApJ, 116, 2297
- Reimers (1975) Reimers, D. 1975, Mém. Soc. Roy. Sci. Liège, Ser., 8, 369
- (60) Rose, J. A. 1994, AJ, 107, 206
- (61) Rose, J. A., & Deng. S. 1999, ApJ 117, 2213
- (62) Savage, B. D.,, & Mathis, J. S. 1979, ARAA, 17, 73
- (63) Schiavon, R. P., Faber, S. M., Rose, J. A., & Castilho, B. V. 2002, ApJ, 580, 873
- (64) Smail, I., Edge, A. C., Ellis, R. S., & Blandford, R. D. 1998, MNRAS, 293, 124
- (65) Spinrad, H., Dey, A., Peacock, J., Dunlop, J., Jimenez, R., Stern, D., & Windhorst, R. 1997, ApJ, 484, 581
- (66) Stiavelli, M., Treu, T., Carollo, C.M., Rosati, P., Viezzer, R. et al. 1999, A&A, 343, L25
- (67) Stanford, S. A., Eisenhardt, P. R., & Dickinson, M. 1998, ApJ, 492, 461
- (68) Tran, H. D., Tsvetanov, Z., Ford, H. C., Davies, J., Jaffe, W., van den Bosch, F. C., Rest, A. 2001, AJ, 121, 2928
- (69) Trager, S. C., Faber, S. M., Worthey, G., & Gonzalez, J. J. 2000 AJ, 119, 1645
- (70) Vazdekis, A., & Arimoto, N. 1999, ApJ, 525, 144
- (71) Willson, L. A. 2000, ARAA, 38, 573
- Worthey (1994) Worthey, G. S. 1994, ApJS, 95, 107
- (73) Worthey, G. S. 1998, PASP, 110, 888
- (74) Worthey, G., Trager, S.C., & Faber, S.M. 1995, in Fresh Views of Elliptical Galaxies, eds. A. Buzzoni, A. Renzini, & A. Serrano (San Francisco: Astronomical Society of the Pacific), p. 203
- (75) Yan, L., & Thompson, D. 2002, ApJ, in press (astro-ph/0212153)
- (76) Yi, S., Demarque, P., & Oemler, A. 1995, PASP, 107, 273
- Yi, Demarque, & Oemler (1997) Yi, S., Demarque, P., & Oemler, A. 1997, ApJ, 486, 201
- (78) Yi, S., Lee, Y.-W., Woo, J.-H., Park, J.-H., Demarque, P., Oemler, A. 1999, ApJ, 513, 128
- (79) Yi, S., Brown, T.M., Heap, S., Hubeny, I., Landsman, W., Lanz, T., & Sweigart, A. 2000, ApJ, 533, 670
- (80) Zepf, S.E. 1997, Nature, 390, 377
| [Fe/H] | [O/Fe] | Ages (Gyr) | |||
|---|---|---|---|---|---|
| 0.0006 | –1.5 | –1.48 | 0.60 | 0.235 | 2–20 |
| 0.0060 | –0.5 | –0.47 | 0.23 | 0.250 | 2–20 |
| 0.0169 | 0.0 | 0.00 | 0.00 | 0.270 | 2–20 |
| 0.0400 | 0.3 | 0.38 | 0.00 | 0.270 | 2–20 |
| 0.0600 | 0.5 | 0.58 | 0.00 | 0.270 | 2–20 |
| t (Gyr) | (22-V) | (25-V) | (30-V) | (U-V) | (B-V) |
|---|---|---|---|---|---|
| (a): [Fe/H] =-1.48 | |||||
| 2 | |||||
| 3 | |||||
| 4 | |||||
| 5 | |||||
| 6 | |||||
| 7 | |||||
| 8 | |||||
| 9 | |||||
| 10 | |||||
| 11 | |||||
| 12 | |||||
| 13 | |||||
| 14 | |||||
| 15 | |||||
| 16 | |||||
| 17 | |||||
| 18 | |||||
| 19 | |||||
| 20 | |||||
| (b): [Fe/H] =-0.47 | |||||
| 2 | |||||
| 3 | |||||
| 4 | |||||
| 5 | |||||
| 6 | |||||
| 7 | |||||
| 8 | |||||
| 9 | |||||
| 10 | |||||
| 11 | |||||
| 12 | |||||
| 13 | |||||
| 14 | |||||
| 15 | |||||
| 16 | |||||
| 17 | |||||
| 18 | |||||
| 19 | |||||
| 20 | |||||
| (c): [Fe/H] = 0.00 | |||||
| 2 | |||||
| 3 | |||||
| 4 | |||||
| 5 | |||||
| 6 | |||||
| 7 | |||||
| 8 | |||||
| 9 | |||||
| 10 | |||||
| 11 | |||||
| 12 | |||||
| 13 | |||||
| 14 | |||||
| 15 | |||||
| 16 | |||||
| 17 | |||||
| 18 | |||||
| 19 | |||||
| 20 | |||||
| (d): [Fe/H] = 0.38 | |||||
| 2 | |||||
| 3 | |||||
| 4 | |||||
| 5 | |||||
| 6 | |||||
| 7 | |||||
| 8 | |||||
| 9 | |||||
| 10 | |||||
| 11 | |||||
| 12 | |||||
| 13 | |||||
| 14 | |||||
| 15 | |||||
| 16 | |||||
| 17 | |||||
| 18 | |||||
| 19 | |||||
| 20 | |||||
| (e): [Fe/H] = 0.58 | |||||
| 2 | |||||
| 3 | |||||
| 4 | |||||
| 5 | |||||
| 6 | |||||
| 7 | |||||
| 8 | |||||
| 9 | |||||
| 10 | |||||
| 11 | |||||
| 12 | |||||
| 13 | |||||
| 14 | |||||
| 15 | |||||
| 16 | |||||
| 17 | |||||
| 18 | |||||
| 19 | |||||
| 20 | |||||
| Color | |||
|---|---|---|---|
| 3.57 | 3.36 | 6.11 | |
| 2.06 | 1.78 | 4.31 | |
| 1.23 | 0.93 | 3.07 | |
| 0.93 | 0.70 | 1.73 | |
| 0.34 | 0.19 | 1.00 |
| Object | |||||
|---|---|---|---|---|---|
| NGC221/M32 | 4.50 | 3.25 | 0.05% | 9.8% | 3.37 |
| NGC224/M31 | 3.46 | 3.73 | 0.12% | 39% | 4.30 |
| NGC4552/M89 | 2.32 | 3.12 | 0.36% | 65% | 4.25 |
| NGC4649/M60 | 2.20 | 3.27 | 0.40% | 82% | 5.16 |
| Stellar GroupaaGroup mean spectra from Fanelli et al. (1992) | Percentage V-Light |
|---|---|
| F5-7 V | 10.8% |
| F8-9 V | 7.4% |
| G0-5 V | 8.2% |
| G6-9 V | 2.9% |
| K0-1 V | 3.1% |
| K2-3 V | 1.5% |
| K5-M0 V | 3.2% |
| F2-7 IV | 3.1% |
| G0-2 IV | 3.9% |
| G5-8 IV | 4.1% |
| G8-K1 IV | 9.0% |
| G5-K0 III | 6.0% |
| K0-1 III | 12.4% |
| K2 III | 11.2% |
| K3 III | 3.4% |
| K4-5 III | 2.6% |
| K7-M3 III | 7.2% |