Variable Yellow and Red Stragglers in the
Old Open Cluster NGC 6791
Janusz K a l u z n y
Copernicus Astronomical Center, Bartycka 18, 00-716 Warszawa, PL
e-mail: jka@camk.edu.pl
ABSTRACT
Two sets of archive time series observations of an old open cluster NGC 6791 were re-analysed using an image subtraction technique. We report identification of four new variables. Proper motion data are available for three of them and indicate that they are likely cluster members. Photometry of these stars is discussed along with the data for two earlier identified variables. The sample analysed includes one yellow and three red stragglers. An eclipsing red straggler V9 is of particular interest. Cluster membership of this RS Cvn type binary would imply that its cooler component is in a stage of thermal inequilibrium. One of variables is a K type red giant showing low-amplitude variability with a period of about 0.33 d.
1 Introduction
With an age estimated at 8 Gyr (Chaboyer et al. 1999) a mass exceeding 4000 m⊙ (Kaluzny & Udalski 1992) and metallicity (Worthey & Jowett 2003) the stellar cluster NGC 6791 may be considered as an intermediate object between old open clusters and globular clusters from the bulge region of the Galaxy. The cluster hosts two cataclysmic variables (Kaluzny et al. 1997) and is known to possess a bimodal horizontal branch with about 1/3 of HB stars located on the blue horizontal branch (Kaluzny & Udalski 1992; Liebert, Saffer & Green 1994).
There are a total of 74 known variable stars in the field of NGC 6791. They were identified by Kaluzny and Rucinski (1993; hereafter KR), Rucinski Kaluzny & Hilditch (1996; hereafter RKH) and by Mochejska et al. (2002; 2003). In particular, the paper by Mochejska et al. (2002) reports first results of a large survey aimed at detection of possible planetary transients in the cluster stars. The field of massive search for planetary transients started with a survey of 47 Tuc conducted by Gilliliand et al. (2000) using the HST. Recently the OGLE group reported detection of 121 stars with transiting low surface brightness companions (Udalski et al. 2002; Udalski et al 2002a; Udalski et al 2002b). So far one of these companions was confirmed to be a body of planetary mass (Konacki et al. 2003).
In this paper we present re-analysis of the data already used in KR and RKH. New time series photometry was extracted using an image subtraction technique. The main motivation for undertaking that job was an attempt to detect some possible planetary transients. It was also expected that a new precise photometry may lead to detection of some new variables in the cluster field.
2 Observing material and data reductions
The first data set used in this contribution was collected with the 1-m Jacobus Kapteyn Telescope during 14 consecutive nights in July 1995. Most of the data were taken during bright time. The instrument was a CCD camera giving a scale of 0.331 arcsec per pixel. A total of 619 and 154 frames were collected in the and bands, respectively. The exposure time was set to 5 min for all images. In the present analysis we used 579 and 139 best seeing frames for and filters, respectively. Median seeing for that subset of data was 1.16 arcsec for the band and 1.09 arcsec for the band.
The second data set was obtained on four consecutive nights in October 1991 using 0.9-m telescope at the Kitt Peak National Observatory. The instrument was a CCD camera giving a scale of 0.68 arcsec per pixel. The cluster was monitored for a total of about 16 hours. Present analysis is based on 61 and 8 images for the and bands, respectively. The median seeing for the band was 1.77 arcsec and the exposure time was equal to 10 min for all frames. Exposures in the band lasted 15 min.
More details on both data sets used in this paper are given in RKH and KR.
Photometry was extracted using the image subtraction package ISIS V2.1 (Alard & Lupton 1998; Alard 2000). For each of the 4 filter and data-set combinations a reference image was constructed by combining several individual best seeing images. Daophot/Allstar package (Stetson 1987) was then used to get instrumental profile photometry for stellar objects detectable on reference images. Subsequently differential light curves expressed in ADU were derived with the ISIS routine for all these stars. Finally, the light curves were converted from ADU to the instrumental magnitudes defined by the profile photometry extracted from the reference images. At that point we used the procedure which is described in detail in Mochejska et al. (2002).
Transformation to the standard BVI system was performed based on a set of local standards defined in the cluster field by Stetson (2000). For the KR data set usage of a total of 592 local standards resulted in the following transformations:
| (1) | |||
| (2) | |||
| (3) |
For the RKH data set usage of 399 local standards lead to relations:
| (4) | |||
| (5) | |||
| (6) |
Time series photometry obtained for the band was the subject of analysis aimed at detection of variable objects. First all light curves were searched for presence of periodic signal using the TATRY program provided kindly by Dr. Schwarzenberg-Czerny. That program makes use of a multiharmonic periodogram method which is described in Schwarzenberg-Czerny (1996). It is capable of finding different types of periodic variables but is most suitable for detection of objects showing continuous changes of luminosity. To search for possible eclipsing binaries we used the method introduced recently by Kovács et al. (2002). It is particularly suitable for detection of shallow and/or narrow eclipses which can be potentially due to planetary transients.
We have identified a total of 4 new variables in the RKH data set. One of them, V76, was identified independently in the KR data set. All variables reported in RKH and KR were recovered. We have failed to detect any candidates for planetary transients. Equatorial coordinates of new variables are listed in Table 1. The transformation from rectangular to equatorial coordinates was derived using 375 stars from the USNO A-2 catalog (Monet et al. 1998) which were located in the -band reference image for RHK data set. We present finder charts for the newly discovered variables in Fig. 1.
In Fig. 2 we present a plot of the standard deviation versus the average magnitude for all light curves extracted from the RKH data set. One may note that for the brightest stars the achievable precision is about 0.004 mag and the reaches 0.01 mag at .
![[Uncaptioned image]](/html/astro-ph/0303405/assets/x1.png)
Fig. 1. Finder charts for the four newly detected variables. Each chart is 33 arcsec on a side, with east to the left and north up.
![[Uncaptioned image]](/html/astro-ph/0303405/assets/x2.png)
Fig. 2. Standard deviations of the light curves versus the average magnitudes for stars in the field of NGC 6791 (RKH data set).
T a b l e
1
Equatorial coordinates of newly identified binaries
| ID | RA (J2000) [deg] | DEC (J2000) [deg] |
|---|---|---|
| V75 | 290.19982 | 37.76635 |
| V76 | 290.20778 | 37.76416 |
| V77 | 290.22046 | 37.77693 |
| V78 | 290.24108 | 37.78527 |
3 Properties of variables
In Table 2 we provide some information about basic photometric properties of four newly identified variables. The sample is supplemented with the data for two earlier identified objects, V9 and V17, which will be discussed below. Columns 2, 3 and 4 list maximal magnitude and average colors. The full range of observed luminosity changes is listed in columns 5 and 6 for the and band, respectively. Derived periods along with their errors are listed in column 7. The last column of Table 2 gives cluster membership probabilities extracted from an unpublished proper motion study conducted by Dr. Kyle Cudworth. Five variables are likely members of NGC 6791 while for one of them, V75, proper motion data are not available.
T a b l e
2
Photometric data and membership probability for
NGC 6791 variables
| ID | P [d] | MP[%] | |||||
|---|---|---|---|---|---|---|---|
| V9 | 17.25 | 1.40 | 1.22 | 0.23 | 0.16 | 3.187085(2) | 82 |
| V17 | 17.915 | 1.267 | 1.15 | 0.091 | 0.060 | 6.20(5) | 88 |
| V75 | 17.374 | 0.987 | 0.92 | 0.032 | 0.017 | 11.34(15) | - |
| V76 | 18.226 | 1.140 | 1.02 | 0.094 | 0.066 | 4.19(2) | 97 |
| V77 | 16.674 | 0.953 | 0.89 | 0.014 | 0.014 | 7.7(1) | 80 |
| V78 | 15.526 | 1.354 | 1.33 | 0.009 | - | 0.332(3) | 94 |
Figure 3 shows location of all variables in the and color magnitude diagrams of the cluster field. Positions marked correspond to and average color of variables.
Time domain light curves of V17 and V75-77 are shown in Fig. 4. Phased light curve of V78 is presented in Fig. 5. All light curves are based on the RKH data set.
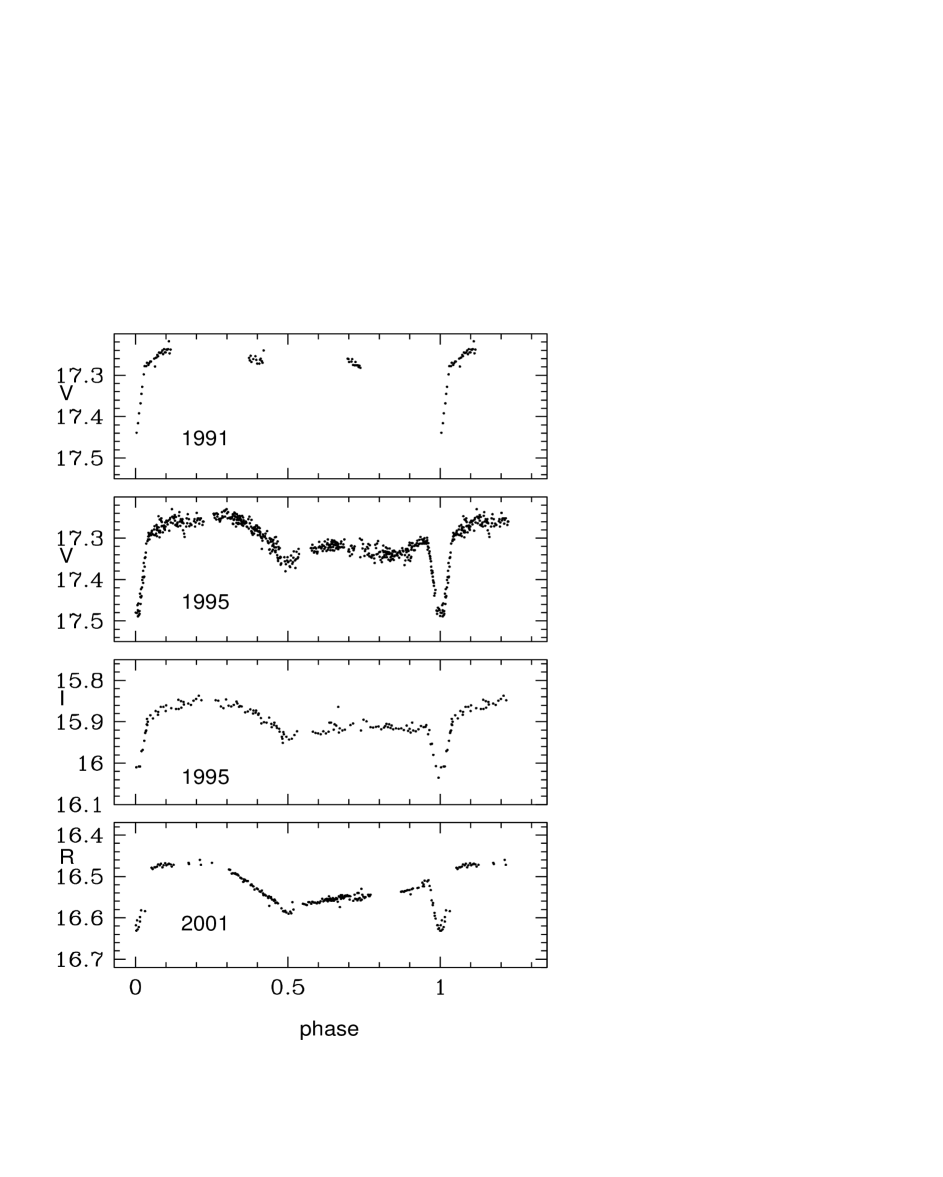
In Fig. 6 we present phased light curves of V9 obtained in 1991 (KR data set), 1995 (RKH data set) and 2001 (Mochejska et al. 2002) seasons. Phased color curve of V9 from the 1995 season is shown in Fig. 7.
V75 is located slightly to the red of the cluster main sequence tip on the color-magnitude diagram. Its 1995 light curve shows sine-like modulation with d and . The data from the 1991 season (KR data set) give the light curve with nightly averaged magnitudes from the range . The stars may belong to ellipsoidal variables which would imply an orbital period of about 22.7 days. Presence of ellipsoidal variability in case of such long orbital period is conceivable only if V75 is composed of a slightly evolved star and a dark companion with a mass exceeding significantly mass of the cluster turnoff stars.***For the binary composed of two turnoff stars and with d ellipsoidal variability would be much smaller than it is observed. Another possibility is that V75 belongs to diverse class of ”spotted variables”.
V78 is located on the red giant branch
about 2 magnitudes above the turn-off region of the cluster.
The proper motion data indicate cluster membership with
propbability of 94%. The derived period
d is an alias of a 1 day period and the power spectrum
of the light curve has a prominent peak also at d.
Unfortunately, in the KR data
set the star was located close to a bad column on most images which
prevented derivation of its light curve. We also did not manage
to extract the band light curve from the 1995 data as
the variable was overexposed on all images in that filter. Images in
the -band were free from that problem. The value of the color
listed for the variable in Table 2 was adopted from Stetson (2000).
Photometric variability at the 0.01 mag level is quite common among
field giants of spectral type G-K. Henry et al. (2000) detected
variability on time scales from 2 days to a few week weeks in a total of 81
objects from a sample including 187 stars. Observed changes of luminosity
were explained by presence of radial pulsations.
Edmonds and Gilliland (1996) detected 15 K giant variables
in the globular cluster 47 Tuc. Observed changes
had amplitudes 0.005-0.015 mag in the band and periods between
about 2 and 4 day. As a likely cause of variability the authors considered
radial or nonradial pulsations.
However, variability on a time scale shorter that 1 day was reported
so far for a very few giants. Hatzes & Cohran(1994) reported Oph
to exhibit multiperiodic radial velocity variations with a period
of about 0.25 day.
Observed amplitudes of radial velocity
correspond to predicted photometric variablity at the level of a
few mmag at best. Similarly, radial velocity variations with
periods of the order of hours detected in Boo (Kjeldsen et al.
2002) and in Hya (Frandsen et al. 2002) imply photometric effects
at the magnitude level. Both mentioned giants show supposedly
solar-like oscillations.
In that context V78 may prove to be very a interesting object but
follow-up observations are needed to confirm detected variability
and to establish its period with confidence.
V77 is a likely yellow straggler member of the cluster. The light curve shows sine-like modulation with the period of about 7.7 d and low amplitude. Variability of V77 can be explained by an ellipsoidal effect in a binary system or alternatively by ”spots” related activity.
3.1 Variable red stragglers
Variables V9, V17 and V76 are all likely cluster members and moreover they can be classified as red stragglers. The term ”red straggler” is used to denote objects located to the red of the main sequence or subgiant branch on color-magnitude diagrams of old stellar clusters. They should not be confused with ordinary binary members of clusters which are also observed to the red of main sequences. Red stragglers may be defined as objects whose position in the red part of the color magnitude diagram of a parent cluster cannot be reproduced by combining light of two ordinary stars from principal sequences. Variable red stragglers were identified in 47 Tuc by Albrow et al. (2001) and more recently by Mathieu et al. (2003) in M67. Both red stragglers in M67 are binary stars. Also an optical counterpart of the binary millisecond pulsar PSR J1740-5340 in NGC 6397 (Ferraro et al. 2001) is an example of a red straggler.
V9 is the only red straggler from NGC 6791 which is certainly
a binary star. Its light curves from 1991 (KR data set), 1995
(RKH data set) and 2001 (Mochejska et al. 2002) seasons are shown in Fig. 6.
The color curve obtained in 1995 is presented in Fig. 7.
The light curves were phased
using an ephemeris:
which is based on moments of 3 individual primary minima.
These minima span the period from 1991 to 2001 and are listed
in Table 3.
T a b l e
3
Moments of primary minima of V9
| T[HJD] | E | |
|---|---|---|
| 244 8540.60 | 0.01 | 0 |
| 244 9920.571 | 0.001 | 433 |
| 245 2106.9259 | 0.0003 | 1119 |
The 1995 and 2001 light curves of V9 phased with the new ephemeris clearly show the presence of a shallow secondary eclipse centered at phase . They also exhibit significant asymmetry. The maximum following the primary eclipse is higher that that following the seacondary eclipse. The disturbed shape of the light curve precludes determination of geometrical elements of the binary by means of a standard light curve solution. The color curve from the 1995 season shows noticeable dips during both eclipses. This is quite an unusual behavior as in most eclipsing binaries the observed color becomes bluer at the secondary eclipse. At the primary eclipse the observed color of V9 is . This value sets a lower limit on the color of the cooler component of the system and places it at least 0.25 mag to the red of the cluster subgiant branch (see Fig. 3). If the binary is indeed a member of the cluster then we may infer that its secondary is in stage of thermal inequilibrium.
Large and variable asymmetry of the light curve of V9 (see Fig. 6) is most likely due to occurrence of starspots on the surface of the cooler component of the binary. Profound spot activity is very often observed in close binaries composed of red subgiants (or giants) and main sequence stars. That class of variable stars in known as RS CVn type binaries. Light curves of RS CVn binaries occasionally show disturbances reaching a few tenths of magnitude in the band (Padmakar & Pandey 1999).
V17 shows light variations with period d. The 1995 season light curve is slightly asymmetric with some kind of a ”bump” occuring about 1 day before the minimum light. The full range of magnitudes diminishess from 0.091 in the -band to 0.069 in the -band. The light curve in the -band obtained in 2001 by Mochejska et al. (2001) shows also sine-like shape but with different kind of asymmetry than is observed in our data from the 1995 season. There is no indication of any detectable change of period of variability between the 1995 and the 2001 seasons. If the variable is indeed a member of the cluster then it is difficult to explain its position on the color-magnitude diagram without postulating that it is a binary whose evolution was affected by some mass transfer between components. We note that V17 resembles S1113 in M67 (Mathieu et al. 2003) in respect of position on the color magnitude diagram of the parent cluster as well as a character of observed luminosity changes. To explain variability of S1113 Mathieu et al. (2003) postulated that they are due to combined effects of ellipsoidality and stellar spots. These two effects allow to explain also characteristic of the light curves of V17 and in particular their asymmetry and season-to-season changes of shape.
V76 shows light variations with the period d. For the 1995 season the full range of magnitudes changes from 0.094 in the -band to 0.066 mag in the -band. The variable is located above an apparent sequence of photometric binaries visible on both presented color-magnitude diagrams. Its -band light curve for the 1991 season (KR data set) is shown in Fig. 8. During that season the average magnitude of the variable was what can be compared with observed in the 1995 season. We would like to note that the variable possesses close visual companion at distance arcsec. This companion has , and .
4 Summary
In this paper we have discussed photometry of six variables
from the central field of the old open cluster NGC 6791.
All but one of them can be considered very likely cluster members
based on their observed proper motions. The sample includes three
red stragglers. Their location on the cluster color-magnitude
diagram is hard to explain without postulating that they
are evolved close binaries. In fact, variable red straggler V9
is an eclipsing close binary. Hypotheses about the
binary nature of red stragglers V17 and V76 could be tested
by obtaining suitable spectrosopic observations.
For the red giant variable V78, our data indicate modulation
of the light curve with a period of about 0.33 day and an amplitude
of about 0.005 mag in the band. This interesting object
seems to be an attractive target for further observations.
The yellow straggler V77 shows modulation of the light curve
with a period of about 7.7 days.
Acknowledgments. This work was supported with NSF grant AST-9819787 and polish KBN grant 5P03D004.21. We are very grateful to Dr. Kyle Cudworth for providing us with the proper motion data for NGC 6791. We would also like to thank an anonymous referee, for a prompt and useful report.
REFERENCES
-
Alard, C., & Lupton, R. 1998, Astrophys. J., 503, 325.
-
Alard, C. 2000, Astron. Astrophys. Suppl. Ser., 144, 363.
-
Albrow, M. D. et al. 2000, Astrophys. J., 534, 894.
-
Chaboyer, B., Green, E. M., & Liebert, J. 1999, Astron. J., 117, 1360.
-
Edmonds, P. D., & Gilliland, R. I. 1996, Astrophys. J., 464, L157.
-
Ferraro, F. R., Possenti, A., D’Amico, N., & Sabbi, E. 2001, Astrophys. J., 561, L93.
-
Frandsen, S. et al. 2002, Astron. Astrophys., 349 , L5.
-
Gilliland, R. L. et al 2000, Astrophys. J., 545 , L47 .
-
Hatzes, A. P., & Cohran, W. D. 1994, Astrophys. J., 432 , 763 .
-
Henry, G. W., Fekel, F. C., & Henry, S. M. 2000, Astrophys. J. Suppl. Ser., 130 , 201 .
-
Kaluzny, J., & Udalski, A. 1992, Acta Astron., 42 , 29 .
-
Kaluzny, J., & Ruciński, S. M. 1993, MNRAS, 265 , 34 .
-
Kaluzny, J., Stanek, K. Z., Garnavich, P. M. & Challis, P. 1997, Astrophys. J., 491 , 153 .
-
Kjeldsen, H. et al 2002, IAU Coll. No. 185, eds. C. Aerts, T.R. Bedding, &J. Christensen-Salsgaard, ASP Conference Proceedings, p. 470.
-
Konacki, M., Torres, G., Jha, S., & Sasselov, D. D. 2003, Nature, 421, 507.
-
Kovács, G., Zucker, S., & Mazeh, T. 2002, Astron. Astrophys., 391, 369.
-
Liebert, J., Saffer, R. A., & Green, E.M. 1994, Astron. J., 107 , 1408 .
-
Mathieu, R. D, van den Berg, M., Torres, G., Latham, D., Varbunt, F., & Stassun, K. 2003, Astron. J., 125, 246.
-
Mochejska, B. J., Stanek, K. Z., Sasselov, D. D., & Szentgyorgyi, A. H. 2002, Astron. J., 123, 3460.
-
Mochejska, B. J., Stanek, K. Z., & Kaluzny, J. 2003, AJ, in press (astro-ph/0303002).
-
Monet, D., et al. 1998, USNO-A2.0, U.S. Naval Observatory, Washington DC.
-
Padmakar, & Pandey, S. K. 1999, Astron. Astrophys., 138, 203.
-
Ruciński, S. M., Kaluzny, J., & Hilditch, R. W. 1996, MNRAS, 282, 705.
-
Schwarzenberg-Czerny, A 1996, Astrophys. J., 460 , L107 .
-
Stetson, P. B. 1987, P.A.S.P., 99 , 191.
-
Stetson, P. B. 2000, P.A.S.P., 112, 925.
-
Udalski, A. et al. 2002, Acta Astron., 52, 1.
-
Udalski, A. et al. 2002a, Acta Astron., 52 , 115 .
-
Udalski, A. et al. 2002b, Acta Astron., 52 , 317 .
-
Worthley, G., & Jowett, K. J. 2003, P.A.S.P., 115 , 96 .