ACCELERATION OF COSMIC RAYS AT COSMIC SHOCKS
Abstract
Nonthermal particles can be produced due to incomplete thermalization at collisionless shocks and further accelerated to very high energies via diffusive shock acceleration. In a previous study we explored the cosmic ray (CR) acceleration at cosmic shocks through numerical simulations of CR modified, quasi-parallel shocks in 1D plane-parallel geometry with the physical parameters relevant for the shocks emerging in the large scale structure formation of the universe (Kang & Jones 2002). Specifically we considered pancake shocks driven by accretion flows with and the preshock gas temperature of K. In order to consider the CR acceleration at shocks with a broader range of physical properties, in this contribution we present additional simulations with accretion flows with and K. We also compare the new simulation results with those reported in the previous study. For a given Mach number, shocks with higher speeds accelerate CRs faster with a greater number of particles, since the acceleration time scale is . However, two shocks with a same Mach number but with different shock speeds evolve qualitatively similarly when the results are presented in terms of diffusion length and time scales. Therefore, the time asymptotic value for the fraction of shock kinetic energy transferred to CRs is mainly controlled by shock Mach number rather than shock speed. Although the CR acceleration efficiency depends weakly on a well-constrained injection parameter, , and on shock speed for low shock Mach numbers, the dependence disappears for high shock Mach numbers. We present the “CR energy ratio”, , for a wide range of shock parameters and for at terminal time of our simulations. We suggest that these values can be considered as time-asymptotic values for the CR acceleration efficiency, since the time-dependent evolution of CR modified shocks has become approximately self-similar before the terminal time.
I INTRODUCTION
Collisionless shocks form ubiquitously in astrophysical environments via collective electromagnetic viscosities, when supersonic disturbances propagate into tenuous, magnetized, cosmic plasmas. Due to incomplete plasma thermalization at collisionless shocks, some suprathermal particles leak upstream and their streaming motions against the background fluid generate strong MHD Alfvén waves upstream of the shock (e.g., Wentzel 1974; Bell 1978;Lucek & Bell 2000). Although these self-excited MHD waves provide necessary electromagnetic viscosities to confine thermal particles to the downstream region of the shock, some suprathermal particles in the high energy tail of the Maxwellian velocity distribution may re-cross the shock upstream. Then these particles are scattered back downstream by those same waves and can be accelerated further to higher energies via Fermi first order process. Here we refer to cosmic rays as nonthermal particles above the Maxwellian distribution in momentum space, so they include nonrelativistic, suprathermal particles as well as usual relativistic particles. It is believed that cosmic ray particles are natural byproducts of the collisionless shock formation process, and they are extracted from the shock-heated thermal particle distribution (Malkov & Völk 1998, Malkov & Drury 2001).
According to diffusive shock acceleration (DSA) theory, a significant fraction of the kinetic energy of the bulk flow associated with a strong shock can be converted into CR protons, depending on the CR injection rate (e.g., Drury 1983; Berezhko, Ksenofontov, & Yelshi 1995; Kang & Jones 1995). In Gieseler, Jones & Kang (2000), we developed a numerical scheme that self-consistently incorporates a “thermal leakage” injection model based on the analytic, nonlinear calculations of Malkov (1998). This injection scheme was then implemented into the combined gas dynamics and the CR diffusion-convection code with the Adaptive Mesh Refinement technique by Kang, Jones & Giesler (2002). In Kang & Jones (2002) (Paper I, hereafter) we applied this code to study the cosmic ray acceleration at shocks by numerical simulations of CR modified, quasi-parallel shocks in 1D plane-parallel geometry with the physical parameters relevant for the cosmic shocks emerging in the large scale structure formation of the universe. We adopted the Bohm diffusion model for CRs, based on the hypothesis that strong Alfvén waves are self-generated by streaming CRs. We found in Paper I that about of incoming thermal particles are injected into the CR population with our thermal leakage injection model and up to 60 % of initial shock kinetic energy is transferred to CRs for strong shocks.
During the formation of large scale structure in the universe cosmic shocks are produced by flow motions associated with the gravitational collapse of nonlinear structures (e.g., Kang et al. 1994a; Miniati et al. 2000). These structures are surrounded by accretion shocks and CRs can be accelerated to very high energies at these shocks via the first order Fermi process (Kang, Ryu & Jones 1996, Kang, Rachen, & Biermann 1997, Miniati et al. 2001a, b). In a recent study, Ryu, Kang, Hallman, & Jones (2003) studied the characteristics of cosmic shocks in a cosmological hydrodynamic simulation of a CDM universe and their roles on thermalization of gas and acceleration of nonthermal particles. They showed that cosmic shocks have a wide range of physical parameters with shock speed up to , the preshock temperature of , and Mach number up to a few 100. In this contribution we extend our study in Paper I by including simulations of shock models with a broader range of physical parameters that are relevant for such cosmic shocks.
In the next section we briefly describe our numerical simulations. The simulation results are presented and discussed in §III, followed by a brief summary in §IV.
II Numerical Simulations
(a) Numerical Methods
Our numerical code was described in detail in Paper I, so here we briefly summarize some special features that are different from standard hydrodynamics codes: 1) We solve the gasdynamic equations with CR pressure terms added in the conservative, Eulerian formulation for one dimensional plane-parallel geometry along with the diffusion-convection equation for the CR momentum distribution function (Kang et al. 2001). 2) An adaptive mesh refinement technique is applied to shock fronts that are tracked as discontinuous jumps by a front-tracking method (Kang et al. 2001). 3) An additional equation for the “Modified Entropy” is solved to follow accurately the adiabatic changes outside of shocks, particularly in the precursor region (Kang et al. 2002). 4) We adopt an injection scheme based on a “thermal leakage” model that transfers a small proportion of the thermal proton flux through the shock into low energy CRs (Gieseler et al. 2000). There is a free parameter in the adopted injection model: , defined to measure the ratio of the amplitude of the postshock MHD wave turbulence to the general magnetic field aligned with the shock normal, (Malkov and Völk, 1998). This parameter is rather well constrained, since is indicated for strong shocks (Malkov & Völk 1998). However, such values lead to very efficient initial injection and most of the shock energy is transfered to the CR component for strong shocks of (Kang et al. 2002), causing a numerical problem at the very early stage of simulations. So in this study we consider models with and 0.3 and then discuss how the CR acceleration depends on .
(b) Diffusion Coefficient, Time, and Length Scales
As in Paper I we assume a Bohm type diffusion model in which the diffusion coefficient is given as
| (1) |
where is expressed in units of , , and is the magnetic field strength in units of microgauss. This assumption is based on the hypothesis that strong Alfvén waves are self-generated by streaming CRs and provide random scatterings strong enough to scatter particles within one gyration radius. In order to model amplification of self-generated turbulent waves due to compression of the perpendicular component of the magnetic field, the spatial dependence of the diffusion is modeled as , where is the upstream gas density.
With the Bohm diffusion model the mean acceleration time scale for a particle to reach momentum is related to the diffusion coefficient and shock speed as
| (2) |
where and is shock speed in units of . Although this expression is valid for strong shocks, it gives a reasonable estimate for any shock strength within a factor of a few (see Paper I). The so-called diffusion length of CR protons is given by
Thus, for a given value of , the CR acceleration proceeds faster and CR particles diffuse on smaller length scales at shocks with greater speeds. Consequently, it is more convenient to normalize the simulation variables in terms of a diffusion time, , and a diffusion length, (where is a characteristic velocity in the problem), rather than adopting constant values across different models. They represent the diffusion length and time scales for the protons of . In our discussion a choice of (or ) is arbitrary, since we focus on the CR acceleration efficiency at time asymptotic limits.
(c) 1D Plane-parallel Shock Models
In general, cosmic shocks associated with the large scale structure formation can be oblique and have various geometries, depending on types of nonlinear structures onto which accretion flows fall. As in Paper I, however, we study the CR acceleration at one-dimensional (1D) quasi-parallel shocks which form by accretion flows in a plane-parallel geometry in this paper. Since our simulations follow the acceleration of CRs up to only mildly relativistic energies, the diffusion length scales are much smaller than typical curvature radius of cosmic shocks. So, the diffusion and acceleration of CRs can be studied with 1D plane-parallel shock models.
We consider a pancake shock formed by a steady accretion flow with a constant density and gas pressure: a 1D simulation box with [0, ] and an accretion flow entering into the right boundary of the simulation box with a constant density, , gas pressure, , and velocity, . There are no pre-existing CRs in the accretion flows. The accretion flow Mach number is defined by , where is the sound speed of the accreting gas. The flow is reflected at the left boundary () and a shock propagates to the right. For a hydrodynamic shock without the CR pressure, the shock speed is in the simulation frame and in the far upstream rest frame, where is the compression ratio across the shock. For the accretion Mach number, , the initial shock speed ranges before the CR pressure is built up. So the initial shock Mach number is given by . After we include the CR acceleration, the CR pressure feedback slows down the shock, so the instantaneous shock speed, , in the far upstream rest frame decreases over time. A CR modified shock consists of a smooth precursor and a subshock, since CRs diffuse upstream of the subshock, and the CR pressure decelerates and heats the preshock flow adiabatically, resulting in weakening of the subshock.
(d) Constant versus Constant Models
In Paper I we considered a set of models in which the infall speed was fixed at , while the preshock temperature was varied according to , where the accretion flow Mach numbers in the range of were considered. So, in Paper I we calculated CR modified shocks with different preshock temperature but with the same accretion speed. We will call this group of models “constant ” models, which was designed to study shocks with a wide range of the preshock temperature and a canonical velocity inside intracluster medium of galaxy clusters.
In this paper we consider accretion flow models with a same preshock temperature at but with different shock speeds according to
| (3) |
which will be referred as “constant ” models. This set of the constant model is designed to understand the CR acceleration at shocks that have a same preshock temperature but a wide range of shock velocity. The preshock temperature is chosen to represent the mean temperature of the photoionized plasma after reionization of intergalactic medium at (Gnedin 2000). We consider models with , corresponding to . The model with of the constant models is identical to that of the constant models presented in Paper I, so not considered here.
(e) Normalization of Physical Variables


Ideal gasdynamic equations in 1D planar geometry do not contain any intrinsic time and length scales, but in CR modified shocks the CR acceleration and the precursor growth develops over the diffusion time on diffusion length scales. So, there are intrinsic similarities in the dynamic evolution and structure of two CR shock models with a same Mach number but with different preshock temperature or with different shock speeds, if we present the results in the coordinate system normalized with diffusion scales ( and ).
As in Paper I we set the far upstream density and flow values as , in code units for all models, where and are normalization constants for the gas density and the flow speed, respectively. The normalization constants depend on the accretion Mach number as follows: and so . Thus the length and time scales depend on according to and , respectively, with an arbitrary choice of diffusion coefficient, . The gas density normalization constant, , is arbitrary as well, but the pressure normalization constant depends on as . Throughout the paper and in the code physical variables are given in units of the normalization constants, , , , , and .
The models with smaller have smaller shock speeds and lower postshock temperature, so typical shock thickness, which is of order of gyro radius of the thermal protons, is smaller than that of the models with larger . Since an effective numerical shock thickness is the grid spacing at the finest grid level, for low models, the required grid spacing in current simulations is much smaller than that of Paper I. The new simulations are carried out on a base grid with using additional grid levels, so at the finest grid level. This leads to a severe requirement of computation time, so we run the simulations for , much shorter time than that of Paper I, . The simulated space is and zones are used on the base grid. The number of refined zones around the shock is on the base grid and so there are zones on each refined level. To avoid technical difficulties, the multi-level grids are used only after the shock propagates away from the left boundary at the distance of . After the shock moves to (at for strong shocks), the AMR technique is turned on and the CR injection and acceleration are activated. This initial delay of the CR injection and acceleration should not affect the final outcomes. For all models we use 230 uniformly spaced logarithmic momentum zones in the interval As in our previous studies, the function is evolved instead of and is used instead of the momentum variable, for that step.
III RESULTS
Since the CR acceleration is mainly determined by velocity jump across the shock (i.e., ), which is a function of shock Mach number only, we expect two models with the same Mach number but with different may have qualitatively similar results, when expressed in terms of diffusion scales. The main difference between the two models is the “effective ” injection momentum, . Here the “effective ” injection momentum refers to a mean value of the momentum range over which thermal leakage takes place (Gieseler et al. 2000). The diffusion coefficient of injected, nonrelativistic CRs, for , has different momentum dependence from that of relativistic CRs, for . So the similarity between the two models could be broken at early evolutionary stages when the CR pressure is still dominated by nonrelativistic particles. We attempt to make comparisons of such two models in this section.
(a) Modified Shock Structure
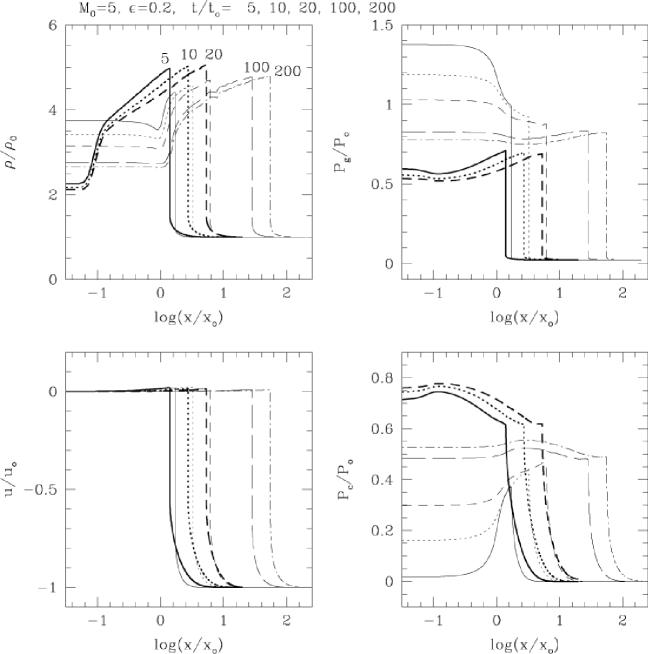
We show the time evolution of the shock driven by the accretion flow with and at 10, 20 in Figure 1 (heavy lines). The model with and from Paper I is also shown at 10, 20, 100 and 200 (light lines). As discussed in the previous section, the results are presented in two different sets of physical coordinates, so, for example, the ratio of diffusion length scales between two model is . Since we integrate the model with up to when nonrelativistic particles still contribute significantly to the CR pressure, we expect to see some differences in the two models before that time. First of all, in the model with , CR particles are injected at much lower injection momenta and their acceleration time scales in units of are shorter. So the CR pressure increases faster and the modification to the flow structure due the CR pressure occurs earlier, compared to the model with . In both models a substantial precursor develops upstream of the shock, resulting in a significant modification of flow structure. Also, the shock structures seem to have reached approximate time-asymptotic states by the terminal time of both simulations ( for model and for model). Once the postshock CR pressure becomes constant, the shock structure evolves approximately in a “self-similar” way, because the scale length of shock broadening increases linearly with time. By comparing the shock structures at the terminal times, we expect that the overall evolution and shock structure would approach to time asymptotic states that are similar for the two models.
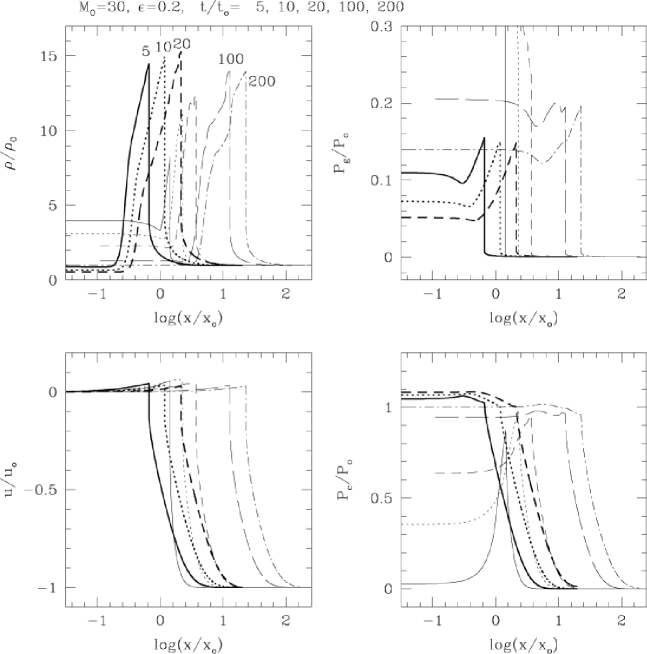
In Figure 2 we make the similar comparison between the two models with and for strong shocks driven by the accretion flow with . Due to stronger nonlinear feedback effects, the overall shock structure displays greater differences at a given value of , compared to the models with . For example, distances of the shock from the reflecting plane are different and the gas and CR pressure have very different profiles before . However, the time asymptotic values of the CR pressure become similar at the terminal times of the two models.
Figure 3 shows the shock structure of the constant models with different at the terminal time (). Here the spatial coordinate is shifted so the shock is located at for all models. The degree of nonlinear modification and density enhancement are greater in models with higher due to the higher CR pressure, so the distance of the shock from the reflecting plane (the leftmost point) is smaller. The CR pressure seems to converge to a limiting value of , where is the initial shock speed before the CR modification slows down the shock. The effects of nonlinear feedback such as the preshock deceleration and the compression through the total shock transition can be compared most clearly in the flow velocity plot.
(b) Particle Distribution Function

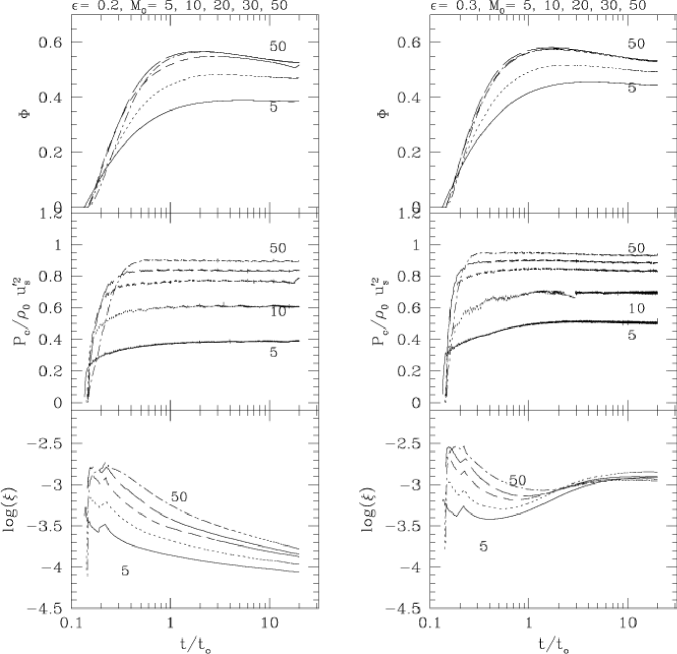
Figure 4 shows the evolution of the particle distribution functions (including both thermal and nonthermal populations) at the shock (i.e., ) for two sets of models ( and ) shown in Figures 1-2. In addition to the usual form of distribution function, , we also plotted to show the differential number density of CRs in logarithm momentum bin, . In fact represent the differential energy density of CRs in logarithm momentum bin, for relativistic momenta (). First we note that peak momentum of thermal distribution is lower for the lower postshock temperature, so the particle injection starts at lower injection momenta in the models with lower . For the model with and , we can see that the Maxwellian distribution shifts to lower momenta as the postshock temperature diminishes due to energy transfer to CRs. For other models this adjustment happens well before , so the postshock thermal distribution is almost steady after that time.
We identify as the momentum above which drops sharply, characterizing the effective upper cutoff in the CR distribution. This momentum is approximately related to the age of the shock in units of the diffusion time as for . This explains why values of are similar at a given value of for all models, regardless of , injection momentum, or shock Mach number. In comparison of the two models with a same , the one with lower injects CRs at lower momenta, so, for example, for , while for . Just above the injection pool, the distribution function changes smoothly from the thermal distribution to an approximate power-law whose index is close to the test-particle slope for the subshock, i.e., (where is the compression ratio across the subshock). The distribution function shows the characteristic “concave upwards” curves reflecting modified shock structure (including the precursor) for all models. Although the distribution function at a given momentum is larger in the higher models, but the ratio of is larger in lower models. This leads to slightly greater nonlinear feedback in lower model, resulting in more concave curves.
Figure 5 shows the total CR distribution within the simulation box, and its power law slope at the terminal time of three sets of simulations. The models shown in top two panels are the constant models with for 10, 20, 30, and 50. The particle momenta near are injection momenta above the thermal distribution and have similar values within a factor of two for models with different , indicating similar thermal populations. Although the postshock temperature increases with shock speed as in pure gasdynamic shocks, all models in this group have similar . This is because the postshock gas pressure falls and the postshock density increases due to nonlinear feedback to a greater extent at higher Mach number models. The integrated distributions also show the characteristic “concave upwards” curves and this “flattening” trend is stronger for higher models. The slope of the total CR spectrum ranges over near then decreases with the particle momentum and converges for strong shocks to just below . The same kind of models but with are shown in middle two panels. They show that the injection takes place at slightly lower momenta with greater numbers of particles in the Maxwellian tail for the models with larger , leading to the slope near as large as . So the CR distribution functions for models are greater than those for models for , while they are roughly similar for . One can expect that the CR pressure of these two sets of models may be different at early stage when nonrelativistic, fresh injected particles dominate the pressure, but it becomes similar once relativistic particles dominate. As in Figure 4, all models shown here have similar values of regardless of values of , since the results are shown at the same values of . The bottom two panels show the constant models from Paper I. Since for all models, the postshock temperature would be similar if these are pure gasdynamic shocks. Due to their higher degree of nonlinear modification to the structure, however, the postshock thermal populations have lower temperature in the models with higher .
Although the evolution of these shock becomes approximately self-similar and the postshock CR pressure reaches a quasi-steady value before the terminal time, CR particles continue to be accelerated to ever higher energies and so the CR distribution continues to extend to higher momenta. Thus the CR distribution functions in Figure 5 show only a snap shot at the terminal time. But they illustrate how the CR distribution deviates from the test-particle like power-law due to nonlinear feedback.
(c) Injection and Acceleration Efficiencies

As in Paper I we define the injection efficiency as the fraction of particles that have entered the shock from far upstream and then are injected into the CR distribution:
| (4) |
where is the CR distribution function, is the particle number density far upstream, is the instantaneous shock speed, and is the time when the CR injection/acceleration is turned on.
As a measure of acceleration efficiency, we define the “CR energy ratio”; namely the ratio of the total CR energy within the simulation box to the kinetic energy in the initial shock frame that has entered the simulation box from far upstream,
| (5) |
where is the initial shock speed. Since the shock slows down due to nonlinear modification, the kinetic energy flux in the instantaneous shock rest frame also decreases. So the ratio of the total CR energy in the simulation box to the kinetic energy defined in the instantaneous shock frame which has entered the shock from far upstream, i.e.,
| (6) |
can be much larger than , especially for high Mach number shocks.
Figure 6 shows the CR energy ratio, , the CR pressure at the shock normalized to the ramp pressure of the upstream flow in the instantaneous shock frame, , and the “time-averaged” injection efficiencies, , for models with different when (left three panels) and (right three panels). For all Mach numbers the postshock increases until a balance between injection/acceleration and advection/diffusion of CRs is achieved, and then stays at a steady value afterwards. The time-asymptotic value of the CR pressure becomes in the initial shock frame and in the instantaneous shock frame for with . After has reached a quasi-steady value and the evolution of the spatial distribution has become “self-similar”, the CR energy ratio also asymptotes to a constant value. Time-asymptotic value of increases with , but it converges to for and . As discussed in detail in Kang et al. (2002), the injection rate is higher for higher subshock Mach number and for larger values of , which leads to the higher CR pressure and higher . Once again, however, this dependence on becomes weaker for stronger shocks. The average injection rate is about with and with .
Figure 7 shows values of the CR energy ratio at the terminal time of three sets of simulations shown in Figure 5. Although we were able to follow CR acceleration only up to , these values can serve as estimates for the time-asymptotic CR acceleration efficiency, since seems to approach constant values after . As shown in Figure 6 the CR acceleration is more efficient for larger , so, for the constant models with , for (dotted line), while for (dashed line). The difference becomes smaller for high Mach number shocks (). The constant models have smaller for than the constant models. Due to this velocity difference, for given values of Mach number and , the constant models have slightly higher than the constant models. For the constant model with , for example, for (solid line).
IV SUMMARY
We have calculated the CR acceleration at 1D quasi-parallel shocks by using our cosmic-ray AMR Shock code (Kang et al. 2002), which incorporates the “thermal leakage” injection process to the CR/hydro code that solves the CR diffusion-convection equation along with CR modified gasdynamic equations. Our simulations have been performed in a 1D plane-parallel space in which shocks are driven by the accretion flows with and the temperature of K. Mach number of the resulting shocks ranges . We have compared the new simulation results with those from the previous study in which the accretion flows with and the temperature of K were considered (Kang & Jones 2002, Paper I).
Detailed simulation results found in Paper I remain valid, so we briefly review the main conclusions here to make the present paper self-contained.
1) Suprathermal particles can be injected very efficiently into the CR population via the thermal leakage process, so that typically a fraction of of the particles passed through the shock become CRs for .
2) For a given value of shock Mach number, the injection efficiency and the CR acceleration are higher for larger . But this dependency is weaker for higher Mach numbers of .
3) For a given value of , the acceleration efficiency increases with , but it asymptotes to a limiting value of the CR energy ratio, , for and .
4) The CR pressure seems to approach a steady-state value in a time scale comparable to the acceleration time scales for the mildly relativistic protons after which the evolution of CR modified shocks becomes approximately “self-similar”. This feature enables us to predict time asymptotic values of the CR acceleration efficiency through numerical simulations of CR shock models with a broad range of the physical parameters in this work.
5) We suggested that the CR acceleration is innate to collisionless shock formation process and CRs can absorb a significant fraction of initial shock kinetic energy.
The main purpose of this comparison study is to explore how the CR acceleration depends on the preshock temperature and shock speed as well as shock Mach number. Unlike pure gasdynamic shocks, CR modified shocks have intrinsic scales, that is, a diffusion time, , and a diffusion length, , because the mean acceleration time scale is . So the CR acceleration and the evolution of CR modified shocks proceed faster for models with higher shock speeds. On the other hand, two models with a same Mach number but with different accretion speeds should show qualitatively similar results, when the dynamical evolution is presented in terms of diffusion scales, and , since the CR acceleration is controlled mainly by the velocity jump across the shock transition, which depends on shock Mach number.
For models with lower shock speed, the mean velocity of thermal particles is smaller and so the effective injection momentum, , is smaller, compared with those for higher shock speed models. Nonrelativistic suprathermal particles () are accelerated quickly to relativistic energies because of small diffusion coefficients (). On the other hand, the highest momentum of the CR distribution increases with the age of the shock as , and so the CR distribution function extends to a similar value of at a given for all models. As a result, for the model with lower shock speed, the ratio of increases faster, nonlinear modification to the underlying flow sets in earlier, and the CR energy ratio is larger. However, we expect these differences would become smaller for when relativistic particles dominate the CR pressure. For example, for the two models with the same Mach number at and the same injection parameter at , for and for at the terminal time. For larger values of , are higher due to the higher injection rate. For example, for the model with , , and . Thus, for models with , the CR energy ratio ranges , depending on the shock speed and the injection parameter. The difference becomes smaller at higher shock Mach numbers. The CR energy ratio at the terminal time of our simulations is summarized for different models in Figure 7.
ACKNOWLEDGEMENTS This work was supported by KOSEF through Astrophysical Research Center for the Structure and Evolution of Cosmos (ARCSEC). The author would like to thank T. W. Jones for helpful comments on the manuscript.
REFERENCES
Bell, A.R. 1978, The acceleration of cosmic rays in shock fronts. I, MNRAS, 182, 147
Berezhko, E., Ksenofontov, L., & Yelshin, V. 1995, Efficiency of CR acceleration in supernova remnants, Nuclear Physic B., 39, 171.
Drury, L. O’C. 1983, An Introduction to the Theory of Shock Acceleration of Energetic Particles in Tenuous Plasmas, Rept. Prog. Phys., 46, 973
Gnedin, N. Y. 2000, Cosmological Reionization by Stellar Sources, ApJ, 535, 530
Gieseler U.D.J., Jones T.W., & Kang H. 2000, Time dependent cosmic-ray shock acceleration with self-consistent injection, A&Ap, 364, 911
Kang, H., Cen, R., Ostriker, J. P., & Ryu D., Hot gas in the cold dark matter scenario: X-ray clusters from a high-resolution numerical simulation, 1994, ApJ, 428, 1.
Kang H., & Jones T.W. 1995, Diffusive Shock Acceleration Simulations: Comparison with Particle Methods and Bow Shock Measurements, ApJ, 447, 944
Kang, H., & Jones, T. W., 2002, Acceleration of Cosmic Rays at Large Scale Cosmic Shocks in the Universe, Journal of Korean Astronomical Society, 35, 159 (Paper I)
Kang, H., Jones, T. W., & Gieseler, U.D.J, 2002, Numerical Studies of Cosmic-Ray Injection and Acceleration, ApJ, 579, 337
Kang, H., Jones, T. W., LeVeque, R. J., & Shyue, K. M. 2001, Time Evolution of Cosmic-Ray Modified Plane Shocks, ApJ, 550, 737
Kang, H., Rachen, J., & Biermann, P. L. 1997, Contributions to the Cosmic Ray Flux above the Ankle: Clusters of Galaxies, MNRAS, 286, 257
Kang, H., Ryu, D., & Jones, T. W., 1996, Cluster Accretion Shocks as Possible Acceleration Sites for Ultra High Energy Protons below the Greisen Cutoff, ApJ, 456, 422
Lucek, S.G., & Bell, A.R. 2000, Non-linear amplification of a magnetic field driven by cosmic ray streaming, MNRAS, 314, 65
Malkov, M.A. 1998, Ion leakage from quasiparallel collisionless shocks: Implications for injection and shock dissipation, Phys. Rev. E, 58, 4911,
Malkov M.A., & Drury, L.O’C. 2001, Nonlinear theory of diffusive acceleration of particles by shock waves, Rep. Progr. Phys. 64, 429
Malkov, M.A., & Völk H.J. 1998, Diffusive ion acceleration at shocks: the problem of injection, Adv. Space Res. 21, 551
Miniati, F., Ryu, D., Kang, H., Jones, T. W., Cen, R., & Ostriker, J. 2000, Properties of Cosmic Shock Waves in Large-Scale Structure Formation, ApJ, 542, 608
Miniati, F., Ryu, D., Kang, H., & Jones, T.W. 2001a, Cosmic-Ray Protons Accelerated at Cosmological Shocks and Their Impact on Groups and Clusters of Galaxies, ApJ, 559, 59
Miniati, F., Jones, T. W., Kang, H., & Ryu, D. 2001b, Cosmic-Ray Electrons in Groups and Clusters of Galaxies: Primary and Secondary Populations from a Numerical Cosmological Simulation, ApJ, 562, 233
Ryu, D., Kang, H., Hallman, E., & Jones, T. W. 2003, Cosmological Shock Waves and Their Role in the Large Scale Structure of the Universe, ApJL, submitted
Wentzel, D. G., 1974, Cosmic-Ray Propagation in the Galaxy: Collective Effects, ARAA, 12, 71