HST PHOTOMETRY OF DWARF ELLIPTICAL GALAXIES IN COMA, AND AN EXPLANATION FOR THE ALLEGED STRUCTURAL DICHOTOMY BETWEEN DWARF AND BRIGHT ELLIPTICAL GALAXIES11affiliation: Based on observations made with the NASA/ESA Hubble Space Telescope, obtained at the Space Telescope Science Institute, which is operated by the Association of Universities for Research in Astronomy, Inc., under NASA contract NAS 5-26555.
Abstract
As part of a research program exploring how and why dwarf elliptical (dE) galaxies depart from the Fundamental Plane defined by luminous elliptical (E) galaxies, we have analyzed archival Hubble Space Telescope F606W images of a sample of 18 dE galaxy candidates in the Coma Cluster. We model the full radial extent of their light-profiles by simultaneously fitting a PSF-convolved Sérsic model and, when necessary, either a central point-source or a central PSF-convolved Gaussian. Nucleation was detected in all but two of our final sample of 15 dE galaxies. When detected, the luminosities of the central component scale with the host galaxy luminosity such that . We confirm that the light-profiles of the underlying host galaxies display systematic departures from an exponential model that are correlated with the model-independent host galaxy luminosity and are not due to biasing from the nuclear component. The Pearson correlation coefficient between and central galaxy surface brightness (excluding the flux from extraneous central components) is -0.83 at a significance level of 99.99%. Excluding one outlier, the Pearson correlation coefficient between the logarithm of the Sérsic index and the host galaxy magnitude is -0.77 at a significance of 99.9%. We explain the observed relationship between dE galaxy luminosity and the inner logarithmic profile slope as a by-product of the correlation between luminosity and Sérsic index . Including, from the literature, an additional 232 dE and E galaxies spanning 10 mag in absolute magnitude (), the dE galaxies are shown to display a continuous sequence with the brighter E galaxies such that brightens linearly with until core formation causes the most luminous ( mag) E galaxies to deviate from this relation. The different behavior of dE and E galaxies in the –e (and –) diagram, and the e– diagram have nothing to do with core formation, and are in fact expected from the continuous and linear relation between and , and and .
1 Introduction
The commonly accepted, albeit somewhat arbitrary, definition of whether an elliptical galaxy is a dwarf galaxy depends on whether its absolute magnitude is fainter than (Sandage & Binggeli 1984).111A further distinction between faint and bright dwarf elliptical galaxies at ( km s-1 Mpc-1) has been used by Ferguson & Binggeli (1994). The realization that dwarf ellipticals could be reasonably well described with an exponential function (Faber & Lin 1983; Binggeli, Sandage & Tarenghi 1984) and that bright ellipticals are better fit with de Vaucouleurs’ (1948, 1959) -law led to the notion that they are two distinct families of galaxies (Wirth & Gallagher 1984, but see also Graham 2002a). One of the most referenced papers to support this view is Kormendy (1985). Plotting central surface brightness against luminosity, Kormendy’s Figure 3 shows two relations (almost at right angles to each other): one for the dE galaxies and the other for the luminous elliptical galaxies. Similarly, diagrams using , the surface brightness at the effective half-light radius , or , the average surface brightness within , also show two somewhat perpendicular relations. The reason for these differences, generally interpreted as evidence for a different formation mechanism, are far from broadly understood and will therefore be addressed in this paper.
In contrast to the above, there is substantial evidence for a continuity, rather than a dichotomy, between the alleged elliptical (E) and dwarf elliptical (dE) galaxy classes. Caldwell (1983; their Figure 6) showed that, fainter than , there is a continuous trend between the central surface brightnesses and absolute magnitudes of dE and E galaxies — more luminous galaxies have brighter central surface brightnesses (Caldwell 1987; Caldwell and Bothun 1987; Ferguson & Sandage 1988; Karachentsev et al. 1995; Hilker et al. 1999; Drinkwater et al. 2001; Hilker, Mieske, & Infante 2003). This observation has been highlighted by Jerjen & Binggeli (1997) and Jerjen, Binggeli, & Freeman (2000a) note that even the brightest elliptical galaxies (with partially evacuated cores) follow the same continuous and linear trend if one uses the inwardly extrapolated central surface brightness of the best-fitting Sérsic model (fitted outside of the core region). Caldwell (1983) also revealed a continuous and linear relationship exists between () color and luminosity over the magnitude interval (see Terlevich, Caldwell, & Bower 2001, and Odell, Schombert, & Rakos 2002 for recent reviews). Scodeggio (2001) showed this relation may, however, be far weaker than previously thought once one allows for color gradients and uses effective radii rather than fixed aperture sizes (see also the simulations of Cole et al. 2000). Relatedly, Caldwell & Bothun (1987) revealed a continuous luminosity–metallicity relation across the alleged dE/E classes (Barazza & Binggeli 2002). Previous studies of the luminosity-metallicity relation predominantly dealt with brighter galaxy samples: Faber 1973; Terlevich et al. 1981; Tonry & Davis 1981; Dressler 1984; Vader 1986. The relation between luminosity and velocity dispersion for E galaxies (Faber & Jackson 1976, Tonry 1981) has also been shown to extend linearly to include the dE galaxies (e.g., Bender, Burstein, & Faber 1992). There is additionally a continuous correlation between luminosity and globular cluster metallicity (Forbes et al. 1996). None of these correlations with luminosity suggest evidence for a discontinuity at .
To address the evidence for a dichotomy, we must turn to the issue of galaxy structure. It was realized over a decade ago that the light-profile shapes of dwarf and bright elliptical galaxies display, respectively, luminosity-dependent departures from the exponential and models (e.g., Capaccioli 1984, 1987; Michard 1985; Schombert 1986; Caldwell & Bothun 1987; Djorgovski & Kormendy 1989; Binggeli & Cameron 1991; Prugniel, Bica, & Alloin 1992; James 1991, 1994). Indeed, the luminosity dependence of galaxy concentration/profile-shape was known by Baade (1944).
Sérsic’s (1968) model can encompass both de Vaucouleurs -law and the exponential model, and a variety of other profile shapes by varying its exponent . It offers a means to explore the observed range of galaxy structures, and can be written as
| (1) |
where the intensity at the half-light radius is denoted by . The third parameter describes the shape, or curvature, of the light-profile. The quantity is a function of , and is approximately (Graham 2001). The differences between an and an (or 3) profile are quite distinct (see Figure 1), and it is now almost universally accepted that dE galaxies possess different profile shapes. However, in the case of brighter elliptical galaxies, as noted by Makino, Akiyama, & Sugimoto (1990), real departures from an model are often missed. One reason for this is because of the similarity of the Sérsic model when dealing with a restricted radial range of a galaxy’s surface brightness profile and when . Despite the lack of any physical meaning for the model, some authors have actually restricted the inner and outer radial extent of elliptical galaxy light-profiles (e.g., Burkert 1993), or adjusted the sky-background level (e.g., Tonry et al. 1997), in order to make the model fit — such is the ingrained belief in this classical model. Other authors have chosen not to vary the Sérsic exponent because they find and measurements are more stable if is fixed. Unfortunately, this has nothing to do with ensuring the accurate recovery of the true half-light radius and surface brightness; setting , for example, will have similar results on the perceived stability.
Schombert (1986) recognized the inadequacy of the model to describe luminous Es, finding it only fitted the middle part of bright galaxy profiles. Djorgovski & Kormendy (1989) noted that it fits best elliptical galaxies with ; brighter and fainter galaxies having different curvature than described by the model. That is, although real, luminosity-dependent, departures from the model have been known to exist for well over a decade, unfortunately, even today, they are often not even explored. However, as we will see, such deviations provide the key to understanding the true nature/connection between dE and E galaxies.
Studying a sample of 80 early-type galaxies in the Virgo and Fornax Clusters with the Sérsic model, Caon, Capaccioli, & D’Onofrio’s (1993) and D’Onofrio, Capaccioli, & Caon’s (1994) exploration of how the elliptical galaxy profile shapes (n) vary systematically with the model-independent half-light galactic radii (and luminosity) has been monumental in advancing our understanding of elliptical galaxies — placing it on a quantitative footing. Furthermore, by including a sample of 187 dwarf galaxies, modelled by Davies et al. (1988) using this same generalized profile, Caon et al. (1993) showed that one continuous trend between galaxy size and profile shape spanned both galaxy classes. Graham et al. (1996) subsequently showed this same trend to continue for even the brightest cluster galaxies. The shape of an elliptical galaxy’s light-profile has since been shown to correlate strongly with other galactic quantities which have also been obtained independently of the Sérsic model. For example, Graham et al. (2001b, 2002b) showed how the logarithm of correlated with a galaxy’s central velocity dispersion (correlation coefficient ). Graham et al. (2001a, 2002a) showed the logarithm of to correlate () with a galaxy’s supermassive black hole mass. Different profile shapes are therefore obviously real, and can be parameterized with the Sérsic model. Indeed, just as de Vaucouleurs & Capaccioli (1979) showed that beyond 10, provided a good fit to the profile of NGC 3379 (spanning 10 mag of surface brightness), Bertin, Ciotti, & Del Principe (2002) have shown that very different values of provide equally good fits to the extended profiles of other elliptical galaxies. Far from a dichotomy, at least in terms of galaxy profile shape and luminosity, dwarf and bright elliptical galaxies are extensions of each other (Cellone, Forte, & Geisler 1994; Young & Currie 1994, 1995, 1998; Durrell 1997; Gerbal et al. 1997; Graham & Colless 1997; Jerjen & Binggeli 1997; Prugniel & Simien 1997; Trujillo, Graham, & Caon 2001).
In Section 2 we introduce our sample of 18 Coma Cluster, dE galaxy candidates imaged with the Hubble Space Telescope (HST) WFPC2 camera. We describe the data reduction and profile extraction. Possibly for the first time, we show that the Sérsic model, combined with an optional central point-source or central Moffat-convolved Gaussian, provides a good description to the full radial extent of HST-resolved dE galaxy light-profiles. The structural parameters from the fitted models will be used in an exploration of the Fundamental Plane for dE galaxies (Guzmán et al. 2003, in prep). In Section 3 we confirm the trend between profile shape and luminosity found by others who had previously excluded the nuclear region in their modelling. We also explain the relation between inner profile slope () and luminosity as a consequence of the relation between global profile shape and luminosity. We additionally observe a relationship between the luminosity of the underlying galaxy and the luminosity of the central component in dE galaxies. Finally, in Section 4, we show how the difference between and (and also ) varies with light-profile shape and consequently with galaxy luminosity. Combining our dE data with a larger sample of literature data, we subsequently reveal how a continuous and linear relation between and luminosity results in an apparent dE/E dichotomy when one plots either (or ) against luminosity. An apparent dichotomy is thus expected in the – diagram. A summary is given in Section 5. Throughout this paper we use km s-1 Mpc-1.
2 Data
2.1 Galaxy Sample
There have been many recent studies of the surface brightness profiles of Coma cluster galaxies (e.g., Gerbal 1997; Mobasher et al. 1999; Khosroshahi, Wadadekar, & Kembhavi 2000; Gavazzi et al. 2000; Komiyama et al. 2002; Trujillo et al. 2002). These studies used ground-based images. As our interest lies in the properties of dE galaxies having half-light radii of only a couple of arcseconds, we have obtained archival HST images. Moreover, dE galaxies are often nucleated; failing to separate the excess nuclear light from the underlying galaxy light can severely bias the structural parameter analysis (e.g., Balcells et al. 2003). Although the Coma cluster is more distant than, for example, the Virgo and Fornax clusters, due to the high resolution of the HST we have been able to acquire surface brightness profiles of a quality better than typical ground-based profiles of Virgo and Fornax dE galaxies. Additionally, one of us (R.G.) has already studied the structural, chemical, and dynamical properties of Coma’s brightest cluster members (Guzmán, Lucey, & Bower 1993).
Our Coma cluster dE galaxy candidates were chosen using -, -, and -band images of the central region obtained with WIYN/MiniMo and the INT/Wide Field Camera. A detailed discussion of the selection criteria is provided in Matković & Guzmán (2003, in prep). The selection criteria can be summarized as follows. Firstly, a color cut was applied in the vs. diagram such that and . Galaxies in this sample follow the same and color-magnitude relations defined by the bright ellipticals in Coma. According to galaxy evolutionary synthesis models, this color cut also minimizes contamination from background field disk galaxies at z0.2, which may affect galaxy samples at faint magnitudes. Secondly, a limiting magnitude cut was applied such that . This was applied in order to select “dwarf” galaxies with in the Coma cluster — assuming Coma to be at a distance of 100 Mpc. Spectra for a sub-sample of these Coma cluster dE-candidates were obtained using WIYN/HYDRA. The 18 galaxies presented in this paper correspond to all the objects with HST/WFPC2 F606W images in this sub-sample whose redshifts confirmed their Coma cluster membership. Despite being bonafide cluster members, we continue referring to them as Coma cluster dE candidates since some of these objects turn out to have morphologies more consistent with being dwarf disk galaxies, as discussed below.
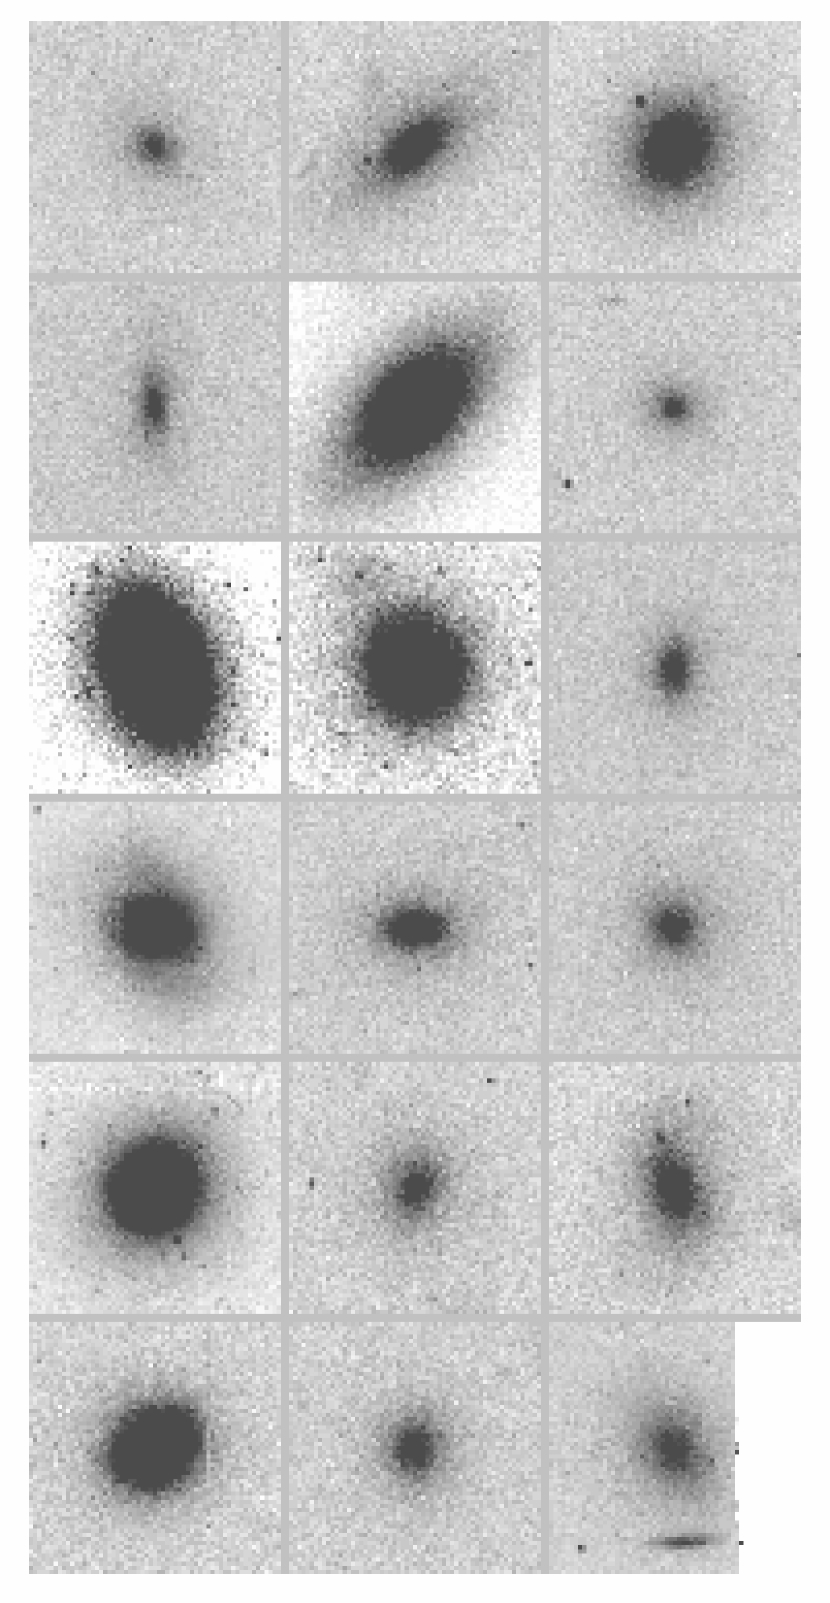
Table 1 provides the identification of our galaxy sample, as denoted in the Godwin, Metcalfe & Peach’s (1983) Coma galaxy catalog. Figure 2 presents a mosaic containing the 18 HST Archival F6060W images of our sample of dE galaxy candidates in the Coma Cluster. The images were obtained from the HST Archive. The two main original programs from which these images were taken were aimed at studying the central cores, and the globular cluster populations, of bright elliptical galaxies in Coma. The elliptical galaxies were centered in the Planetary Camera. Our dE galaxy candidates were found in the three Wide Field chips, i.e., at an angular distance of less than 1.5 from a bright elliptical galaxy.
2.2 Data reduction and profile fitting
The HST images were reduced following the standard HST pipeline, combined and cleaned of cosmic-rays using crreject, further cleaned of cosmic rays using LACOS (L.A.COSMIC, van Dokkum 2001), and background subtracted using the wavelet decomposition method by Vikhlinin et al. (1998). This variable large-scale subtraction was needed in order to define an accurate asymptotic value for the curve of growth that is otherwise not well-defined due to the contamination of nearby galaxy halos for many of our objects.
Photometry was performed using the iraf task ELLIPSE with both the galaxy center (determined with the task CENTER) and the position angle (measured at 2.5, roughly 1 ) fixed. The ellipticity was allowed to vary. The position angle was, however, allowed to vary for a couple of galaxies (GMP 3625 and GMP 3629; Godwin, Metcalfe, & Peach 1983) where 60-80o differences exist between the position angles of the inner and outer isophotes. GMP 3629 is almost perfectly round and so these changes are not surprising, GMP 3625 has an ellipticity of 0.17-0.40.
Surface brightness profiles and curves-of-growth were derived with the key assumption that the curve-of-growth had to flatten at large radii, i.e., the asymptotic value is well-defined. In some cases this required a small constant background subtraction to remove residual sky. Only in those cases where the galaxies were so close to the edge of the chip that the profile could not be measured over the entire galaxy was the condition of a flat curve-of-growth relaxed. In these cases, the sky was estimated as the median value at large distances from the galaxy. We note that an unambiguous estimate of the sky-background is not always possible and the results may be affected by a certain subjectivity in the way the background was subtracted. However, results from independent surface brightness profiles obtained from different images of the same galaxy are in good agreement with each other (see later).
The surface brightness profiles are presented in Figures 3 and 4, shown as a function of the geometric mean radius . As we had multiple profiles for each galaxy, the most typical have been shown. The error bars shown on the profile data represent the errors associated to photon-noise and read-out-noise. Systematic errors in the sky-background associated with residual contamination by the halos of other galaxies are not included. We model individual profiles as a combination of a PSF-convolved bulge model (Trujillo et al. 2001) and either a point-source or a PSF-convolved central Gaussian. An optional PSF-convolved outer exponential model was used for galaxies with an obvious two component structure (in addition to the nuclear source). The Moffat PSF, and hence the point source profile, was measured from nearby stars or globular clusters on each chip. For any given galaxy, all the structural parameters were obtained simultaneously. We have verified that every galaxy’s major-axis profile required the same composition of components as the geometric mean profiles, confirming our final component selection shown in Figures 3 and 4. No signal-to-noise (S/N) weighting was employed as it can result in poor fits when the inner profile contains additional components which are not considered in the modelling process. For example, if we only fitted S/N-weighted models, the presence of the nuclear components would severely bias the fits, producing erroneously high values of .
We have estimated the errors on the structural parameters by modelling different images of the same galaxy. Sometimes the exposure times were different, other times the galaxy appeared on a different WFPC2 chip. Our error estimates therefore include the effects of: shot-noise, placement on the chip, estimation of the galaxy orientation and center, and the associated influence of pixelation. Additionally, by modelling the sky-background in different ways we have been able to further gauge the likely accuracy of the fitted model parameters. In all cases when we had multiple light-profiles, which we did for most galaxies, the surface brightness profiles were consistent with each other down to a level of mag arcsec-2. Fitting models down to this surface brightness level we found the differences in the best-fitting Sérsic parameters obtained from different profiles of the same galaxy spanned 0.05 mag arcsec-2 in , 5% in , and 4% in . Most profiles are not consistent with the =1 exponential model.
2.3 Disks
Before proceeding, we checked for the presence of dwarf S0 galaxies (Sandage & Binggeli 1984; Binggeli & Cameron 1991) in our sample. From the image and surface brightness profile of GMP 3292 it is clearly not a dE galaxy; there is evidence of faint outer spiral arms (Figure 2), and it has a two-component light-profile which is not due to nucleation. With a recessional velocity of 4955 km s-1 (Matković & Guzmán 2003, in prep), this galaxy is not a background galaxy.222Redshifts have been obtained for our entire galaxy sample; all galaxies have velocities in the range from 4,000 to 10,000 km s-1 and reside within 20 arcmin from the cluster center, consistent with being cluster members (Kent & Gunn 1982). The mean velocity and velocity dispersion of the Coma cluster are respectively 7,000 km s-1 and 1,000 km s-1 (Edwards et al. 2002). Its central surface brightness is brighter than mag arcsec-2, and so technically it is not a dwarf spiral galaxy, as defined by Schombert et al. (1995). Due to the significant prominance of its bulge, it is also not a small late-type disk galaxy. GMP 3292 is thus likely to be a dwarf S0 galaxy. Unlike the extraordinarily faint inner spiral arms found by Jerjen, Kalnajs, & Binggeli (2000) in the (previously classified) dE,N galaxy IC 3328, the arms in GMP 3292 are actually quite visible in the outer parts of GMP 3292. An examination of the type performed by Jerjen, Kalnajs, & Binggeli (2000b) and Barazza, Binggeli, & Jerjen (2002) is beyond the intended scope of this paper and will be left for future investigation. Our sole objective here is to identify and exclude possible two component galaxies (not counting nucleation as a component).
In addition to GMP 3292, we will exclude two further galaxies. Neither GMP 2960 nor GMP 3486 can be described with a global Sérsic model plus some small nuclear component. The FWHM of the best-fitting central Gaussian, when simultaneously fitted with a global Sérsic model, is greater than 0.5, or 235 pc, for both of these galaxies. Figure 3 shows both of these profiles fitted with an inner Sérsic model plus an outer exponential model. We are unable to say whether the outer exponential is that of a flattened disk, as in the case of a dwarf S0 galaxy, or whether the outer exponential is actually the underlying host galaxy and the inner Sérsic model is describing an excessively large nuclear star cluster. The latter scenario might represent the evolved state of blue compact dwarf galaxies (e.g., Papaderos et al. 1996; Doublier, Caulet, & Comte 1999; Cairós et al. 2001, and references therein), although this suggestion is purely speculative on our part. We do note that the ellipticity in GMP 2960 changes from 0.06 at 1.27 arcseconds (the half-light radius of the inner Sérsic component) to 0.51 at 13.3 arcseconds (the outer most data point modelled by us), suggestive, albeit not conclusive, of an inclined outer disk. For GMP 3486, the ellipticity decreases with radius (see Table 2).
Lastly, GMP 3629 may also possess an outer disk; there is the suggestion of faint spiral arms in Figure 2. However, the width of the nuclear component in GMP 3629 is only 0.12 ( 60 pc), possibly too small to be considered a bulge. We do however note the the alternative possibility that the disk may not actually dominate until radii greater than 10, the inner profile (0.1–10) dominated by the bulge light and the central 0.1 dominated by a nuclear star cluster. We feel, however, to conclude there is a disk beyond 10 would place too much faith in the outer, low surface brightness profile. Nonetheless, if this is the case, we found that the Sérsic parameters from such a bulge/disk decomposition are very similar to those already given in Table 2. Similarly for GMP 2955 and a couple of other galaxies, a diffuse outer envelope/disk/halo of stars may exist beyond our surface brightness cutoff at mag arcsec-2. However, including this (potential) outer exponential component in the modelling process did not substantially modify the parameters of the more luminous inner Sérsic component.
Table 2 provides the structural parameters and some derived quantities for our sample. No surface brightness corrections have been applied here. A quick and dirty comparison of our total (extrapolated to infinity) magnitudes versus the photographic -band magnitudes (within the mag isophote) from Godwin et al. (1983) is shown in Figure 5. The agreement is encouraging, especially given that the color term is likely to be different for each galaxy. The line which is shown simply represents a constant color difference of 1.0 mag. The potential disk galaxy GMP 3486 is the only notable outlier, some 0.5 mag deviant, and (along with GMP 3292 and GMP 2960) it will be excluded from here on. This leaves us with a sample of 15 dE galaxies.
In the figures which follow, we have corrected for dimming (0.10 mag), -correction (0.02 mag; Poggianti 1997), and Galactic extinction (0.02 mag; Schlegel, Finkbeiner, & Davis 1998, via NED333NASA Extragalactic Database.).
The Nuker model (Lauer et al. 1995) was not used because it can only describe a restricted portion of the inner light-profile. Moreover, as first suggested in Graham et al. (2002b), Trujillo et al. (2003, in prep) reveal that the low-luminosity (i.e., the so-called “power-law”) elliptical galaxies are in fact actually pure Sérsic-law galaxies. That is, excluding for the moment the presence of additional nuclear components, the 3 Sérsic parameters describe the entire light-profile of these galaxies.
3 Correlations amongst the dE structural parameters
The present dE galaxy sample spans only 2.4 mag in absolute magnitude (excluding the brightest 3 galaxies in Figure 5, which are possible disk galaxies). Consequently, intrinsic scatter may dominate many parameter correlations. Nonetheless, in order to inspect whether the current data set displays the same general trends as other dE galaxies, Figure 6 presents the logarithm of the Sérsic index plotted against the host galaxy’s: (a) central surface brightness ; (b) effective surface brightness ; (c) logarithm of the effective radius ; and (d) absolute magnitude in F606W. By the term ‘host galaxy’ we mean the underlying galaxy — free of the flux from additional nuclear components (which are typically 1% of the host galaxy flux). All quantities have been derived from the Sérsic fit, the quality of which can be judged in Figures 3 and 4. Importantly, the agreement between our model-dependent magnitudes and the model-independent values from Godwin et al. (1983) (see Figure 5), reveals that the correlation between profile shape () and magnitude in Figure 6d is not an artifact from our use of Sérsic models. However, our limited range in luminosity and small sample size appears inadequate to reveal any strong trend between and (e.g., Caon et al. 1993; Young & Currie 1995). The most notable correlation is between and ; the Pearson correlation coefficient is -0.83 at a significance of 99.99%. Modelling the bulges of spiral galaxies, other authors have found a similarly strong trend (e.g., Khosroshahi et al. 2000; Möllenhoff & Heidt 2001). A reduced-major-axis regression analysis (Feigelson & Babu 1992) gives , where the uncertainties have come from a jackknife sampling of the data. Excluding GMP 2983, the Pearson correlation coefficient between and absolute host galaxy magnitude is , at a significance of 99.9%. An orthogonal regression analysis gives
The sense of these trends agree with the correlations shown by Cellone et al. (1994), Young & Currie (1994), Jerjen & Binggeli (1997), Durrell (1997), Ryden et al. (1999), Schwarzkopf & Dettmar (1997), and others.
3.1 Nuclei
Many dE galaxies are known to be nucleated (e.g., Sandage & Binggeli 1984; Binggeli et al. 1984; Ferguson & Sandage 1989). However, most HST studies of nearby, nucleated galaxies have focused on spiral galaxies (e.g., Phillips et al. 1996; Carollo et al. 1997a; Matthews et al. 1999; Böker et al. 2002; Carollo et al. 2002; Balcells et al. 2003) or luminous elliptical galaxies (e.g., Lauer et al. 1995; Ravindranath et al. 2001; Rest et al. 2001). To the best of our knowledge, there has been no structural analysis of the nuclear star clusters in dE galaxies using the HST.
Figure 7 shows the magnitude of the nuclear component plotted against: (a) the absolute host galaxy magnitude; and (b) the logarithm of the galaxy profile shape . It is noted that no central component was detected in GMP 2585 and GMP 2955, and these galaxies are therefore not included in this figure. There is a fair amount of scatter in these sparsely populated diagrams. Although the data sample is small, we can however remark that it does reflect the apparent trend seen between nuclear component magnitude and host galaxy magnitude shown in Figure 7 of Phillips et al. (1996; excluding the star-forming knots in that diagram). There is, however, a difference in what these diagrams show, since those authors used the total (bulge-plus-disk) magnitudes from a sample of nearby disk galaxies (see also Carollo et al. 1998). More in-line with what we show in Figure 7, Balcells et al. (2003) have recently shown the magnitudes of the nuclear components in the bulges of early-type disk galaxies correlate strongly (=0.77) with these galaxy’s bulge magnitudes.
An orthogonal regression analysis on Figure 7a yields using the F606W filter, which is equivalent to
| (2) |
To explore the stability of this relation, and obtain a more robust result, we have re-derived this correlation after excluding two potential outlying galaxies; specifically, those with the brightest nuclear components (GMP 3018 and GMP 3645):
| (3) |
More data is of course required before Equations 2 or 3 can be considered universal for nucleated dE galaxies. Environment may also play a role.
3.2 Inner profile slope
Having modeled the nuclear component, we can now explore the inner slope of the underlying host galaxy profile. Interest in this quantity arose from the discovery of a bimodal distribution of slopes for E galaxies more luminous that (Ferrarese et al. 1994; Lauer et al. 1995; Gebhardt et al. 1996), and the implication of a different galaxy formation process.
For a Sérsic model, the negative logarithmic slope of the light-profile at any radius can be given by the expression
| (4) |
For a fixed ratio, is thus a monotonically increasing function of (Graham et al. 2002b; their Figure 4). Given the correlation between and magnitude (Figure 6d), is therefore obviously correlated with magnitude.
Rather than use , that is, ignoring differences in galaxy size, Figure 8 shows a plot of versus the host galaxy magnitude. Although we recognize this is perhaps not the best estimate of the inner profile slope, as it measures the slope at different fractions of the half-light radius, and identical galaxies in clusters at different distances will be sampled at different physical radii, it is nonetheless somewhat comparative with past investigations. We have used a F606W color of 1.08 (Fukugita, Shimasaku, & Ichikawa 1994) in order to present -band magnitudes for our galaxy sample. The profile slope was derived from the fitted Sérsic model and therefore explicitly avoids any potential bias in the slope from additional nuclear components. To figure 8 we have added the dE galaxy data from Stiavelli et al. (2001). Following Carollo et al. (1997b), they computed the average logarithmic profile slope from 0.1-0.5 arcseconds. Conversion from the HST F555W filter used by Stiavelli et al. (2001) to the -band used by the Nuker team was performed by us assuming a constant color of 0.9. The Nuker team’s bright elliptical galaxy sample (Faber et al. 1997), excluding their S0 galaxies, are also included here. In spite of the different methods and radial ranges used to obtain the inner profile slope, and inaccuracies from our assumption of constant color terms, there is a general correlation in Figure 8 such that the inner profile slope steepens as the absolute magnitude of the host galaxy brightens. This trend, albeit with the odd outlier, can be seen to continue until the onset of core formation in the brightest elliptical galaxies.
The observed cores in the luminous elliptical galaxies are thought to have arisen from the partial evacuation of the nuclear region by coalescing blackholes (e.g., Ebisuzaki, Makino, & Okumura 1991; Makino & Ebisuzaki 1996; Komossa et al. 2003). Whatever process(es) have reduced these galaxies central surface brightness profiles, the high luminosity “core” galaxies clearly depart from the relation defined by galaxies without cores. Presumably the depletion of the core occurs rapidly, hence the observed gap at the bright end of the relation (Ferrarese et al. 1994; Lauer et al. 1995; Gebhardt et al. 1996; Faber et al. 1997), although it should be noted that some galaxies have since been found to reside here (Rest et al. 2001; Ravindranath et al. 2001).
4 Structural connections between dE and E galaxies
To illustrate the continuity between the dE and E galaxies, and at the same time explain their apparently different behavior in certain structural parameter diagrams, we will use the large compilation of dE and E galaxies presented in Graham et al. (2002b, their Figure 1). This collection of 232 galaxies spans 10 mag in absolute magnitude and consists of the luminous E galaxies from the sample of Faber et al. (1997), the intermediate-to-bright E galaxies from Caon et al. (1993) and D’Onofrio et al. (1994), and the dE galaxy sample of Binggeli & Jerjen (1998) and Stiavelli et al. (2001). Known lenticular galaxies are excluded. One difference between the central surface brightness data shown in Graham et al. (2002b) and those shown here is that rather than use the observed (seeing-reduced) central surface brightness values from the sample of Caon et al. (1993) and D’Onofrio et al. (1994), we will use the best-fitting Sérsic model value. However, because of core formation, we have excluded those galaxies from these Authors with mag in the plots using central surface brightness. Finally, we have added our own sample of Coma dE galaxies. We additionally show correlations using , , , and , which are not shown in Graham et al. (2002b).
The only HST study of dE galaxy surface brightness profiles that we are aware of is that by Stiavelli et al. (2001). After excluding the inner arcsecond of the profiles because of nucleation, they fitted exponential, , and Sérsic models to a sample of 23 Virgo and Fornax Cluster, and 2 Leo Group, dE galaxies444Stiavelli et al. (2001) additionally fitted Nuker models to the inner profile after excluding the innermost 0.5.. From their error analysis, only 7 of these galaxies have profiles consistent (at the 2 level) with an exponential model (see their Table 2).
For the full galaxy sample, Figure 9 shows, when available, the absolute -band galaxy magnitude plotted against three measures of surface brightness: the mean surface brightness within the effective half-light radius ; the surface brightness at the half-light radius; and the central surface brightness of the host galaxy (excluding the flux from nuclear components). The middle panel shows these three surface brightness values versus the logarithm of the Sérsic index , while the lower panel shows these three values against the logarithm of the half-light radius . The value of , and the absolute magnitudes, were obtained from the above papers and re-derived assuming a Hubble constant of 70 km s-1 and a Virgo and Fornax distance modulus of 31.2.
One of the most quoted papers to support the dE/E dichotomy is that of Kormendy (1985). In that paper the author wrote that, “the most surprising result of this paper is that there is a large discontinuity between the parameter correlations for elliptical and dwarf spheroidals”, and concluded that “dwarf elliptical galaxies are very different from the sequence of giant ellipticals.” This conclusion was based largely on Figure 3 (top right panel) from that paper, which included 11 dwarf elliptical galaxies and a number of luminous elliptical galaxies. Indeed, this plot of central surface brightness versus galaxy magnitude does show a large discontinuity between the dE and E galaxies. However, there is an absence of galaxies with magnitudes around in this sample, exactly where one might expect to see the two groups connect. Nearly a decade later, the Astronomy and Astrophysics Review paper by Ferguson & Binggeli (1994; their Figure 3) had a big question mark as to “how” and indeed “if” the dE and E galaxies might actually connect in this diagram. That is to say, the idea of a discontinuity has been around (and largely accepted) for many years.
If we are to remove galaxies having from our diagram of vs. (Figure 9c) we will obtain a figure which looks very much the same as Kormendy’s figure. Thus, the answer to the believed dichotomy lies, in part, in the sample selection used by Kormendy (1985). This explains the discontinuity but not the change in the slope. The answer to the latter resides in the observation that luminous elliptical galaxies possess partially evacuated “cores”. Their central surface brightnesses are thought to be a modification of their original, more luminous value. As stressed in Graham et al. (2002b), the brighter galaxies lying perpendicular to the relation defined by the less luminous () elliptical galaxies in the - diagram are all “core” galaxies. There is no dichotomy at in this diagram. However, there is a “dichotomy” at ; but this is not necessarily the result of a different initial formation mechanism for galaxies brighter or fainter than this value. Rather, (subsequent) core formation has apparently modified the central surface brightness in galaxies brighter than . The initial mechanism(s) of dE and E galaxy formation are therefore likely to be the same given the continuity at . Importantly, luminous elliptical galaxies should not be viewed as the norm, but instead are the exception to the relation between central surface brightness and magnitude which exists over (at least) some 8 mag. Indeed, analysing over 100 dwarf spheroidals ( mag, Grebel 2001), Hilker, Mieske, & Infante (2003) and Grebel, Gallagher, & Harbeck (2003) show that this trend continues down to at least mag.
A second reason why people have thought that luminous E galaxies are different from low-luminosity (dwarf) elliptical galaxies is because they don’t follow the same – (and –) relation, as seen in Figure 9b (and Figure 9a). Given that there is a continuous and linear relationship between and , suggestive of a similar formation mechanism, until the subsequent(?) process of core formation, why is the relationship between and (and ) apparently different for the dE and E galaxies? It turns out the reason for this has nothing to do with core formation but is due to the systematic changes in profile shape with galaxy magnitude (Figure 10).
For the Sérsic model,
| (5) |
and
| (6) |
(see, e.g., Caon et al. 1994; Graham & Colless 1997). Figure 11 shows the differences between and , and and , as a function of profile shape .
The line in Figure 10 is now used to determine a representative value of for a given . Using this correlation, the line shown in Figure 9c can then be transformed into a relationship between and (and and ) and is shown in Figure 12. One can immediately see that we have reproduced the observed correlations in Figure 9a and 9b. The apparently different slope for the dE and E galaxies in these diagrams is merely a consequence of a continuously varying profile shape with galaxy luminosity — it certainly does not imply a different galaxy formation mechanism. Without this understanding, these diagrams had been a considerable red herring to our understanding of dE/E galaxy formation.
We have discussed the behavior of the various luminosity – surface brightness diagrams. We will now quickly explain why these lead to a different behavior for the dE and E galaxies in the – plane. In this diagram, a break, or change in slope, at is known to exist (Kodaira, Okamura, & Watanabe 1983; Binggeli et al. 1984; Binggeli & Cameron 1991; Capaccioli et al. 1993). Modelling elliptical galaxies from the bright end of the luminosity function results in the Kormendy (1977) relation (e.g., Hoessel, Oegerle, & Schneider 1987; Graham 1996), while modelling fainter elliptical galaxies is known to produce a different relation (e.g., Binggeli & Cameron 1991). The different slopes have been interpreted in the past as evidence for a dE/E galaxy dichotomy. However, the difference observed in this diagram need not imply a different formation mechanism. From the relation , the diagram of versus (Figure 9a) can be used to determine . One can then immediately understand why diagrams of versus (Figure 9g) show a different trend for the dE and E galaxies. The same explanation applies to the relation.
In conclusion, there is a continuous structural relation between the alleged dE and E galaxy classes until core formation is detected. The use of or , instead of , and the use of models, has blinded our realization of this for a long time.
5 Summary
This paper provides an analysis of HST-resolved dwarf elliptical galaxies modelled with a Sérsic function and either a central point source or a resolved central Gaussian component. That is, we have taken full advantage of the HST resolution and modelled the complete galaxy profiles. We find that the structure of the dE galaxies is consistent with that found from studies which avoided the inner arcsecond (or three). Moreover, the 3-parameter Sérsic model remains a good description of the entire (underlying) host galaxy light-profiles.
Three of our initial 18 dE galaxy candidates may contain outer disks, or in any case are two component systems (in addition to possible nucleation); they are all possibly dwarf S0 galaxies. Thirteen of the remaining 15 dE galaxies are nucleated. Excluding two possible outliers, we found . However, our galaxy sample spans only a little over 2 mag in absolute magnitude and hence an increased sample with a greater range of magnitudes would be valuable. Despite this, we find strong correlations between and () and and (). The correlation between the inner, logarithmic profile slope and is explained here as a consequence of the relations between and , and and . Galaxies fainter than have progressively shallower inner profile slopes.
By including 232 E galaxies from the literature, which (starting at ) span 10 mag in absolute magnitude, we have shown that more luminous elliptical galaxies have brighter central surface brightnesses — until the detection of core formation at . The linear relationships between magnitude, the logarithm of the profile shape , and the central surface brightness, are used to predict and explain why the low- and high-luminosity elliptical galaxies display a different behavior in diagrams of luminosity versus effective and mean surface brightness. It has nothing to do with core formation, nor does it imply a different formation mechanism for each galaxy class, as has been the interpretation in the past. It is instead a natural consequence of the previously mentioned linear relations. Contrary to popular belief, dE galaxies appear to be the low-luminosity extension of brighter E galaxies; there is no physical boundary at . The smooth and continuous change in these galaxy’s structural properties suggests that a similar physical process, or processes, have governed the evolution of the entire dE + E galaxy family — with the notable departure of only the most luminous ellipticals from the – diagram at . With this exception in mind, the mechanism of how dE and E galaxies collapsed to form stars is therefore expected to be similar.
Simulations of elliptical galaxy catalogs which have used only models do not represent the real galaxy population in our Universe. Similarly, -body merger models which finish with galaxies having a range of luminosities but with structural homology (e.g., all with profiles), have also not reproduced what is observed in nature. It would be of great interest to re-examine whether the surface brightness profiles of elliptical galaxies simulated in an hierarchial clustering cosmology (e.g. Cole et al. 2000) display a range of profile shapes which vary with galaxy luminosity. Additionally, observational work which has a priori assumed all galaxies can be approximated with either an exponential surface brightness profile (e.g., Shao et al. 2003), or with an profile (e.g., Bernardi et al. 2003a,b)555The global curvature in the (-model minus data) residual profiles in Bernardi et al. (2003a; their figure 7) clearly show deviations from the -model which can be well matched using an model. will certainly obtain a luminosity-biased set of surface brightness and galaxy size parameters which cannot reproduce the trends observed in, for example, the top panel of Figure 9. Lastly, models of bright elliptical galaxies built from the merging of elliptical galaxies fainter than must not assume the correlations defined by the brightest elliptical galaxies necessarily apply to the pre-merged galaxies. Unless merger models include the growth and merging of supermassive black holes, or some other mechanism of core depletion, they should predict brighter central surface brightnesses with increasing galaxy luminosity.
References
- (1) Baade, W. 1944, ApJ, 100, 147
- (2) Balcells, M., Graham, A.W., Dominguez-Palmero, L., & Peletier, R.F. 2003, ApJ, 582, L79
- (3) Barazza, F.D., & Binggeli, B. 2002, A&A, in press (astro-ph/0209112)
- (4) Barazza, F.D., Binggeli, B., & Jerjen, H. 2002, A&A, 391, 823
- (5) Bender, R., Burstein, D., & Faber, S.M. 1992, ApJ, 399, 462
- (6) Bernardi, M., et al. 2003a, AJ, in press (astro-ph/0301631)
- (7) Bernardi, M., et al. 2003b, AJ, in press (astro-ph/0301624)
- (8) Bertin, G., Ciotti, L., Del Principe, M. 2002, A&A, 386, 149
- (9) Binggeli, B., & Cameron, L.M. 1991, A&A, 252, 27
- (10) Binggeli, B., & Jerjen, H. 1998, A&A, 333, 17
- (11) Binggeli, B., Sandage, A., & Tarenghi, M. 1984, AJ, 89, 64
- (12) Böker, T., Laine, S., van der Marel, R.P., Sarzi, M., Rix, H.-W., Ho, L.C., & Shields, J.C. 2002, AJ, 123, 1389
- (13) Burkert, A. 1993, A&A, 278, 23
- (14) Cairós, L.M., Caon, N., Vilchez, J.M., González-Perez, J.N., & Muñoz-Tuñon, C. 2001, ApJS, 136, 393
- (15) Caldwell, N. 1983, AJ, 88, 804
- (16) Caldwell, N. 1987, 94, 1116
- (17) Caldwell, N., & Bothun, G.D. 1987, AJ, 94, 1126
- (18) Caon, N., Capaccioli, M., & D’Onofrio, M. 1993, MNRAS, 265, 1013
- (19) Caon, N., Capaccioli, M., D’Onofrio, M., & Longo, G. 1994, A&A, 286, L39
- (20) Capaccioli, M. 1984, in New Aspects of Galaxy Photometry, ed. J.-L. Nieto, Springer-Verlag, p.53
- (21) Capaccioli, M. 1987, in Structure and Dynamics of Elliptical Galaxies, IAU Symp. 127, Reidel, Dordrecht, p.47
- (22) Capaccioli, M., & Caon, N. 1991, MNRAS, 248, 523
- (23) Capaccioli, M., Caon, N., & D’Onofrio, M. 1992, MNRAS, 259, 323
- (24) Capaccioli, M., Caon, N., & D’Onofrio, M. 1993, in Structure, Dynamics, and Chemical Evolution of Elliptical Galaxies, ESO/EIPC Workshop, eds. I.J.Danziger, W.W.Zeilinger, K.Jkär, ESO, Garching, p.43
- (25) Carollo, C.M., Franx, M., Illingworth, G.D., & Forbes, D.A. 1997a, ApJ, 481, 710
- (26) Carollo, C.M., Stiavelli, M., de Zeeuw, P.T., & Mack, J. 1997b, AJ, 114, 2366
- (27) Carollo, C.M., Stiavelli, M., Seigar, M., de Zeeuw, P.T., & Dejonghe, H. 2002, AJ, 123, 159
- (28) Cellone, S.A., Forte, J.C., & Geisler, D. 1994, ApJS, 93, 397
- (29) Cole, S., Lacey, C.G., Baugh, C.M., & Frenk, C.S. 2000, MNRAS, 319, 168
- (30) Davies, J.I., Phillipps, S., Cawson, M.G.M., Disney, M.J., & Kibblewhite, E.J. 1988, MNRAS, 232, 239
- (31) de Vaucouleurs, G. 1948, Annales d’Astrophysique, 11, 247
- (32) de Vaucouleurs, G. 1959, in Handbuch der Physik, ed. S.Flügge, Springer, Berlin, p.275
- (33) de Vaucouleurs, G., & Capaccioli, M. 1979, ApJS, 40, 669
- (34) Djorgovski, S., & Kormendy, J. 1989, ARA&A, 27, 235
- (35) D’Onofrio, M., Capaccioli, M., & Caon, N. 1994, MNRAS, 271, 523
- (36) Doublier, V., Caulet, A., & Comte, G. 1999, A&AS, 138, 213
- (37) Dressler, A. 1984, ApJ, 281, 512
- (38) Drinkwater, M.J., Gregg, M.D., Holman, B.A., & Brown, M.J.I. 2001, MNRAS, 326, 1076
- (39) Durrell, P. 1997, AJ, 113, 531
- (40) Ebisuzaki, T., Makino, J., & Okumura, S.K. 1991, Nature, 354, 212
- (41) Edwards, S.A., Colless, M., Bridges, T.J., Carter, D., Mobasher, B., & Poggianti, B.M. 2002, ApJ, 567, 178
- (42) Faber, S.M. 1973, ApJ, 179, 731
- (43) Faber, S.M., & Jackson, R.E. 1976, ApJ, 204, 668
- (44) Faber, S.M., & Lin, D.M.C. 1983, ApJ, 266, L17
- (45) Faber, S.M., et al. 1997, AJ, 114, 1771
- (46) Feigelson, E.D., & Babu, G.J. 1992, ApJ, 397, 55
- (47) Ferguson, H.C., & Binggeli, B. 1994, A&ARv, 6, 67
- (48) Ferguson, H.C., & Sandage, A. 1988, AJ, 96, 1520
- (49) Ferguson, H.C., & Sandage, A. 1989, ApJ, 346, L53
- (50) Ferrarese, L., van den Bosch, F.C., Ford, H.C., Jaffe, W., & O’Connell, R.W. 1994, AJ, 108, 1598
- (51) Forbes, D.A., Franx, M., Illingworth, G.D., & Carollo, C.M. 1996, ApJ, 467, 126
- (52) Fukugita, M., Shimasaku, K, & Ichikawa, T. 1994, PASP, 107, 945
- (53) Gavazzi, G., Franzetti, P., Scodeggio, M., Boselli, A., & Pierini, D. 2000, A&A, 361, 863
- (54) Gebhardt, K., et al. 1996, AJ, 112, 105
- (55) Gerbal, D., Lima Neto, G.B., Marquez, I., & Verhagen, H. 1997, MNRAS, 285, L41
- (56) Godwin, J.G., Metcalfe, N., & Peach, J.V. 1983, MNRAS, 202, 113 (GMP)
- (57) Graham, A.W. 1996, ApJ, 459, 27
- (58) Graham, A.W. 2001, AJ, 121, 820
- (59) Graham, A.W. 2002a, ApJ, 568, L13
- (60) Graham, A.W. 2002b, MNRAS, 334, 859
- (61) Graham, A.W., & Colless, M.M. 1997, MNRAS, 295, 933
- (62) Graham, A.W., Erwin, P., Caon, N., & Trujillo, I. 2001a, ApJ, 563, L11
- (63) Graham, A.W., Erwin, P., Caon, N., & Trujillo, I. 2002a, in Galaxy Evolution: Theory and Observations, Eds., V. Avila-Reese, C. Firmani, C. Frenk, & C. Allen, RevMexAA SC, in press.
- (64) Graham, A.W., Erwin, P., Trujillo, I., & Asensio Ramos, A. 2002b, submitted
- (65) Graham, A.W., Lauer, T.R., Colless, M.M., & Postman, M. 1996, ApJ, 465, 534
- (66) Graham, A.W., Trujillo, I., & Caon, N. 2001b, AJ, 122, 1707
- (67) Grebel, E.K. 2001, ApSSS, 277, 231
- (68) Grebel, E.K., Gallagher, J.S., & Harbeck, D. 2002, AJ, in press (astro-ph/0301025)
- (69) Guzmán, R., Lucey, J.R., & Bower, R.G. 1993, MNRAS, 265, 731
- (70) Hilker, M., Kissler-Patig, M., Richtler, T., Infante, L., & Quintana, H. 1999, A&AS, 134, 59
- (71) Hilker, M., Mieske, S., & Infante, L. 2003, A&A, 397, L9
- (72) Hoessel, J.G., Oegerle, W.R., & Schneider, D.P. 1987, AJ, 94, 1111
- (73) James, P. 1991, MNRAS, 250, 544
- (74) James, P. 1994, MNRAS, 269, 176
- (75) Jerjen, H., & Binggeli, B. 1997, in The Nature of Elliptical Galaxies; The Second Stromlo Symposium, ASP Conf. Ser., 116, 239
- (76) Jerjen, H., Binggeli, B., & Freeman, K.C. 2000a, AJ, 119, 593
- (77) Jerjen, H., Kalnajs, A., & Binggeli, B. 2000b, A&A, 358, 845
- (78) Karachentsev, I.D., Karachentseva, V.E., Richter, G.M., & Vennik, J.A. 1995, A&A, 296, 643
- (79) Kent, S.M., & Gunn, J.E. 1982, AJ, 87, 945
- (80) Khosroshahi, H.G., Wadadekar, Y., & Kembhavi, A. 2000, ApJ, 533, 162
- (81) Kodaira, K., Okamura, S., & Watanabe, M. 1983, ApJ, 274, L49
- (82) Komiyama, Y., et al. 2002, ApJS, 138, 265
- (83) Komossa, S., Burwitz, V., Hasinger, G., Predehl, P., Kaastra, J.S., & Ikebe, Y. 2003, ApJ, 582, L15
- (84) Kormendy, J. 1977, ApJ, 218, 333
- (85) Kormendy, J. 1985, ApJ, 295, 73
- (86) La Barbera, F., Busarello, G., Merluzzi, P., Massarotti, M., & Capaccioli, M. 2002, ApJ, submitted (astro-ph/0212294)
- (87) Lauer T.R., et al. 1995, AJ, 110, 2622
- (88) Makino, J. Akiyama, K., & Sugimoto, D. 1990, PASJ, 42, 205
- (89) Makino, J., & Ebisuzaki, T. 1996, ApJ, 465, 527
- (90) Matthews, L.D., et al. 1999, AJ, 118, 208
- (91) Merritt, D. 2003, in Carnegie Observatories Astrophysics Series, Vol. 1: Coevolution of Black Holes and Galaxies, ed., L.C. Ho (Cambridge: Cambridge Univ. Press)
- (92) Michard, R. 1985, A&AS, 59, 205
- (93) Mobasher, B., Guzmán, R., Aragón-Salamanca, A., & Zepf, S. 1999, MNRAS, 304, 225
- (94) Möllenhoff, C., & Heidt, J. 2001, A&A, 368, 16
- (95) Odell, A., Schombert, J., & Rakos, K. 2002, AJ, 124, 3061
- (96) Papaderos, P., Loose, H.-H., Thuan, T.X., & Fricke, K.J. 1996, A&AS, 120, 207
- (97) Phillips, A.C., Illingworth, G.D., MacKenty, J.W., & Franx, M. 1996, AJ, 111, 1566
- (98) Poggianti, B.M. 1997, A&AS, 122, 399
- (99) Prugniel, P., & Simien, F., 1997, A&A, 321, 111
- (100) Prugniel, P., Bica, E., & Alloin, D. 1992, in Morphological and Physical Classifications of Galaxies, ed. G.Busarello, G.Longo, M.Capaccioli, Springer Verglag, Berlin, p.261
- (101) Ravindranath, S., Ho, L.C., Peng, C.Y., Filippenko, A.V., & Sargent, W.L.W. 2001, AJ, 122, 653
- (102) Rest, A., et al. 2001, AJ, 121, 2431
- (103) Ryden, B.S., Terndrup, D.M., Pogge, R.W., & Lauer, T.R. 1999, ApJ, 517, 650
- (104) Sandage, A., & Binggeli, B. 1984, AJ, 89, 919
- (105) Schlegel, D.J., Finkbeiner, D.P., & Davis, M. 1998, ApJ, 500, 525
- (106) Schombert, J.M. 1986, ApJS, 60, 603
- (107) Schombert, J.M., Pildis, R.A., Eden, J.A., Oemler, A.Jr. 1995, AJ, 110, 2067
- (108) Schwarzkopf, U., & Dettmar, R.-J. 1997, AGM, 13, 238
- (109) Scodeggio, M. 2001, AJ, 121, 2413
- (110) Sérsic, J.L. 1968, Atlas de galaxias australes
- (111) Shao, Z., Maddox, S.J., Jones, J.B., & Coles, P. 2003, MNRAS, 338, 72
- (112) Stiavelli, M., Miller, B.W., Ferguson, H.C., Mack, J., Whitmore, B.C., & Lotz, J.M. 2001, AJ, 121, 1385
- (113) Terlevich, A.I., Caldwell, N., & Bower, R.G. 2001, MNRAS, 326, 1547
- (114) Terlevich, A.I., Davies, R.L., Faber, S.M., & Burstein, D. 1981, 196, 381
- (115) Tonry, J. 1981, ApJ, 251, L1
- (116) Tonry J., Blakeslee J.P., Ajhar E.A., Dressler A., 1997, ApJ, 475, 399
- (117) Tonry, J., & Davis, M. 1981, ApJ, 246, 680
- (118) Trujillo, I., Aguerri, J.A.L., Cepa, J., & Gutiérrez, C.M. 2001, MNRAS, 328, 977
- (119) Trujillo, I., Aguerri, J.A.L., Gutiérrez, C.M., Caon, N., & Cepa, J. 2002, ApJ, 573, L9
- (120) Trujillo, I., Graham, A.W., & Caon, N. 2001, MNRAS, 326, 869
- (121) Vader, J.P. 1986, ApJ, 306, 390
- (122) van Dokkum, P. 2001, PASP, 113, 1420
- (123) Vikhlinin, A., McNamara, B.R., Forman, W., Jones, C., Quintana, H., & Hornstrup, A. 1998, ApJ, 502, 558
- (124) Wirth, A., & Gallagher, J.S. 1984, ApJ, 282, 85
- (125) Young, C.K., & Currie, M.J. 1994, MNRAS, 268, L11
- (126) Young, C.K., & Currie, M.J. 1995, MNRAS, 273, 1141
- (127) Young, C.K., & Currie, M.J. 1998, A&AS, 127, 367


| Gal. | R.A. | Dec. | Vel. | Type | |
|---|---|---|---|---|---|
| km s-1 | mag | ||||
| GMP 2571 | 13:00:37 | 27:55:50.6 | 6103 | 19.81 | dE |
| GMP 2585 | 13:00:35 | 27:56:32.2 | 6898 | 18.44 | dE |
| GMP 2879 | 13:00:11 | 28:03:53.2 | 7271 | 18.05 | dE |
| GMP 2955 | 13:00:06 | 28:04:47.4 | 5069 | 19.62 | dE |
| GMP 2960 | 13:00:05 | 28:01:26.5 | 5847 | 16.78 | ? |
| GMP 2983 | 13:00:04 | 28:00:28.8 | 6360 | 20.00 | dE |
| GMP 2985 | 13:00:04 | 27:57:51.3 | 5312 | 17.87 | dE |
| GMP 3018 | 13:00:01 | 27:59:27.8 | 7477 | 19.31 | dE |
| GMP 3209 | 12:59:44 | 28:00:45.1 | 7096 | 19.37 | dE |
| GMP 3292 | 12:59:38 | 28:00:01.8 | 4955 | 17.70 | dSp |
| GMP 3406 | 12:59:30 | 28:01:13.2 | 7114 | 18.76 | dE |
| GMP 3438 | 12:59:29 | 28:01:07.7 | 5942 | 19.01 | dE |
| GMP 3486 | 12:59:25 | 27:56:02.5 | 7522 | 17.73 | ? |
| GMP 3625 | 12:59:16 | 27:53:07.7 | 6516 | 19.63 | dE |
| GMP 3629 | 12:59:16 | 27:53:55.2 | 5219 | 19.03 | dE |
| GMP 3645 | 12:59:15 | 27:53:42.4 | 6366 | 18.64 | dE |
| GMP 3806 | 12:59:03 | 27:58:27.4 | 5481 | 20.34 | dE |
| GMP 3856 | 12:58:60 | 27:59:34.5 | 6184 | 19.58 | dE |
Note. — GMP galaxy identification numbers are from the Coma catalog of Godwin, Metcalfe, & Peach (1983), as are the Right Ascension, Declination, and the photographic -band apparent galaxy magnitude () within an isophote . The recessional velocities have come from Matković & Guzmán (2003, in prep), and the morphological type has been estimated by us.
| GMP | FWHM | e,b | ||||||||||||
|---|---|---|---|---|---|---|---|---|---|---|---|---|---|---|
| 1 | 2 | 3 | 4 | 5 | 6 | 7 | 8 | 9 | 10 | 11 | 12 | 13 | 14 | 15 |
| 2571 | … | … | 22.98 | 1.82 | 1.30 | 0.17, … | 23.90 | 0.12 | 18.86 | 18.85 | 20.52 | 22.16 | 22.95 | 1.80 |
| 2585 | … | … | 22.47 | 2.82 | 1.56 | 0.48, … | … | … | 17.31 | 17.31 | 19.43 | 21.56 | 22.47 | 2.82 |
| 2879 | … | … | 22.29 | 3.14 | 2.01 | 0.16, … | 22.88 | … | 16.77 | 16.77 | 18.28 | 21.25 | 22.28 | 3.12 |
| 2955 | … | … | 22.79 | 1.80 | 1.16 | 0.56, … | … | … | 18.75 | 18.75 | 20.61 | 22.02 | 22.79 | 1.80 |
| 2960 | 20.34 | 2.96 | 20.63 | 1.27 | 1.56 | 0.06, 0.51 | … | … | 17.20 | 15.68 | 17.59 | 19.72 | 21.57 | 3.78 |
| 2983 | … | … | 23.21 | 1.79 | 1.74 | 0.14, … | 23.91 | … | 18.99 | 18.98 | 19.78 | 22.25 | 23.19 | 1.76 |
| 2985 | … | … | 22.23 | 2.74 | 1.39 | 0.38, … | 22.57 | 0.12 | 17.19 | 17.19 | 19.56 | 21.38 | 22.21 | 2.71 |
| 3018 | … | … | 22.61 | 1.98 | 1.09 | 0.03, … | 22.24 | 0.17 | 18.39 | 18.36 | 20.58 | 21.87 | 22.55 | 1.92 |
| 3209 | … | … | 22.58 | 1.64 | 1.26 | 0.18, … | 24.76 | … | 18.71 | 18.70 | 20.19 | 21.77 | 22.57 | 1.63 |
| 3292 | 20.68 | 2.12 | 21.82 | 1.23 | 2.23 | 0.04, 0.20 | 22.17 | … | 18.28 | 16.74 | 17.33 | 20.73 | 21.97 | 2.90 |
| 3406 | … | … | 22.20 | 1.84 | 1.59 | 0.31, … | 24.01 | … | 17.96 | 17.96 | 19.10 | 21.28 | 22.19 | 1.83 |
| 3438 | … | … | 22.86 | 2.33 | 1.38 | 0.05, … | 23.47 | 0.14 | 18.17 | 18.17 | 20.22 | 22.01 | 22.84 | 2.31 |
| 3486 | 21.49 | 4.29 | 20.23 | 0.83 | 1.59 | 0.25, 0.10 | … | … | 17.72 | 16.06 | 17.15 | 19.31 | 22.85 | 5.44 |
| 3625 | … | … | 23.62 | 2.54 | 1.38 | 0.17, … | 24.47 | … | 18.75 | 18.74 | 20.97 | 22.77 | 23.60 | 2.52 |
| 3629 | … | … | 23.22 | 2.77 | 1.29 | 0.45, … | 23.93 | 0.12 | 18.19 | 18.18 | 20.77 | 22.40 | 23.20 | 2.75 |
| 3645 | … | … | 20.98 | 1.28 | 1.62 | 0.24, … | 21.96 | 0.31 | 17.52 | 17.50 | 17.82 | 20.05 | 20.94 | 1.25 |
| 3806 | … | … | 22.99 | 1.65 | 1.07 | 0.12, … | 24.55 | 0.15 | 19.18 | 19.17 | 21.02 | 22.26 | 22.97 | 1.63 |
| 3856 | … | … | 23.25 | 2.58 | 0.94 | 0.41, … | 23.61 | … | 18.53 | 18.52 | 21.56 | 22.58 | 23.24 | 2.56 |
Note. — Column 1: GMP galaxy identification number is from the Coma catalog of Godwin, Metcalfe, & Peach (1983). Column 2 and 3: Central surface brightness and scale-length of the outer exponential component (when one was fitted). Column 4, 5, and 6: Sérsic parameters of the host galaxy (or bulge component if an outer exponential was fitted). (All of these model parameters were obtained by fitting the intermediate-axis light-profile , observed through the HST F606W filter.) Column 7: Ellipticity at , and the ellipticity at the outermost modelled data point when an outer exponential component was detected. Column 8: Magnitude of the nuclear (point-source or extended Gaussian) component. The FWHM (in arcsec) of the extended, nuclear Gaussian (before convolution with the Moffat PSF) is given in Column 9. Column 10 and 11: Magnitude of the Sérsic component and the total galaxy (including the nuclear and outer exponential component(s), if detected). Column 12 and 13: Central surface brightness, and mean surface brightness within the effective radius , of the Sérsic component. Column 14 and 15: Surface brightness at the (total) galaxy half-light radius . Assuming the Coma cluster is at a distance of 100 Mpc, and =70 km s-1 Mpc-1, 0.1=47 pc.