The Fundamental Properties of Dwarf Elliptical Galaxies in Clusters
Abstract
We present preliminary results of an extensive study of the fundamental properties of dwarf elliptical galaxies (dEs) in the Coma cluster. Our study will combine HST surface photometry with ground-based UBRIJK photometry and optical spectroscopy. The combined data set will be used to investigate the intrinsic correlations among global parameters in cluster dEs, including the Fundamental Plane, color-magnitude, Faber-Jackson’s, Kormendy’s, and velocity dispersion vs. line strength indices. These empirical correlations have provided important constraints to theoretical models of galaxy formation and evolution for “normal” ellipticals. Although dEs are the most abundant galaxy population in clusters their properties remain, however, largely unknown. Our study aims to provide an essential reference for testing current theories on the formation and evolution of dEs in clusters, and understanding their relation to more massive ellipticals.
Department of Astronomy, Bryant Space Science Center, University of Florida, Gainesville, FL 32611
Facultad de Ciencias Fisicas, Universidad Complutense de Madrid, 28040 Madrid, Spain
1. Dwarf Ellipticals: a Key Player in Galaxy Evolution?
Dwarf elliptical galaxies (dEs) are low-mass, spheroidal-like, quiescent galaxies with (see Ferguson & Binggeli 1994 for a comprehensive review). In the last decade, there has been an increased interest in dEs driven by two main results.
Firstly, there seems to be an apparent dichotomy in some empirical correlations among global galaxy parameters of dEs and normal ellipticals. For elliptical galaxies, these empirical scaling-laws between size, luminosity, surface brightness, color, velocity dispersion, and line strength indices provided: (i) a characterization of the structural, kinematic, and stellar population properties of this galaxy class; (ii) constraints to theoretical models of galaxy formation and evolution of ellipticals; and (iii) distance indicators to map the local peculiar velocity field (Terlevich et al. 1981, Djorgovski & Davis 1987; Guzmán et al. 1993). Initial studies of Local Group galaxies showed that dEs exhibit different correlations (e.g., luminosity vs. surface brightness) suggesting different physical processes during formation and/or evolution (e.g., Wirth & Gallagher 1984; Kormendy 1985; Bender, Burstein & Faber 1992).
Secondly, recent theoretical models of galaxy formation and evolution have highlighted the potential importance of dEs in modern cosmology. For instance, in field galaxy studies, dEs have been proposed as the faded counterparts of the ubiquitous low-mass starbursting galaxies at redshifts whose number density greatly exceeds the non-evolution model predictions (the so-called “faint blue galaxies”, Babul & Rees 1992; Babul & Ferguson 1996). In cluster galaxies studies, dEs have been proposed to be the evolved counterparts of the numerous low-mass blue disk galaxies observed in clusters at 0.5 (e.g., the so-called “galaxy harassment” scenario; Moore, Lake & Katz 1998). In particular, the galaxy harassment model makes very specific predictions on the number density, kinematics, and stellar population properties of dEs located in the inner and outer areas of clusters which can be directly tested with observations.
Despite their potential cosmological importance, and the fact that they are the most numerous galaxy type in the local universe —at least in clusters—, dEs are among the most poorly studied due to their characteristic low surface brightness (22 SBe 26 B-mag/arcsec2). A summary of the current sample size of dEs for which various photometric and spectroscopic properties have been studied is given below:
-
•
integrated photometry (e.g., colors and magnitudes): dEs mainly in Coma, Virgo, and Fornax clusters (e.g., Binggeli & Cameron 1991; Vader & Chaboyer 1994; Ulmer et al. 1996, Secker, Harris & Plummer 1997; Terlevich, Caldwell & Bower 2001).
-
•
surface photometry (e.g., size, surface brightness, and luminosity profile): dEs mainly in the Virgo and Coma clusters (e.g., Binggeli & Cameron 1991; Ferguson 1992; Young & Currie 1998).
-
•
line strength indices (e.g., H, Mg2, and Fe): dEs in Coma, Virgo, Fornax and the Local Group (e.g., Brodie & Huchra 1991; Held & Mould 1994; Gorgas et al. 1997; Secker et al. 1998; Mobasher et al. 2002).
-
•
internal kinematics (e.g., velocity dispersion, and rotation): dEs in Virgo and the Local Group (e.g., Bender & Nieto 1990; Peterson & Caldwell 1993; Pedraz et al. 2001; Simien & Prugniel 2002; Geha et al. 2002).
We are currently conducting en extensive study of 100 dEs located in the inner and outer regions of the Coma cluster using HST/WFPC2(ACS) and WIYN/HYDRA. This study aims to provide the first large, homogeneous data set of photometric and spectroscopic parameters of dEs outside the Local Group, including luminosity, size, surface brightness, velocity dispersion, mass-to-light ratio, optical and infrared colors, and line strength indices. Our goals are: (i) to investigate the relation between dEs and elliptical galaxies in clusters; and (ii) to test galaxy harassment model predictions on the structural, stellar population, and kinematic properties of cluster dEs, and their dependence on the environment.
2. The Data
2.1. Sample Selection
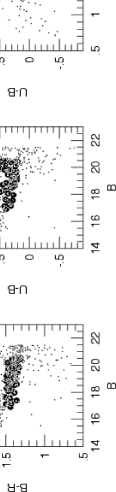
Coma cluster dE-candidates were chosen using U, B, and R images obtained with WIYN/MiniMo and INT/Wide Field Camera. The criteria used for the sample selection can be summarized as: (i) , and in order to minimize contamination from background field disk galaxies at z0.2; and (ii) to select galaxies with , approximately at the distance of the Coma cluster. Figure 1 illustrates these criteria. A detailed description is provided in Matković & Guzmán (in prep).
The projected surface density of dE-candidates in the inner region (1∘ from the cluster center) is 700 per square degree. In the outer region (between 1∘ and 2.5∘ from the cluster centre) the projected surface density is 100 per square degree. These densities are ideal for large FOV multiobject spectrographs, such as WIYN/HYDRA. The selection criteria turned out to be remarkably reliable: about 90% of dE-candidates observed with HYDRA are spectroscopically confirmed to be cluster members.
2.2. WIYN/HYDRA Spectroscopy
Spectra of 50 dEs and 20 Es in the Coma cluster region were obtained using HYDRA at the WIYN telescope. The instrumental setup adopted for these observations provided a spectral resolution of FWHM = 130 km/s with a 3 arcsec fiber diameter. The spectral rest-frame wavelength ensured observations of strong absorption features such as H, G-band, H, H, Mg2, and Fe5350. The total integration time ranged from 1hr to 9hr, depending on the galaxy magnitude. Figure 2a shows a representative example of WYIN/HYDRA spectra. Velocity dispersion () measurements were measured using the Fourier quotient method as described by González (1994). The values measured for our dE and E samples range from 30 to 100 km/s. A full description of the spectroscopic measurements and the data reduction is provided in Matković & Guzmán (in prep).
2.3. HST Imaging
About 60 archival HST/WFPC2 F606W images of 20 different fields in the inner region of the Coma cluster were investigated. Eighteen Coma dE candidates in our sample were identified in these HST images. The images were reduced following the standard HST pipeline. The most difficult step in the data reduction is to ensure an accurate background subtraction since many dE galaxies are affected by the large, extended halos of more massive cluster galaxies. This was achieved using a wavelet decomposition method that optimally removes any large-scale structure in the background due to the contamination of nearby galaxy halos. Figure 2b shows a panel with 4 HST F606W images of dE galaxies in Coma. For a full account of the data reduction procedure see Graham & Guzmán (2002).

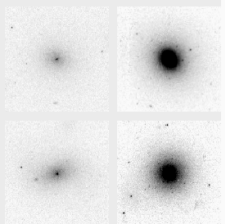
Photometry was performed using the IRAF task ELLIPSE and the resulting surface brightness profiles were fitted with a combination of a PSF-convolved Sérsic model and either a point source or a PSF-convolved central Gaussian (Graham & Guzmán 2002). This provided measurements of the half-light radius (), the effective surface brightness (), the Sérsic index (), and the total galaxy magnitude. Nucleation was detected in all but two of our final 15 dE galaxy sample. Our error estimates include the effects of: shot-noise, placement on the chip, estimation of the galaxy orientation and center, and the associated influence of pixelation. In all cases when we had multiple light-profiles, which we did for most galaxies, the surface brightness profiles were consistent with each other down to a level of mag arcsec-2. Fitting models down to this surface brightness level we found the differences in the best-fitting Sérsic parameters obtained from different profiles of the same galaxy spanned 0.05 mag arcsec-2 in , 5% in , and 4% in .
Figure 3 shows the surface brightness profiles for 9 Coma dEs in our sample.


3. Is there a “Dichotomy” in the Structural Properties of dE and E Galaxies?
The realization that dwarf ellipticals could be reasonably well described with an exponential function (i.e., ) and that bright ellipticals are better fit with de Vaucouleurs’ -law (i.e., ) led to the notion that they are two distinct families of galaxies (Faber & Lin 1983; Binggeli, Sandage & Tarenghi 1984; Wirth & Gallagher 1984, but see Graham 2002). One of the most referenced papers to support this view is Kormendy (1985). Plotting central surface brightness () against luminosity, Kormendy showed two relations almost at right angles to each other: one for the faint dE galaxies and the other for the more luminous E galaxies. Similarly, diagrams using the surface brightness at the effective half-light radius () also show two somewhat perpendicular relations. These diagrams are shown in Figure 4 for a large sample of 247 dE and E galaxies. The symbols represent the following samples: dots correspond to Binggeli & Jerjen (1998) dE sample; triangles correspond to Stiavelli et al. (2001) dE sample; large stars represent our Coma dE galaxies; asterisks represent intermediate to bright E galaxies from Caon et al. (1993); and open and solid circles represent the so-called “power-law” and “core” E galaxies, respectively, from Faber et al. (1997). Panels (a) (cf. Wirth & Gallagher 1984) and (g) (cf. Kormendy 1985) illustrate the two most widely accepted results supporting the dichotomy between the structural properties of bright Es and dEs.
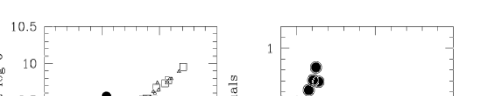
The structural dichotomy is also apparent when studying the fundamental plane (Djorgovski & Davies 1987). Figure 5a shows the edge-on projection of the fundamental plane for various samples of E and dE galaxies. Our sample of 14 Coma cluster dEs used in this preliminary study more than doubles the number of objects in previous samples used for fundamental plane studies of dEs in the literature. Clearly, dE galaxies lie off and above the relation defined by “normal” Es (cf. Bender, Burstein & Faber 1992).
In order to reasses critically the evidence for a physical discontinuity in the structural properties of E and dEs galaxies we note the following three important facts. Firstly, the observed difference in the fundamental plane, , and diagrams are not independent results but simply three different ways to plot the same effect. For instance, the solid line plotted in Figure 5b is not a fit to the data but the same trend defined by dEs in Figure 4a transformed using the empirical framework of galaxy properties described by Guzmán, Lucey & Bower (1993).
Secondly, in contrast to the above, there is substantial evidence for a continuity, rather than a dichotomy, between the alleged E and dE classes of galaxies. Caldwell (1983; their Figure 6) showed that, fainter than , there is a continuous trend between the central surface brightnesses and absolute magnitudes of dE and E galaxies – more luminous galaxies have brighter central surface brightnesses (see also Caldwell 1987; Caldwell and Bothun 1987; Hilker et al. 1999). Caldwell (1983) also revealed a continuous and linear relationship exists between () color and luminosity over the magnitude interval (see also Terlevich, Caldwell, & Bower 2001). Caldwell & Bothun (1987) further revealed a continuous luminosity–metallicity relation across the alleged dE and E classes (see also Terlevich et al. 1981). The relation between luminosity and velocity dispersion for E galaxies (Faber & Jackson 1976) has also been shown to extend linearly to include the dE galaxies (e.g., Bender, Burstein, & Faber 1992). None of these correlations with luminosity suggest evidence for a discontinuity at which apparently denotes the transition between two distinct galaxy classes (E and dE).
Thirdly, in Graham & Guzmán (2002) we demonstrate that if the luminosity-profile shape () and the central surface brightness-profile shape correlations () are universal, then the change in slope observed in the relation (Figure 4a) for Es and dEs can be easily explained as a result of the continuous change in the profile shapes (i.e., ) from dEs to Es. This means that the observed change of slope in the relation is a mere artifact resulting from the choice of parameters and does not have any physical implications for a different formation mechanism at play in E and dE galaxies. The key question is thus: are the —or the — and relations really universal (i.e., the same for E and dE galaxies)?
The and diagrams for our sample of 247 galaxies shown in Figures 4c and 4f reveal a well-defined, universal correlation in both cases spanning over 10 magnitudes. However, bright Es with do deviate from the general trend defined by both dE and E galaxies in the diagram111Note that the sample of E galaxies with from Faber et al. (1997) used in this work did not have Sérsic index measurements and thus could not be included in the diagram.. All these bright E galaxies are classified as “core” ellipticals by Faber et al. (1997). The simplest physical interpretation of this behaviour is that both dE and E galaxies do follow the same universal correlations till the onset of core formation in the brightest elliptical galaxies. The observed cores in these luminous elliptical galaxies are thought to have arisen from the partial evacuation of the nuclear region by coalescing blackholes (e.g., Ebisuzaki, Makino, & Okumura 1991; Makino & Ebisuzaki 1996). Due to this, or whatever process(es) that have reduced these galaxies central surface brightness profiles, the high luminosity core ellipticals clearly depart from this relation. Thus bright Es with are the exception —not the rule— to the universality in the structural correlations of spheroidal systems and current models of bright elliptical galaxies built from the merging of fainter spheroidal components must not assume that the scaling laws defined by the bright ellipticals apply to the pre-merged components. A full account of the results of this study can be found in Graham & Guzmán (2002), Guzmán et al. (in prep.), and Matković & Guzmán (in prep.).
Acknowledgments.
R.G. would like to thank the organizing committee for such an excellent meeting to honor our friend Roberto, both from the point of view of the outstanding scientific results presented at the meeting and the superb atmosphere of camaraderie. As Roberto likes to say: “there is nothing like doing good science among friends”.
References
Babul, A., & Ferguson, H.C., 1996, ApJ, 458, 100
Babul, A., & Rees, M., 1992, MNRAS, 255, 346
Bender, R., Burstein, D., & Faber, S.M. 1992, ApJ, 399, 462
Bender, R., & Nieto, J. L., 1990, A&A, 239, 97
Binggeli, B., & Cameron, L. M., 1991, A&A, 252, 27
Binggeli, B., & Jerjen, H. 1998, A&A, 333, 17
Binggeli, B., Sandage, A., & Tarenghi, M. 1984, AJ, 89, 64
Brodie, J. P., & Huchra, J. P., 1991, ApJ, 379, 157
Caldwell, N., 1983, AJ, 88, 804
Caldwell, N., 1987, AJ, 94, 1116
Caldwell, N., & Bothun, G. D., 1987, AJ, 94, 1126
Caon, N., Capaccioli, M., & D’Onofrio, M. 1993, MNRAS, 265, 1013
Djorgovski, S., & Davis, M., 1987, ApJ, 313, 59
Ebisuzaki, T., Makino, J., & Okamura, S. K., 1991,
Faber, S. M., & Jackson, R. E., 1976, ApJ, 204,668
Faber, S. M., & Lin, D. N. C., 1983, ApJ, 266, 17
Faber, S. M., et al. 1997, AJ, 114, 1771
Ferguson, H. C., 1992, MNRAS, 255, 389
Ferguson, H. C., & Binggeli, B., 1994, A&A Review, 6, 67
Geha, M., Guhathakurta, P., & van der Marel, R., 2002, astro-ph/0206153
González, J. 1994, Ph. D. Thesis, University of California, Santa Cruz
Gorgas, J., Pedraz, S., Guzmán, R., Cardiel, N., & Gonzalez, J. J., 1997, ApJ, 481, 19
Graham, A.W. 2002, ApJ, 568, L13
Graham, A.W., & Guzmán, R. 2002, AJ, submitted
Guzmán, R., Lucey, J. R., & Bower, R.G. 1993, MNRAS, 265, 731
Guzmán, R. 1994, Ph. D. Thesis, Durham University
Held, E. V., & Mould, J. R., 1994, AJ, 107, 1307
Hilker, M., Kissler-Patig, M., Richtler, T., Infante, L., & Quintana, H. 1999, A&AS, 134, 59
Kormendy, J. 1985, ApJ, 295, 73
Makino, J., & Ebisuzaki, T., 1996, ApJ, 465, 527
Mobasher, B., et al. 2002, Cat, 21370279
Moore, B., Lake, G., & Katz, N., 1998, ApJ, 495, 139
Pedraz, S., Gorgas, J., Cardiel, N., Sanchez-Blazquez, P., & Guzmán, R. 2002, MNRAS, 332, L59
Peterson, R. C., & Caldwell, N., 1993, AJ, 105, 1411
Secker, J.,Harris, W. E., Cote, P., & Oke, J.B., 1998, in UCB proceedings, Photometry And Spectroscopy of Coma Dwarf Ellipticals, (Marseilles, France), 115
Secker, J., Harris, W. E., & Plummer, J. D., 1997, PASP, 109, 1377
Simien, F., & Prugniel, P., 2002, A&A, 384, 371
Stiavelli, M., Miller, B. W., Ferguson, H. C., Mack, J., Whitmore, B. C., & Lotz, J.M. 2001, AJ, 121, 1385
Terlevich, A. I., Caldwell, N., & Bower, R. G. 2001, MNRAS, 326, 1547
Terlevich, A. I., Davies, R.L., Faber, S. M., & Burstein, D. 1981, 196, 381
Ulmer, M. P., Bernstein, G. M., Martin, D.R., Nichol, R. C., Pendelton, J. L., & Tyson, J. A., 1996, AAS, 189, 2903
Vader, J. P., & Chaboyer, B. 1994, AJ, 108, 1209
Wirth, A., & Gallagher, J.S., 1984, ApJ, 282, 85
Young, C.K., & Currie, M.J. 1998, A&AS, 127, 367
Discussion
Kauffmann: Can you comment on the environmental dependence on
the structural parameters?
Guzmán: The galaxy harassment model makes very specific
predictions about the environmental effect on the structure of dE
galaxies. For instance: (i) only the densest dEs will survive in the
inner part of the cluster; (ii) an indirect correlation between
density and metallicity (e.g., as a result of a mass-metallicity
relation) will create a gradient in metallicity of dEs with
clustercentric distance; (iii) since nucleated dEs will be more robust
than those without a nucleus, the fraction of nucleated dEs will
increase toward the cluster centre; (iv) nucleated dEs will show a
higher central velocity dispersion than non-nucleated dEs.
Moss: Besides considering the proposed scenario of galaxy
harassment for the origin of dwarf ellipticals have you considered mergers
of HII galaxies as their possible origin?
Guzmán: This is a plausible alternative scenario. Indeed, an
evolutionary connection between HII galaxies and dE galaxies has been
proposed by several authors. However, to the best of my knowledge, such
an evolutionary scenario lacks a well-constructed theoretical model whose
predictions we can readily test with our dataset.
Zinnecker: Do you think all the progenitors to nucleated dwarf
ellipticals survived to the present day, and if not, where are these dense
nuclei now?
Guzmán: If they do not, this would be indeed a most
interesting puzzle. The derived luminosities of the nuclei in our dE
sample are of the order of - . Perhaps, as you
argue in your talk, they may become the massive W-Cen-like globular
clusters in more massive galaxies.