Abstract
Virialized systems, such as clusters and groups of galaxies, represent an ideal laboratory for investigating the formation and evolution of structure on the largest scales. Furthermore, the properties of the gaseous intracluster medium provide key insights into the influence of important non-gravitational processes like energy injection and radiative cooling, resulting from feedback associated with star formation, for example.
We have assembled a very large X-ray sample of virialized systems, spanning over two decades in halo mass. Each object has high-quality X-ray data available, enabling a full deprojection analysis to be made; for a subsample we have additionally determined the deprojected optical light distribution.
We find clear evidence of a departure from the simple expectations of self-similarity. The intracluster medium is more spatially extended and systematically less dense in smaller haloes, and there is evidence of an entropy excess in the hot gas. Our results favour a significant role for both non-gravitational heating and radiative cooling in modifying the properties of this gas, although we find no clear evidence of significantly enhanced star formation efficiency in groups.
Chapter 0 The X-ray Scaling Properties of Virialized Systems
1 Introduction
Simple models of the collapse and subsequent formation of virialized systems predict that such objects will exhibit self-similarity in their behaviour (e.g. Navarro et al. 1995). Shock heating of the intracluster gas, driven by gravitational infall, establishes the X-ray properties of these systems, such that they scale simply with the total mass of the halo. This leads to the expectation of a constant, universal gas fraction in virialized systems. Additionally, assuming haloes form from material of fixed density, a number of well defined scaling relations can be derived.
However, it is now clear that the presence of additional physics is required to provide a more complete picture of the state of the gas. The well studied relation between X-ray luminosity and mean temperature exhibits a logarithmic slope steeper than expected () in clusters (e.g. Edge & Stewart 1991; Arnaud & Evrard 1999). Further steepening is observed at group scales (e.g. Helsdon & Ponman 2000). Recent work has focused on the role of non-gravitational heating (e.g. Babul et al. 1999; Tozzi & Norman 2001) and radiative cooling (e.g. Muanwong et al. 2001; Voit & Bryan 2001) of the gas in explaining the observed departures from self-similarity.
However, existing observations have been unable to discriminate between these competing theories, since both heating and cooling of gas can give rise to a reduction in central density and a suppression of X-ray luminosity in the central regions of cooler systems. In this short paper we present an overview of an ongoing project to study a large sample of virialized systems, in order to establish their scaling properties and address the issue of self-similarity breaking and its causes.
Throughout this paper we assume a Hubble constant of 70 km s-1 Mpc-1.
2 The sample
Our sample incorporates rich clusters of galaxies, through groups and included two galaxy-sized haloes, comprising 66 objects in total. For each system we have fitted analytical profiles to describe the deprojected density and temperature of the intracluster medium (ICM) as a function of radius. We have excluded from our sample those systems with obvious evidence of X-ray substructure, where the assumption of hydrostatic equilibrium is not reasonable. The redshift range spanned is 0.0036–0.208 (0.035 median).
Our analysis combines three existing samples, based on ROSAT and ASCA data, and a detailed description of our method can be found in Sanderson et al. (2003). With these data we are able to determine the gravitating mass profile, virial radius and other derived quantities in a self-consistent fashion. For a subset of 32 groups and clusters, we have also measured the distribution of the galaxies themselves (using the APM catalogue), allowing us to calculate the stellar mass contribution (Sanderson & Ponman 2003b). We convert optical light to stellar mass, assuming a mass-to-light ratio for early-type galaxies of 7 Solar in the band (Pizzella et al. 1997).
3 Results
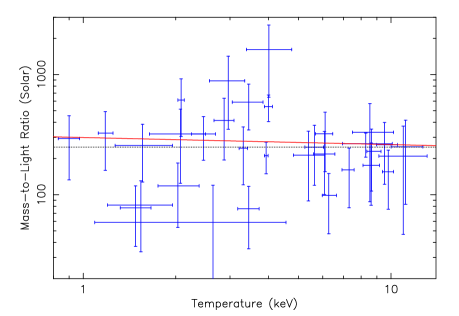
1 Gas fraction & mass-to-light ratio
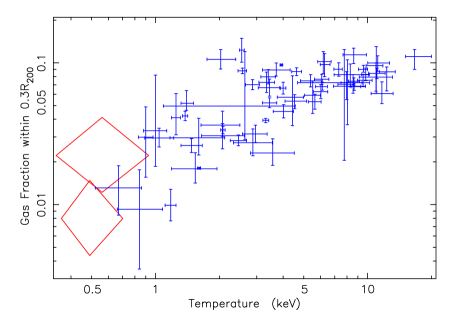
There is a strong (6) trend in gas fraction within 0.3R200 with system temperature (left panel, Figure 1), implying that groups and cool clusters are not self-similar compared to rich clusters. This depletion of gas in cooler systems could be due to:
-
•
Preheating: the energetically boosted ICM is progressively more weakly captured by the less massive haloes of cooler systems
-
•
Radiative cooling: gas drops out to form stars; a process which is more efficient in the cooler & denser ICM of groups.
From our optical analysis we have derived the band mass-to-light ratio for a subset of 32 groups and clusters, which is plotted against X-ray temperature in the right panel of Figure 1. The red solid line represents the best fitting power law, which has a logarithmic slope of . The black dotted line shows the median value for the sample, of 249 . It is clear that there is no significant trend in , indicating that star formation efficiency does not vary substantially with halo mass.
2 Spatial mass distribution
The X-ray data enable both the gas and total mass density profiles to be determined. Our optical sub-sample yields the stellar baryon contribution, and therefore allows the dark matter distribution to be inferred. Density profiles for the individual cluster mass components are plotted in Figure 2 as a function of scaled radius (i.e. normalized to our nominal virial radius, ). The profiles have been grouped into five temperature bands for clarity, with approximately the same number of profiles in each band.
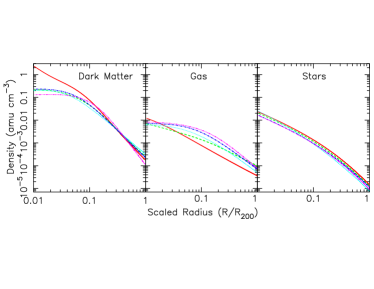
The dark matter is the most self-similar component, showing no systematic trend with temperature, but for an enhancement in central concentration within for the coolest temperature band (0.3–2.0 keV). The intracluster gas is clearly not self-similar and shows a significant decrease in density with decreasing temperature. The stellar distribution shows a surprisingly self-similar shape across the sample, with a small spread in normalization; there is some evidence for a mild enhancement in the stellar density in the two coolest bands.
Comparison between the three panels in Figure 2 reveals that the gas is the most spatially extended mass component, followed by the stars and dark matter, in agreement with the findings of David et al. (1995).
3 Gas entropy
Since entropy is conserved in any adiabatic process, it serves as an excellent probe of non-gravitational physics, increasing in proportion to the virial temperature of a cluster for the self-similar case. It is defined, for convenience, as
| (1) |
where is the electron number density of the gas and is its temperature.
The entropy at a fiducial radius of 0.1R200 is plotted against system temperature in the left panel of Figure 3. The solid green line is the best fit to the data, which has a logarithmic slope of . This relation is significantly shallower than the self-similar slope of unity, normalized to the mean of the hottest 8 clusters and plotted as the solid black line. The entropy ‘floor’ (Ponman et al. 1999) value of 124 keV cm2 from Lloyd-Davies et al. (2000) is shown as the magenta horizontal line, but it is not clear if this represents a true lower limit to the entropy in galaxy groups, since the overall trend is flatter than for all temperatures. In general, the data appear to be more consistent with radiative cooling models (e.g. Voit & Bryan 2001) than preheating ones, which predict for more massive clusters.
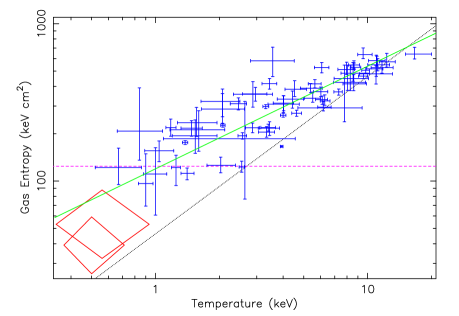
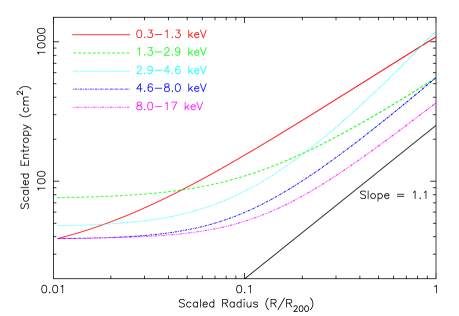
The right panel of Figure 3 shows entropy (scaled by mean temperature) as a function of radius for the sample, grouped into five temperature bands to suppress scatter. The shape of the profiles is broadly similar, but they are shifted in normalization such that the cooler systems posses a higher scaled entropy. However, there is no evidence for a large isentropic core in any of the profiles, which would be expected if the extra entropy was injected by some non-gravitational heating mechanism (e.g. Balogh et al. 1999). These findings are confirmed by a recent analysis of two galaxy groups using XMM-Newton; Mushotzky et al. (2003) find no evidence for an entropy floor within , which would otherwise be expected if their hot gas had been preheated prior to virialization.
Furthermore, it is clear from the right panel of Figure 3 that the excess entropy is present at all radii, and not just in the central regions. However, for all the profiles, the entropy in the outskirts of the halo appears consistent with the expectations of shock heating of accreting gas, which lead to a logarithmic slope of 1.1 (Tozzi & Norman 2001), as shown by the black solid line in the right panel of Figure 3.
The entropy properties of the sample are examined more thoroughly in Ponman et al. (2003).
4 Conclusions
We have studied the scaling properties of a large sample of virialized systems, spanning a wide range of mass. We find clear evidence of a departure from self-similarity in the properties of the hot gas in these systems: Groups have substantially lower gas fractions than clusters, and there is evidence of excess entropy in the intracluster medium on all mass scales. Our entropy results are inconsistent with the predictions of preheating models, and provide a better match to models incorporating the effects of radiative cooling and feedback from subsequent star formation.
However, we do not find significant variation in mass-to-light ratio with mass, implying that star formation efficiency is not greatly enhanced in groups. This demonstrates that radiative cooling cannot be the only mechanism responsible for the departure from self-similarity; non-gravitational heating of the gas must also have had some influence.
We are grateful to Alexis Finoguenov, Ed Lloyd-Davies and Maxim Markevitch for providing X-ray data and contributing to the original analysis.
References
- [1] Arnaud M. & Evrard A. E., 1999, MNRAS, 305, 631
- [2] Balogh M. L., Babul A. & Patton D. R., 1999, MNRAS, 307, 463
- [3] David L. P., Jones C. & Forman W., 1995, ApJ, 445, 578
- [4] Edge A. C. & Stewart G. C., 1991, MNRAS, 252, 414
- [5] Helsdon S. F. & Ponman T. J., 2000, MNRAS, 315, 356
- [6] Lloyd-Davies E. J., Ponman T. J. & Canon D. B., 2000, MNRAS, 315, 689
- [7] Muanwong O., Thomas P. A., Kay S. T., Pearce F. R. & Couchman H. M. P., 2001, ApJ, 552, L27
- [8] Mushotzky, R., Figueroa-Feliciano, E., Loewenstein, M. &Snowden, S. L., 2003, preprint (astro-ph/0302267)
- [9] Navarro, J. F., Frenk, C. S. and White, S. D. M., 1995, MNRAS, 275, 720
- [10] Pizzella A., Amico P., Bertola F., Buson L. M., Danziger I. J., Dejonghe H., Sadler E. M., Saglia R. P., de Zeeuw P. T. & Zeilinger W. W., 1997, A&A, 323, 349
- [11] Ponman T. J., Cannon D. B. & Navarro J. F., 1999, Nature, 397, 135
- [12] Ponman T. J., Sanderson A. J. R. & Finoguenov A., 2002, MNRAS, submitted
- [13] Sanderson A. J. R., Ponman T. J. & Finoguenov A., Lloyd-Davies E. J. & Markevitch M., 2003, MNRAS, in press (astro-ph/0301049)
- [14] Sanderson A. J. R. & Ponman T. J., 2003b, MNRAS, submitted
- [15] Tozzi P. & Norman C., 2001, ApJ, 546, 63
- [16] Voit G. M., & Bryan G. L., 2001, Nature, 414, 425