Chandra Observations of the Mice
Abstract
Presented here are high spatial and spectral resolution Chandra X-ray observations of the famous interacting galaxy pair, the Mice, a system similar to, though less evolved than, the well-known Antennae galaxies. Previously unpublished ROSAT HRI data of the system are also presented.
Starburst-driven galactic winds outflowing along the minor axis of both galaxies (but particularly the northern) are observed, and spectral and spatial properties, and energetics are presented. That such a phenomenon can occur in such a rapidly-evolving and turbulent system is surprising, and this is the first time that the very beginning the onset, of starburst-driven hot gaseous outflow in a full-blown disk-disk merger has been seen.
Point source emission is seen at the galaxy nuclei, and within the interaction-induced tidal tails. Further point source emission is associated with the galactic bar in the southern system. A comparison of the source X-ray luminosity function and of the diffuse emission properties is made with the Antennae and other galaxies, and evidence of a more rapid evolution of the source population than the diffuse component is found. No evidence for variability is found between the Chandra and previous observations.
keywords:
galaxies: individual: NGC4676 galaxies: starburst galaxies: ISM galaxies: haloes X-rays: galaxies ISM: jets and outflows1 Introduction
Though galaxies were once thought of as ‘Island Universes’, evolving slowly in complete isolation, this is now known not to be the case. Galaxies interact in a wide variety of ways with their environment, and collisions and mergers of galaxies are now believed to be one of the dominant mechanisms in galactic evolution (Schweizer 1989). There are probably very few galaxies today that were not shaped by interactions or even outright mergers. Indeed, Toomre’s (1977) hypothesis, whereby elliptical galaxies might be formed from the merger of two disc galaxies, is now generally accepted, such behaviour having been modelled in many N-body simulations of mergers (e.g. Toomre & Toomre 1972; Barnes 1988). During such an encounter, the conversion of orbital to internal energy causes the two progenitor disks to sink together and coalesce violently into a centrally condensed system. The ‘Toomre sequence’ (Toomre 1977) represents probably the best examples of nearby ongoing mergers, from disk-disk systems to near-elliptical remnants.
One of these is the famous binary interacting system NGC4676A/B (also Arp242). First described by Vorontsov-Vel’yaminov (1957) as a pair of “playing mice”, ever since, the name ‘the Mice’ has become universally accepted. It consists of two distinct spiral galaxies (the edge-on NGC4676A to the north, and the more face-on NGC4676B to the south) with long tidal tails, and the presence of these, along with an obvious bridge between the two galaxies and an increase in IR activity compared to typical field galaxies, indicates that the galaxies have begun to interact, and have passed one another. It is one of the original systems presented by Toomre & Toomre (1972) as a classic example of a pair of galaxies undergoing tidal interaction. It lies second in the proposed evolutionary sequences of both Toomre (1977) the Toomre sequence, and of Hibbard & van Gorkom (1996). It is also placed second in the first study of the X-ray properties of an evolutionary sample of merging galaxies; the ROSAT work of Read & Ponman (1998) (hereafter RP98).
The systematic velocity of the system appears well-defined in several different regions of the electromagnetic spectrum (e.g. Stockton 1974; Smith & Higdon 1994; Hibbard & van Gorkom 1996; Sotnikova & Reshetnikov 1998), and this converts, assuming = 75 km s-1 Mpc-1, to the distance to the Mice used in this paper; 88 Mpc. It is generally agreed, using both kinematical work (e.g. Toomre & Toomre 1972; Mihos, Bothun & Richstone 1993) and multiwavelength observations (e.g. Hibbard & van Gorkom 1996), that both galaxies are in the throes of a prograde encounter, and have their northern edges moving away from us. Hence, NGC4676A’s tail is on the very furthest side, swinging away from us (the tail has a systematic velocity almost 300 km s-1 faster than the NGC4676A nucleus; Sotnikova & Reshetnikov 1998), and NGC4676B is rotating clockwise, with its northeastern edge lying closest to us.
Both galaxies appear (e.g. from the optical data of Schombert, Wallin & Struck-Marcell 1990) to have shapes and colours consistent with those of early-type spirals, though the disc regions are strongly distorted or absent. Both tails, although bluer than the galaxies’ central colours, are in agreement with the colours of outer-disc regions. The northern tail has a very high surface brightness ( per square arcsecond) when compared with similar features in other galaxies, whereas the southern tail is roughly 1 magnitude per square arcsecond fainter (Schombert et al. 1990). The tails account for 16% of the total emission, are quite luminous, containing one-third of the total R-band luminosity of the system, and have a high atomic gas content (Hibbard & van Gorkom 1996). Local maxima are also observed in the northern tail (Sotnikova & Reshetnikov 1998). The northern galaxy appears to exhibit a 6.6 kpc plume of along its minor axis, and the southern galaxy possesses an ionized gas bar, as produced in Barnes & Hernquist’s (1991, 1996) merger simulations, offset with respect to the stellar bar (Hibbard & van Gorkom 1996). Angular momentum transfer between the two bars is able to force large amounts of gas towards the galactic centre. Recent mapping of the CO emission in the Mice (Yun & Hibbard 2001) detect a compact (2 kpc), disklike or ringlike complex, perhaps accounting for 20% of the total nuclear mass, centered on the inner stellar disk of NGC4676A, with kinematics consistent with simple rotation. Within NGC4676B, the CO emission is far less bright and occurs along the 7 kpc stellar bar.
A very relevant work is the set of papers dealing with the Chandra X-ray emission from the Antennae (Fabbiano, Zezas & Murray 2001, Zezas et al. 2002, Zezas & Fabbiano 2002), a very similar system to the Mice, in that it involves the merger of two equal-sized gas rich spiral galaxies. The Antennae however lie at a later evolutionary epoch, in that the two galactic disks have begun to interact violently with each other. Also, the Antennae lie at a much closer distance than the Mice, aiding the detection of low luminosity sources, and decreasing the effects of source confusion. Various aspects of the two systems’ X-ray emission are compared throughout this paper.
In this paper results of a 30.5 ks Chandra ACIS-S observation of the Mice are presented. The fundamental advantage of Chandra over any other previous or current X-ray mission, is its excellent spatial resolution. With a spatial resolution some 10 times better than the ROSAT HRI and XMM-Newton, it is possible to resolve emission on scales down to 210 pc ( encircled energy PSF [on-axis at 6 keV]) at the distance of the Mice. This allows the removal of point source emission, and the analysis of any unresolved, perhaps diffuse emission. In addition, the spectral resolution of Chandra is comparable to that of ASCA, and far better than that of the ROSAT PSPC (the ROSAT HRI note, having essentially no spectral resolution whatsoever), allowing us to study the X-ray spectral properties of the sources and emission regions seen, providing additional information as to their nature.
The X-ray observations of the Mice prior to Chandra are described in the following subsection. Section 2 describes the Chandra observations and the data reduction techniques used. Discussion of the spatial, spectral and temporal properties of the source and diffuse emission components follow in Section 3, and in Section 4, the conclusions are presented.
1.1 Previous X-ray Observations
The Mice have only previously been observed in X-rays with ROSAT. The PSPC observations were described in RP98, and show rather an amorphous X-ray structure, with only one source detected, lying between the two galactic nuclei. Little could be said as regards the spectral properties of the source. The general form of the PSPC emission however, seemed to follow the optical ‘heads’ of the two galaxies, running essentially north-south, with some tentative evidence for extension in the east-west direction, especially around NGC4676A. Though only a small number of counts were obtained, the fitted temperature to the diffuse emission spectrum was seen to be in good agreement with fitted temperatures of nearby, known, starburst winds (Heckman 1993; Read, Ponman & Strickland 1997), suggesting a starburst origin for the diffuse emission.
The Mice were also observed with the ROSAT HRI. The previously unpublished results of these observations are presented here, as it serves both as a useful introduction to the system and its X-ray structure, and as a stepping-stone from the (relatively) low-resolution of the ROSAT PSPC to the high resolution of Chandra.
The 33.4 ks of ROSAT HRI data (ID 601091), taken at the end of 1997, were initially screened for good time intervals longer than 10 s. No further selection on low background times was made, as we were mainly interested in point-like sources (which the HRI is far better suited to), and for this purpose, the data were still photon-limited. Source detection and position determination was then performed over the full field of view with the EXSAS local detect, map detect and maximum likelihood algorithms (Zimmermann et al. 1994), using images of pixel size 5′′.
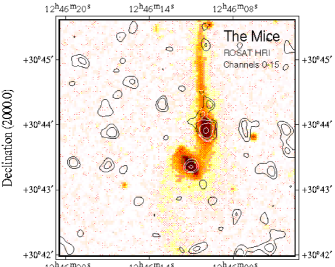
Fig. 1 shows smoothed contours of ROSAT HRI emission (over the full channel range) from the Mice superimposed on an optical Digital Sky Survey (DSS) image. Though there are very few counts, it is clearly seen that the HRI is able to resolve the PSPC emission into two distinct sources at the positions of the two galaxies. These were the only two sources detected in the vicinity of the optical galaxies. The northern source is detected (with 22 source counts at ) at a significance of 5.9 with a (0.12.4 keV) count rate of (6.81.7) counts s-1, the southern source (with 10 source counts at ) at 3.5 with a count rate of (3.11.2) counts s-1. Errors on the HRI positions are 1.41.6′′. Further, perhaps extended emission is suggested to the north and east of NGC4676A, and this is borne out by a low-significance extent within the source-searching results to the northern source’s emission.
2 Chandra observations, data reduction and results
The Mice were observed with Chandra on May 29th, 2001 for a total of just over 30 ks, with the back-illuminated ACIS-S3 CCD chip at the focus (Observation ID: 2043). Data products, correcting for the motion of the spacecraft and applying instrument calibrations, were produced using the Standard Data Processing (SDP) system at the Chandra X-ray Center (CXC). These products were then analysed using the CXC CIAO software suite (version 2.2.1). A lightcurve extracted from a large area over the entire observation was seen to be essentially constant and consistent with a low-level rate. Consequently, no screening to remove periods of high background flaring was performed.
2.1 Overall X-ray structure
Fig. 2 (left) shows contours of adaptively smoothed (0.210 keV) Chandra ACIS-S X-ray emission from the field surrounding the Mice system, superimposed on an image from the Hubble Space Telescope’s Advanced Camera for Surveys (ACS) instrument. The adaptive smoothing of the X-ray emission attempts to adjust the smoothing kernel to obtain a constant signal-to-noise ratio across the image.
Several things are immediately evident from the image. As suggested by the HRI data, the emission is resolved into two main components associated with the two galaxy ‘heads’. The factor 10 higher resolution over the HRI however, is able to shed far more light on the situation. The emission associated with NGC4676A is centered close to the galaxy nucleus, and appears predominately diffuse and extended, especially in the east-west direction (i.e. along the minor axis of the galaxy, NGC4676A being seen almost exactly edge on). The X-rays within NGC4676B appear far more centrally concentrated at the nucleus, though some evidence for extension is also seen again along NGC4676B’s minor axis (i.e. from south-east to north-west). Orthogonal to this, hotspots of X-ray emission are seen along the galaxy disk, equidistant from the nucleus, especially to the south-west. Other interesting features are seen associated with the tails, one source lying directly in the northern tail, and a further source lying to the east of the southern tail. No significant features are seen associated with the more distant, off-image tail regions. One last interesting feature is the source seen 40′′ west of NGC4676A.
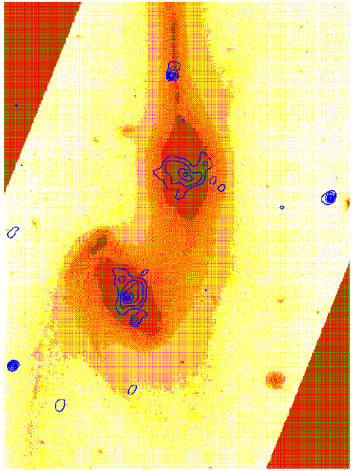
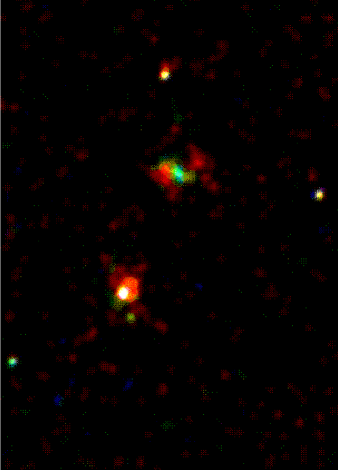
Fig. 2 (right) shows a true colour X-ray image, with red corresponding to 0.20.9 keV, green to 0.92.5 keV and blue to 2.510 keV. The individual adaptively-smoothed images were obtained as described above. The image is to the same scale as Fig. 2 (left), and all the X-ray features are visible. The northern head shows a medium energy nucleus, with cooler, complex, structured emission surrounding. The southern head is brighter and hotter than the surrounding emission which again is cool (white indicates strong emission in all three bands). The nearby feature SW of the southern head appears soft, as does the feature in the northern tail. The feature just east of the southern tail and the source west of the system appear somewhat harder.
2.2 Point sources: spatial and spectral properties
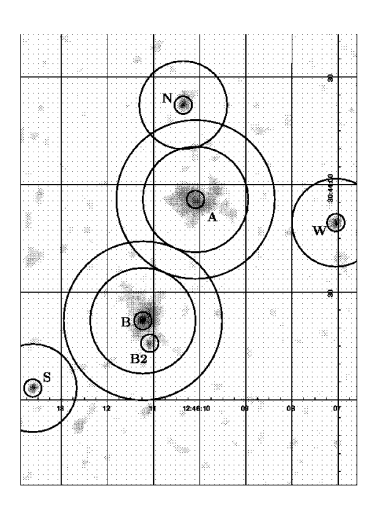
The CIAO tool wavdetect was used to search for point-like sources, on scales from 116 pixels (0.58′′). A total of 6 sources were detected in the 0.310 keV band within or close to the optical confines of the galaxies (whether the galaxy ‘heads’ or tails), and their X-ray properties are summarized in Table 1. Sources are detected (see Fig. 3) at the positions of the two galaxies (A and B), and a further source (B2) is detected just south-west of NGC4676B. A source (N) is detected within the northern tail, and a source (S) is detected close to the eastern edge of the southern tail. Finally, a source (W) is detected west of the the main body of the system. The X-ray properties given in Table 1 are as follows; Right Ascension and Declination (2000.0) are given in cols. 2 and 3, together with the positional error (in arcseconds) in col. 4. Net source counts (plus errors) are given in col. 5, and the source significance is given in col. 6. Hardness ratios (plus errors) are given in col. 7. These were calculated by performing additional detection runs (using again scales of 116 pixels) in a soft (0.3-2 keV) and a hard (2-10 keV) band. The tabulated values are , being the net source counts in the hard band, being the net source counts in the soft band. Finally, (0.310 keV) X-ray emitted and intrinsic (i.e. corrected for absorption) luminosities (obtained as described in the spectral fitting section) are given in cols. 8 and 9.
| Src. | RA | Dec. | Pos.err. | Counts(err) | Sig. | HR | (0.310 keV) | |
|---|---|---|---|---|---|---|---|---|
| (2000.0) | (arcsec) | ( erg s-1) | ||||||
| (emitted) | (intrinsic) | |||||||
| A | 12 46 10.09 | +30 43 55.8 | 0.22 | 26.52 5.29 | 10.64 | -0.450.27 | 11.92 | 12.17 |
| B | 12 46 11.23 | +30 43 22.0 | 0.12 | 92.98 9.80 | 31.59 | -0.480.12 | 23.99 | 26.14 |
| B2 | 12 46 11.08 | +30 43 15.8 | 0.23 | 10.29 3.31 | 4.66 | -0.660.36 | 3.22 | 3.30 |
| N | 12 46 10.36 | +30 44 22.2 | 0.14 | 27.25 5.29 | 12.25 | -0.590.21 | 8.72 | 8.91 |
| S | 12 46 13.62 | +30 43 03.3 | 0.13 | 17.36 4.24 | 7.96 | -0.480.36 | 4.98 | 5.04 |
| W | 12 46 07.05 | +30 43 49.4 | 0.14 | 23.26 4.90 | 10.47 | -0.440.23 | 7.82 | 7.98 |
Source spectra were extracted in the range 0.310 keV at the exact positions given by the 0.310 keV detection analysis. The regions output by the detection routines, defined to include as many of the source photons as possible, but minimizing the background contamination, were invariably near-circles of radius pixels (partly due to the Mice only occupying the very centre of the ACIS-S3 chip), and consequently, extraction circles of radius 5 pixels (2.5′′) were used for all the sources in Table 1. Background regions were source-free circular annuli surrounding each source (in order to minimize effects related to the spatial variations of the CCD response), though regions of apparent diffuse emission were also avoided in the extraction of background regions; in the cases of A, B and B2, background extraction annuli of inner-to-outer radii 1522.5′′ were used. In the cases of N, S and W, background extraction annuli of 2.512.5′′ were used. All source and background extraction regions are shown in Fig. 3.
ACIS spectra were extracted using Pulse Invariant (PI) data values, and were binned together to give a minimum of 10 counts per bin after background subtraction. Hence statistics could be used. Response matrices and ancillary response matrices were created for each spectrum, using the latest calibration files available at the time of writing.
Standard spectral models were fit to the spectral data using the CIAO spectral fitting software. Events above 7 keV (of which there were very few) and below 0.3 keV were excluded from the fitting on the grounds of uncertainties in the energy calibration. It is now known that there has been a continuous degradation in the ACIS QE since launch. A number of methods now exist within the community to correct for this. These include the release of an XSPEC model (ACISABS) to account for this degradation, and the existence of software (corrarf) to correct the ancillary response files. Both methods have been used here in the spectral fitting, and very similar results were obtained. In both cases, the time since launch of the observations (here, 678 days) is used in the correction. Although the calibration at energies below 1.0 keV is believed to be uncertain, data in this range were kept, as the statistical error on these data points is still greater than the errors due to the uncertainties in the calibration.
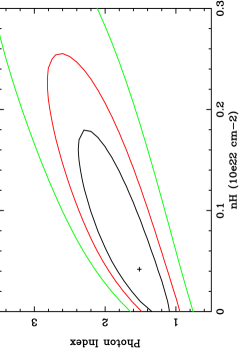
Two models, one incorporating absorption fixed at the value out of our Galaxy (1.28 cm-2) and a 5 keV mekal thermal plasma, the other incorporating absorption (again, fixed) and a power-law of photon index 1.5 were fit to the data. Only for source B were there sufficient counts to let the model parameters fit freely. A good fit (reduced 1) was obtained using a power-law model of photon index 1.52 and an absorbing column of 4.19 cm-2. Fig. 4 shows the 99%, 90% and 68% confidence contours in the photon index-absorption column plane for the power-law fit to the spectrum of source B. The luminosities quoted in Table 1 for source B assume this best-fitted model, while for the other sources, the model assumed is of fixed (Galactic) absorption plus a power-law of photon index 1.5.
2.3 Residual emission: spatial and spectral properties
The existence of residual, likely diffuse emission, surrounding the two head sources A and B is very evident in the figures. Spectra from these regions of apparent diffuse emission were extracted in the range 0.310 keV. An annulus of 2.515′′ centred on source A was used to extract a spectrum of the ‘diffuse’ emission associated with NGC4676A (hereafter ‘diffA’). An identical annulus around source B (excepting a 2.5′′ circular region surrounding source B2) was used to extract a spectrum of the emission around NGC4676B (‘diffB’). Background regions were as for sources A and B. These diffuse and background extraction regions are shown in Fig. 3.
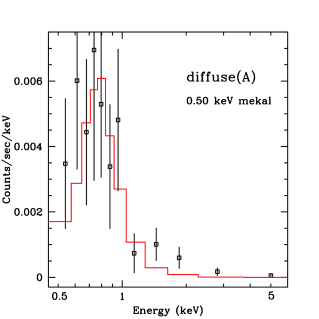
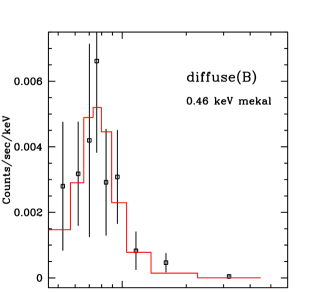
The spectral fitting was performed as for the point sources, using the same models, and using both methods to correct for the degradation in the ACIS QE. With 80100 non-background counts in each spectrum (see Table 2), it was possible to place some constraints on the spectral properties of the residual emission. In both cases, diffA and diffB, an absorption plus power-law model was unable to fit the data satisfactorily. Only reduced ’s of 1.5 (diffA) and 1.4 (diffB) were attainable using power-law models. Thermal models proved much better, and the best thermal fits (again using an absorption plus mekal model) are summarized in Table 2; the absorbing column, the fitted temperature and metallicity (an ‘F’ indicating a fixed value), the reduced , and the emitted and intrinsic (i.e. absorption-corrected) X-ray luminosity is given. Essentially identical temperatures ( keV) are obtained for both diffuse emission features, and the data plus best fit models are shown in Fig. 5.
| Diff. | Counts(err) | (0.310 keV) | |||||
|---|---|---|---|---|---|---|---|
| Src. | ( cm-2) | (keV) | (solar) | (red.) | ( erg s-1) | ||
| (emitted) | (intrinsic) | ||||||
| diffA | 103.412.7 | 1.28(F) | 0.50 | 0.3(F) | 1.20 | 10.13 | 10.86 |
| diffB | 80.5511.9 | 1.28(F) | 0.46 | 0.3(F) | 0.45 | 7.34 | 7.89 |
2.4 Temporal properties
As we have two observations of the Mice where one can distinguish discrete emission regions (the first being the ROSAT HRI observations, described in Sect. 1.1), some constraints can be placed on the temporal properties of those regions. X-ray luminosities in the 0.310 keV band have been calculated for the ROSAT HRI count rates, using the ACIS-S best-fit models to the source A and B spectra. Comparison of the HRI and ACIS-S PSFs indicates that the HRI would essentially ‘see’ source A and most of the residual emission around source A (diffA) as one point source. Similarly, the HRI would detect the emission from sources B, B2 and from diffB as one source. One can therefore only study the temporal variation of the emission from the ‘heads’ of the two galaxies; NGC4676A (where the total ACIS-S (intrinsic) is the sum of the X-ray luminosities of source A and diffA) and NGC4676B (the total being the sum for sources B, B2 and diffB). In Fig. 6, these two crude X-ray lightcurves are shown. Errors on the luminosities are taken as the statistical errors on the count rates (the errors on the HRI luminosities are very large, due to there being very few counts, and a higher background level). For the southern galaxy NGC4676B, the level of the emission appears not to have varied at all between the two observations. If one uses a power-law model to calculate the HRI luminosity of NGC4676A (the upper 1997 point in the left-hand panel of Fig. 6), then it appears that some variation may have occurred (at least at the level). However, re-calculating an intrinsic (0.310 keV) X-ray luminosity for the NGC4676A ROSAT HRI count rate, but using instead the best-fit model to the diffA spectrum, results in a value (the lower 1997 point in the left-hand panel of Fig. 6) very in accordance with the ACIS-S value. The true HRI luminosity lies somewhere between these two points, and one can conclude therefore that there are no significant signs of any X-ray variations between the two observations.


3 Discussion
3.1 Point sources
With the Chandra ACIS-S instrument, it is possible to resolve more clearly the source populations within the Mice, that were suggested by the ROSAT HRI observations.
Complex emission regions are seen at the centres of the two galaxies, surrounded by what appears to be residual, diffuse X-ray emission, and further high-luminosity sources are detected close to the southern nucleus and within the tidal tails.
Recent mapping of the 2.6 mm CO emission in the Mice (Yun & Hibbard 2001) has revealed large amounts of molecular gas. A compact molecular complex is seen well centred on the inner stellar disk of NGC4676A, forming a disk- or ring-like structure, seen within 5∘10∘of being edge-on, with a deconvolved size of 1.8 kpc in radius and a thickness (FWHM) of 250 pc. The gas kinematics observed are consistent purely with rotation. A total molecular gas mass of 5.5 M⊙ is detected (about twice as much as in our Galaxy), making up a significant fraction (20%) of the total mass in the nuclear region. This is a very high fraction for ordinary disk galaxies (Young & Scoville 1991).
In NGC4676B, the situation is different in that only weak CO emission is detected, and then only along the 7 kpc stellar bar. Large peaks in the CO emission are seen in NGC4676B at the ends of the bar, as is often seen in other barred galaxies. The CO kinematics are consistent with solid body rotation of the bar, and the molecular gas fraction is seen to be about 7%, which is more typical of undisturbed disk galaxies.
The fact that several smaller CO clumps are seen in the bridging region between the two Mice ‘heads’ indicates that the disruption of the inner disks has begun within the Mice. This, along with the obvious morphological indicators of interaction, and the fact that an increase in far-infrared luminosity is observed within the system, is very suggestive of strong starburst activity having begun within the one or both of the galactic nuclei. The Mice have values more like those of field starburst galaxies, than of normal galaxies, and a large value of the far-infrared dust colour temperature , a diagnostic seen to increase with interaction strength (Telesco et al. 1988), is also observed within this system (RP98).
Significant X-ray emission is seen at the centres of the two galaxies. Dealing first with source at centre of NGC4676B, source B, it is possible to place some constraints as to the spectral properties of the source, in that an absorbed power-law is seen to fit the data very well. This is not too constraining however, as the fit is not significantly better than with an absorbed (9.9 cm-2) fixed-5 keV mekal model. Though it is difficult to say whether the emission at the centre of NGC4676B is thermal or not, it appears to be rather absorbed, a fact not too surprising, given the inclined orientation nature of the southern galaxy.
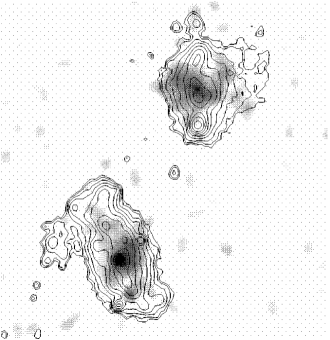
Fig. 7 shows white contours of 0.210 keV ACIS-S X-ray emission (as per Fig. 2a) superimposed on Yun & Hibbard’s (2001) figure of velocity-integrated CO (black contours) and (greyscale). Fig. 8 details the emission and shows contours of (increasing by factors of 1.7783), from Hibbard & van Gorkom (1996) (and reproduced in Yun & Hibbard (2001)), superimposed on the 0.210 keV ACIS-S X-ray emission (greyscale).

Source B is very bright, appears very compact, and lies coincident with the peak in the southern galaxy’s emission, a site of intense current star-formation. Little CO emission is seen here however. In contrast, source A, the X-ray source at the centre of NGC4676A, is not as bright, nor as centrally compact, and appears coincident with the peak in the CO emission disk, a site containing large amounts of molecular gas. There is a peak in the emission at the position of source A, indicating that a good deal of star-formation is ongoing, though the main peak in the northern galaxy lies some 13′′ to the south, at the edge of the CO disk. Yun & Hibbard (2001) suggest that this near anticorrelation between the CO and the emission in the northern galaxy is due to extinction in the nearly edge-on disk. In fact the peak CO flux corresponds to an of cm-2, and this may explain why source A appears rather different to source B in X-rays, i.e. we are not really seeing many of the X-rays (or indeed the photons), because of the intervening absorbing material in the disk. One cannot say anything using source A’s X-ray spectrum as regards absorption, but assuming again a 1.5 power-law model, but with an absorption suggested by the CO data, then an intrinsic (0.310 keV) X-ray luminosity of 2.1 erg s-1 is obtained, more similar to that of source B. Sources A & B may indeed be very similar.
The fact that the X-ray emission at the centres of the two galaxies appears spatially complex, with associated diffuse hot gas structures, and significant amounts of molecular gas and emission, suggests strongly (especially for source A) that the nuclear X-ray sources are starburst-like in origin (as opposed to being significantly dominated by AGN activity).
Such X-ray luminosities for the nuclear sources in the Mice are certainly ‘Super-Eddington’ (the Eddington limit for a 1M⊙ accreting object is erg s-1), but these nuclear sources may not be single sources, and we would need even higher spatial resolution than that offered by Chandra to untangle any complex source confusion. It is interesting to note that the luminosities of sources A & B are somewhat greater than those of the two nuclear sources in the Antennae (Zezas et al. 2002). Though there may be single massive accreting ‘active’ sources at the centres of these two galaxies, more likely is that these sources are collections of supernovae and stellar winds plus some smaller accreting sources, all embedded in diffuse hot gas a starburst. The fact that much apparently diffuse X-ray emission is seen surrounding the nuclei certainly supports this. This diffuse emission is discussed in the next section.
Close by to the southern nucleus is source B2, a rather soft source according to its hardness ratio (Table 1) and its appearance in the‘ true colour’ image (Fig. 2b). It was not detected by ROSAT, on account of its dimness and close proximity to the southern nuclear source. No noteworthy features are associated with this feature (Fig. 8), excepting that B2 lies along the general disk of that follows the galactic disk. More interesting is the comparison with the CO emission (Fig.7) where it is seen that B2 lies coincident with the CO feature corresponding to the south-western end of the NGC4676B bar (also both B2 and the corresponding CO feature show some extension to the northwest). A less bright X-ray feature (not formally detected within the source-searching analysis) is seen on the opposite side of the southern nucleus, at the other end of the bar, and coincident with a smaller knot of CO emission. Gas dynamical models of barred galaxies (e.g. Engelmaier & Gerhard 1997) show strong gas accumulation at the ends of bars, due to corotation of the bar structure with the disk, leading to enhanced star formation. The CO emission and the general H structure here seem to support this, and source B2 and the X-ray feature on the other side of the bar are very likely due to this bar-enhanced star-formation. Similar behaviour has been seen in a number of other barred galaxies (e.g. NGC4303; Tschöke, Hensler & Junkes 2000).
Two sources are also seen in the tidal tails; N in the northern tail, and S at the eastern edge of the southern. Interestingly, both sources sit at similar distances along the tails from their respective ‘heads’. No other significant X-ray features are seen associated with the tidal tails. An enhancement in the ROSAT PSPC contours is seen at the position of N (RP98), and, though nothing significant is seen at the position of S, one would not expect to see anything significant, given the brightness of S. The ROSAT HRI image (Fig. 1) shows an interesting, though very low significance, plume to the north of NGC4676A. None of the features within the plume however, coincide with the position of N, and, given the ACIS-S count-rate of N, we would be very fortunate to detect any emission in the HRI. Nothing is seen in the HRI at the position of S.
N lies well within the northern tail, about 1.5′′ east of the centre of the tail. Though many features are seen within both tails (Hibbard & van Gorkom 1996), no bright knots lie particularly close to N (the nearest is relatively dim, and lies some 1.5′′ away). Interestingly, a knot in the HST ACS image is seen poking eastwards out of the main central shaft of the tail at the position of N. Furthermore there appears to be a neutral hydrogen H i enhancement at the position of N (Yun & Hibbard 2001). S lies on the very eastern edge of the southern tidal tail. No significant optical feature, either within the tail or more isolated, appears coincident in the HST ACS image, or in coarser Digital Sky Survey images. No features appear coincident either.
Finally, a bright star lies close to Source W (visible at the very right-hand edge of Fig. 2), but is too far offset to be associated. Instead, a very faint optical counterpart can be seen at the exact position of source W in the HST ACS image. The ROSAT PSPC contours are seen to stretch over to encompass this source (RP98), and a feature is seen at this position in the ROSAT HRI data (Fig. 1). This source is assumed not to be associated with the Mice, and is likely a background AGN.
Indeed, one can use the the logNlogS relation of Giacconi et al. (2001) to estimate the expected number of sources not physically associated with the Mice. At most, only one background source is expected over the area covered by Figs. 2 & 3 ( sq. ′) at the detection limit seen here ( erg s-1 at 88 Mpc). It may also be the case that Source S has nothing to do with the Mice, given that it lies some distance from the southern tail, but for source N, lying as it does, directly on the thin northern tail, the case is more concrete.
As a last point, it is worth mentioning that Chandra is able to throw some light upon some of the curious X-ray features previously seen by ROSAT, but not associated with the Mice. The strange extension to the south-west (away from the tidal tails) seen in the PSPC image (RP98) lies towards the direction of two dim Chandra X-ray sources; a ct source at , , and a ct source at , . A final interesting source is the very dim ( ct) source at , lying directly along the line of the northern tail, but approximately 1 arcminute beyond the optical end of the tail.
Though only a small number of sources are evident within the Mice, an approximate comparison of the source X-ray luminosity function (XLF) with the XLFs of other galaxies can be made. This has recently been performed for the Mice’s more evolved and nearby counterpart, the Antennae (Zezas & Fabbiano 2002). At the distance of the Mice, one is only able to detect sources with 5 erg s-1. This in itself is important; all five sources detected within the Mice are ultraluminous. This high tail to the XLF is in sharp contrast to the Galaxy, and to a vast majority of nearby normal and starburst galaxies (e.g. Read & Pietsch 2001, Zezas & Fabbiano 2002). It does however, appear broadly similar to the Antennae. The eight sources in the Antennae with erg s-1 may be significantly greater than the five in the Mice, though there are a number of notes and caveats. Zezas & Fabbiano (2002) use a distance to the Antennae calculated using = 50 km s-1 Mpc-1. Using = 75 km s-1 Mpc-1, the eight high- Antennae sources would reduce to around five. Using an Antennae distance of 25 Mpc, as in RP98, the number would be 67. Furthermore, the Antennae is slightly more massive (in terms of ; RP98), and has a correspondingly higher SFR (in terms of ; RP98) by similar factors of . Activity indicators, such as far-infrared dust colour temperature , and (naturally, from above) are almost identical for the two systems. Scaling the XLFs by mass (or SFR) would bring the two systems into alignment. Note that the usage of the optical luminosity as a measure of mass is generally not ideal, as the blue luminosity to mass ratio is quite sensitive to the age of a stellar population. Here however, as we are dealing with two very similar systems, the comparison is quite justified (the usage of various mass and activity indicators for galaxies is discussed in Read & Ponman 2001). Though it would seem therefore, that in terms of the high end of the XLF, the Mice and the Antennae may appear rather similar, a final caveat to consider is that it is likely, even with the excellent spatial resolution of Chandra, that source confusion is prevalent in the more distant Mice. Such confusion can only strengthen the tail of the XLF, and the likely true situation is that there are fewer than five high- sources in the Mice. It is difficult to be conclusive, but it appears that there are significant number of high- sources in the Mice, a number probably less than is seen in the more evolved Antennae. If the Mice is to evolve into a system like the Antennae, then it is expected that the number of high- sources in the Mice should increase slightly with time.
3.2 Diffuse emission
There exists much evidence that starburst-driven diffuse emission features are seen around both galaxies within the Mice. As discussed with regard to the point sources, there is very little doubt that a good deal of star-formation is taking place at the two nuclei. Around the two nuclei, one sees extended, clumpy, structured emission that is seen to be soft and well-fitted with a thermal (0.5 keV) spectral model. Furthermore, emission appears to be significantly more extended along the minor axis of each galaxy (this is more evident in the northern galaxy, due likely to NGC4676A lying almost exactly edge-on). Furthermore, in the northern galaxy, the H emission is also seen to be significantly extended along the minor axis (especially to the west; Fig. 8). All this is very reminiscent of these features being starburst-driven galactic winds, as seen in famous nearby starburst galaxies such as M82 and NGC253 (e.g. Strickland et al. 2002; Bravo-Guerrero, Read & Stevens 2002). Such nearby systems however, are rather isolated, and classic bipolar winds in even one member of a strong, rapidly-evolving interacting pair such as the Mice, is something that has not been seen before. It is believed from ROSAT (RP98) that starburst- and star formation-driven diffuse emission is prevalent in interacting and merging galaxies, but this was only seen in mid-stage (e.g. the Antennae) and ultraluminous (nuclear contact) mergers, not at early (e.g. Mice) stages. In these post-Mice cases, the systems are evolved to such a degree, that any classic starburst winds (were they to have existed), would have been distorted out of recognition, in agreement with observed peculiar morphologies (RP98). More recently, higher-resolution Chandra observations of the (post-Mice) Antennae show a great deal of hot diffuse gas, but it has become all pervasive, extending further than the stellar bodies of the galaxies (Fabbiano et al. 2002). It is believed we have now seen, in the Mice, the onset of intense star formation, starburst activity and starburst-driven diffuse gaseous outflows in a classic full-blown disk-disk merger.
Though one cannot probe too far, due to lack of counts, there even appears to be some temperature structure in the NGC4676A wind. The eastern wind appears to be brighter and spectrally harder (greener, rather than red; see Fig. 2b) to the north than to the south. To the west of NGC4676A, the situation is reversed, and all this may well be an indication that the rapid evolution and slewing of the galaxies is already beginning to effect even these very nascent starburst winds. The existence of a classic starburst wind in a disk-disk merger may be a very short-lived affair.
One can infer mean physical properties of the hot gas around the northern and southern galaxies once some assumptions have been made regarding the geometry of the diffuse emission. The gas around each galaxy is assumed to be contained in a spherical bubble of radius , taken to be the average radius of the lowest contour level seen in Fig.2a, i.e. 7.5′′ (for A) and 6.0′′ (for B). Using these volumes, the fitted emission measure (where is the ‘filling factor’ - the fraction of the total volume which is occupied by the emitting gas) can be used to infer the mean electron density , and hence, assuming a plasma composition of hydrogen ions and electrons, the total mass and thermal energy of the gas . Approximate values of the cooling time of the hot gas, and also the mass cooling rate and adiabatic expansion timescale , can also be calculated. The resulting gas parameters for A and B are listed in Table 3.
| Diff. | r | |||||||
| Src. | (keV) | (kpc) | (cm-3) | () | (erg) | (Myr) | ( yr-1) | (Myr) |
| () | () | () | () | |||||
| A | 0.50 | 3.2 | 0.019 | 6.5 | 1.8 | 480 | 0.13 | 8.8 |
| B | 0.46 | 2.6 | 0.025 | 4.3 | 1.2 | 380 | 0.11 | 7.3 |
Comparing the diffuse gas parameters in Table 3 with those for isolated normal and starburst galaxies (Read, Ponman & Strickland 1997), and for merging galaxies (RP98), one can say that the diffuse outflows in NGC4676A and NGC4676B appear to be small, and probably young. Extents of 914 kpc are seen for the classic winds of M82 and NGC253, and the outflowing, turbulent ISM of the Antennae is seen out to 8 kpc (Fabbiano et al. 2002). Perhaps 510 times as much gas mass is contained within the M82 or NGC253 diffuse features than in either of the Mice, and the diffuse gas mass of the Antennae may be up to 20 times that of the Mice. The outflows in the Mice appear, in terms of their extent and mass, more like those of small wind/large corona systems, such as NGC891 and NGC4631.
In terms of temperature, it is believed that the hot ISM of starburst galaxies has a a multi-temperature structure, and as such, given the number of diffuse counts from the Mice, little conclusive can be said. However, the single temperatures obtained from the spectral fitting of the diffuse spectra (0.50 keV) is wholly consistent with the range obtained for other starburst and merging galaxies.
3.3 X-ray emission from the Mice
It has been seen that the X-ray emission from the Mice is made up of point source and diffuse emission. In calculating a total for the Mice, source W has been omitted, and the remaining 5 sources and the two diffuse emission features have been summed together. Total intrinsic (and emitted) 0.310 keV X-ray luminosities (in units of 1040 erg s-1) are as follows: Sources 5.56 (5.28), Diffuse emission 1.88 (1.75), Total 7.43 (7.03), leading to a fraction of the total emission that is diffuse of 25%. As such it is rather brighter, both fractionally and in absolute terms, than most normal and starburst galaxies.
It is very instructive to compare these values with those of the Antennae (Fabbiano et al. 2001), where approximately half of the total (0.110 keV) X-ray luminosity (2.3 erg s-1) is attributable to point sources, and half is due to the extended diffuse thermal component. Given the uncertainties in the assumed distances to both galaxies, and noting the slight difference in galaxy masses, it appears that, whereas the X-ray point source populations in the two systems may be rather similar (at least at the high- end), the extended diffuse emission component is far fainter and less extended in the Mice than it is in the more evolved Antennae. This indicates that, if both systems are at different evolutionary stages of an encounter involving similar gaseous disks, then at the Mice stage, the ULX populations have evolved more rapidly than the diffuse gas structures, whereas at the Antennae stage, the diffuse gas structures have caught up. This is not surprising given that the ULXs are likely due to the evolved components of single massive stars (e.g. Roberts et al. 2002), and thus can be created over short (106 yr) timescales, whereas the diffuse components are mainly due to galactic winds, galactic fountains and chimneys, and the hot phases of the ISM, requiring the agglomeration of several, perhaps thousands, of supernova remnants, thus requiring a far longer (few yr) timescale.
The Mice and the Antennae appear to be at different stages of very similar evolutionary tracks (involving two similarly-sized gas-rich spiral disks), the only difference between the systems being (apart from their merger epoch) that the Antennae appears slightly more massive. It is therefore attractive to predict that that the Mice will evolve into a system very like the Antennae within the next years or so. Though the high- end of the point source populations of the two systems are already very similar, the diffuse gas component of the Mice’s emission requires a few years worth of starburst-injected mass and energy, before it can compare with the diffuse emission seen in the Antennae. At present, the outflows in the Mice, in terms of their size and mass, are not yet especially significant, resembling structures observed in nearby systems with small winds and/or large coronae.
4 Conclusions
Presented here are high spatial and spectral resolution Chandra ACIS-S X-ray observations of the famous interacting galaxy pair, the Mice, a system very similar to the Antennae galaxies (albeit at a much larger distance), in consisting of the merger of two equally-sized spiral galaxies. The Mice are at an earlier interaction stage however, the galaxy disks not yet having begun to merge. Previously unpublished ROSAT HRI data of the system are also presented. The primary results can be summarized as follows:
-
•
Of great interest is the discovery of what appears to be starburst-driven galactic winds outflowing along the minor axes of both galaxies (particularly the northern). Spectrally soft X-ray emission extends beyond the northern edge-on galactic disk, into regions occupied by plumes of H emission. Fitting of the diffuse emission spectra indicates temperatures wholly consistent with well-known nearby galactic winds. That such classic winds could exist in the Mice is perhaps surprising, as one would expect the rapid evolution and violence of the environment to distort the wind structures very quickly. The phenomenon may not last long however in terms of extent and mass, the winds are small, low-luminosity, perhaps newly-formed and already show complex spatial and spectral structure, indicating that they could be being disrupted by the encounter. These low-temperature, diffuse X-ray features, extending out of the galactic disks appear to be the very beginnings of starburst-driven hot gaseous outflows in a full-blown disk-disk merger.
-
•
In addition, five bright ( (0.310 keV) 5 erg s-1) point sources are formally detected, associated with the Mice system. The sources detected at the nuclei of the two galaxies are very bright, though perhaps not single, individual sources, and appear quite similar. Emission from the northern nucleus is likely absorbed by the intervening edge-on disk of the northern galaxy. Both nuclear X-ray sources, given the spatial structure of the nuclear and surrounding diffuse X-ray emission, and the large amounts of associated molecular gas and H emission, are likely starburst regions. A source is detected coincident with a molecular gas complex at the tip of one edge of the southern galaxy’s bar. A smaller X-ray enhancement (together with molecular emission) is observed at the opposite end. Two further spectrally soft sources are detected within the two tidal tails.
-
•
The source X-ray luminosity function appears in sharp contrast to that of other normal and starburst galaxies. It is similar however to that of the more evolved Antennae, though the number of high- sources in the Mice is probably less.
-
•
Whilst the point source XLFs of the Mice and Antennae appear similar, far less diffuse emission is detected in the Mice. This indicates that the high-luminosity source populations in these systems evolve more rapidly than the diffuse gas structures. For the Mice to evolve, within the next years, into a system like the Antennae, much of the starburst-injected energy and mass needs to feed the diffuse gas component.
-
•
There is no evidence for any variability between the Chandra data and the ROSAT HRI data.
Acknowledgements
AMR acknowledges the support of PPARC funding, and thanks the referee for useful comments which have improved the paper. AMR also thanks John Hibbard for making his H data available, and Trevor Ponman for carefully reading the manuscript. Optical images are based on photographic data obtained with the UK Schmidt Telescope, operated by the Royal Observatory Edinburgh, and funded by the UK Science and Engineering Research Council, until June 1988, and thereafter by the Anglo-Australian Observatory. Original plate material is copyright (c) the Royal Observatory Edinburgh and the Anglo-Australian Observatory. The plates were processed into the present compressed digital form with their permission. The Digitized Sky Survey was produced at the Space Telescope Science Institute under US Government grant NAG W-2166.
References
- [1] Barnes J.E., Hernquist L., 1991, ApJ, 370, L65
- [2] Barnes J.E., Hernquist L., 1996, ApJ, 471, 115
- [3] Bravo-Guerrero J., Read A.M., Stevens I.R., submitted to MNRAS
- [4] Engelmaier P., Gerhard O., 1997, MNRAS, 287, 57
- [5] Fabbiano, G., Zezas, A. Murray, S.S., 2001, ApJ, 554, 1035
- [6] Giacconi R., et al., 2001, ApJ, 551, 624
- [7] Heckman T.M., 1993, in Schlegel E.M., Petre R., eds, AIP Conf. Proc. 313, The Soft X-ray Cosmos. AIP Press, Woodbury, NY, p.139
- [8] Hibbard J.E., van Gorkom J.H., 1996, AJ, 111, 655
- [9] Mihos J.C., Bothun G.D., Richstone D.O., 1993, ApJ, 418, 82
- [10] Read A.M., Pietsch W., 2001, A&A, 373, 473
- [11] Read A.M., Ponman T.J., D.K., Strickland D.K., 1997, MNRAS, 286, 626
- [12] Read A.M., Ponman T.J., 1998, MNRAS, 297, 143 (RP98)
- [13] Read A.M., Ponman T.J., 2001, MNRAS, 328, 127
- [14] Roberts T.P., Warwick R.S., Ward M.J., Murray S.S., 2002, MNRAS, 337, 677
- [15] Schombert J.M., Wallin J.F., Struck-Marcell C., 1990, AJ, 99, 497
- [16] Schweizer F., 1989, Nat, 338, 119
- [17] Smith B.J., Higdon J.L., 1994, AJ, 108, 837
- [18] Sotnikova N.Y., Reshetnikov V.P., 1998, Astronomy Letters, 24, 73
- [19] Stockton A., 1974, AJ, 187, 219
- [20] Strickland D.K., Heckman T.M., Weaver K.A., Hoopes C.G., Dahlem M., 2002, ApJ, 568, 689
- [21] Toomre A., 1977, in Evolution of Galaxies and Stellar Populations, Ed. B.M.Tinsley, R.B.Larson, p.401, (New Haven: Yale University Observatory)
- [22] Toomre A., Toomre J., 1972, ApJ, 178, 623
- [23] Tschöke D., Hensler G., Junkes N., 2000, A&A, 360, 447
- [24] Vorontsov-Vel’yaminov B.A., 1957, Astron. Tsirk., 178, 19
- [25] Young J.S., Scoville N.Z., 1991, ARA&A, 29, 581
- [26] Yun M.S., Hibbard J.E., 2001, ApJ, 550, 104
- [27] Zezas A., Fabbiano G., 2002, 2002, ApJ, 577, 726
- [28] Zezas A., Fabbiano G., Rots A.H., Murray S.S., 2002, ApJ, 577, 710