Renewed activity in the radio galaxy PKS B1545321: twin edge-brightened beams within diffuse radio lobes
Abstract
Australia Telescope Compact Array (ATCA) images of the giant radio galaxy PKS B1545321 show a pair of oppositely directed beams emerging from a radio core and ending in bright components that are symmetrically located on either side. These inner beams are embedded within edge-brightened outer lobes of lower surface brightness and the bright ends of the inner beams are well recessed from the ends of the outer lobes. The inner beams and diffuse surrounding lobes share a common central core and radio axis. We propose that the observed inner beams are double lobes which have been created within relic outer lobes as a consequence of a restarting of the central activity; therefore, PKS B1545321 is a rare opportunity for examining the development of restarted beams within a relic synchrotron plasma cocoon.
The inner double representing the new episode has among the highest axial ratios found in typical edge-brightened radio galaxies. The low radio luminosity of the inner double, the narrow and constant transverse extent of its cocoon and the relatively low brightness of the hotspots at its ends are consistent with the almost ballistic propagation expected for a beam that has a low density contrast and is advancing within a relatively light ambient medium.
1 Introduction
The morphologies of the lobes of double radio galaxies and the variations in the spectral index over them have recently been used to infer the history of the central engine activity (Roettiger et al., 1994; Subrahmanyan, Saripalli & Hunstead, 1996; Schoenmakers et al., 2000). Such studies indicate that apart from precession and other large-angle changes in the central engine axis, variations in the beam activity also include interruptions: beams sometimes stop and restart. Giant radio galaxies (GRGs; Saripalli et al. (1986)) have proved to be a fertile ground for examples of interrupted nuclear activity. Subrahmanyan, Saripalli & Hunstead (1996) and Schoenmakers et al. (2000) have drawn attention to several GRGs where morphological properties indicated an interruption in central activity. The evidence is in the form of a nested pair of radio sources having the same central radio core. Such sources are excellent opportunities for studying the development of new beams in an environment that is different from the usual ambient medium — the thermal X-ray gas halo or the thermal intergalactic medium (IGM) — of typical radio galaxies. In this respect, it is highly desirable to not only have more examples of such double-double sources but also sources where the new beams are observed to be fully embedded within the lobes of the older activity. Recently, Saripalli, Subrahmanyan & Udaya Shankar (2002) presented a detailed study of such a source where the inner double is clearly imaged and one side is observed to be fully embedded within older lobe plasma. Herein we present the finest example yet of such a source, PKS B1545321, in which the inner double is traced all the way from the core to its bright ends and where both inner components are observed to be completely enveloped by outer lobe plasma.
An 843 MHz image of PKS B1545321 was made by Jones & McAdam (1992) using the Molonglo observatory synthesis telescope (MOST); this showed a continuous bridge of emission over its entire length along with multiple peaks along a central ridge. An ATCA image of the source (Subrahmanyan, Saripalli & Hunstead, 1996), which was made at 22 cm wavelength and with higher angular resolution, clearly showed a pair of bright inner compact components lying along the source axis. These components were observed to be well recessed from the ends and symmetrically located on either side of a central radio core. The unusual morphology was suggested to be a result of restarted activity after an interrutption. An optical host has been identified at the location of the radio core; the galaxy has a magnitude of 17.5 and its redshift is (Simpson et al., 1993).
In this paper we present our new multi-frequency observations of PKS B1545321 using the ATCA, which have been made with full polarization and with higher dynamic range and resolution as compared to previous images. The higher quality images have revealed the inner components to be a spectacular pair of beams that are traced continuously from the central core and terminate at bright heads. These twin beams are fully embedded within diffuse lobes and their ends are well recessed. We discuss the restarting phenomenon in this source and the nature of the interaction between the restarted beams and the surrounding older cocoon material.
Herein we adopt a flat cosmology with parameters , , and a Hubble constant km s-1 Mpc-1. PKS B1545321 is at a luminosity distance of 488 Mpc. The source has a total angular size of and we derive the proper linear size to be 1.04 Mpc.
2 ATCA radio images of PKS B1545321
The radio source was observed using the East-West ATCA separately in a compact 375 m, an intermediate 1.5 km and an extended 6 km configuration. The observations were aimed at imaging the largest angular scale structures in this size source with a few arcsec resolution at 22 and 12 cm wavelengths. Each of the three Earth-rotation Fourier synthesis observations were made in full polarization and simultaneously using two frequency bands 128 MHz wide centered at 1384 and 2496 MHz. The continuum bands were covered in 13 independent channels. The flux scale was set using observations of PKS B1934638 whose flux density was adopted to be 14.94 and 11.14 Jy respectively at 22 and 12 cm. The interferometric visibility data were calibrated and imaged using miriad; data in both observing bands were separately reduced. Continuum images were constructed from the multi-channel data using bandwidth synthesis techniques and the images were deconvolved using the Steer-Dewdney-Ito algorithm. Three iterations of phase self calibration were performed.
The total flux density of PKS B1545321 is 1.8 Jy at 1384 MHz and 1.1 Jy at 2496 MHz based on the new ATCA data. In Table 1 we summarize the flux density measurements for this source. The overall spectrum is curved and the spectral index between 843 and 2496 MHz ().
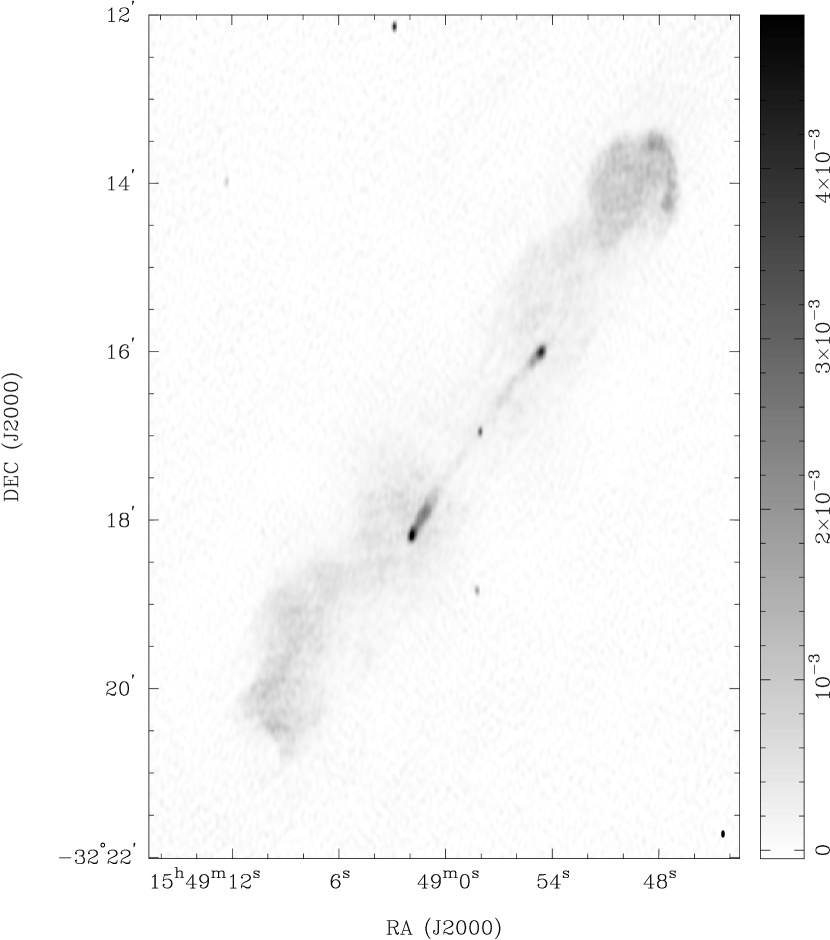
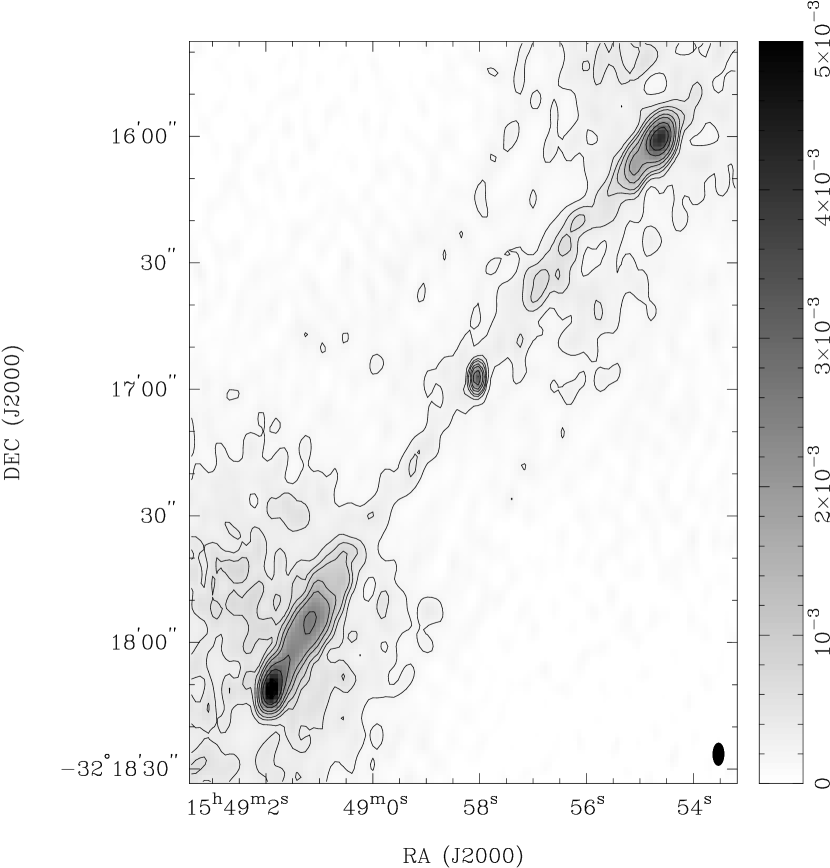
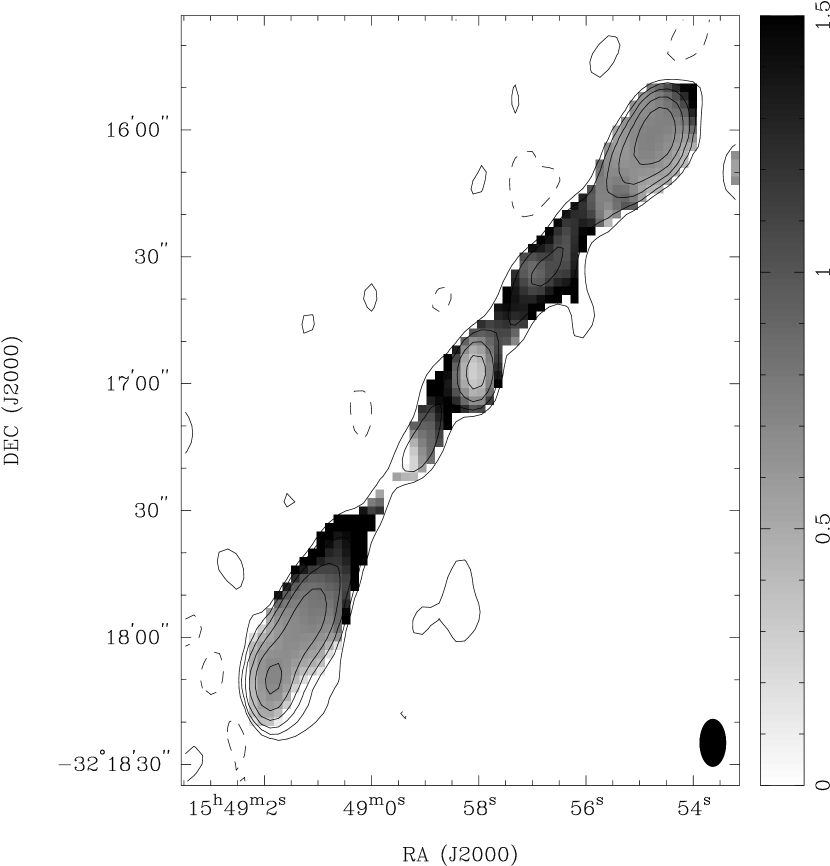
A 12 cm wavelength continuum image, showing the entire source, is in Fig. 1. The linear gray scale representation shows (1) oppositely directed collimated beams terminating in bright components, (2) low surface brightness edge-brightened double lobes which appear to surround the twin beams and extend well beyond, and (3) an unresolved core at the common center. We refer to the first and second structures as the inner and outer doubles respectively; the northern and southern lobes of the inner double are called N2 and S2, those of the outer double are called N1 and S1. Both the doubles are collinear with the compact central core component.
2.1 The Outer Lobes
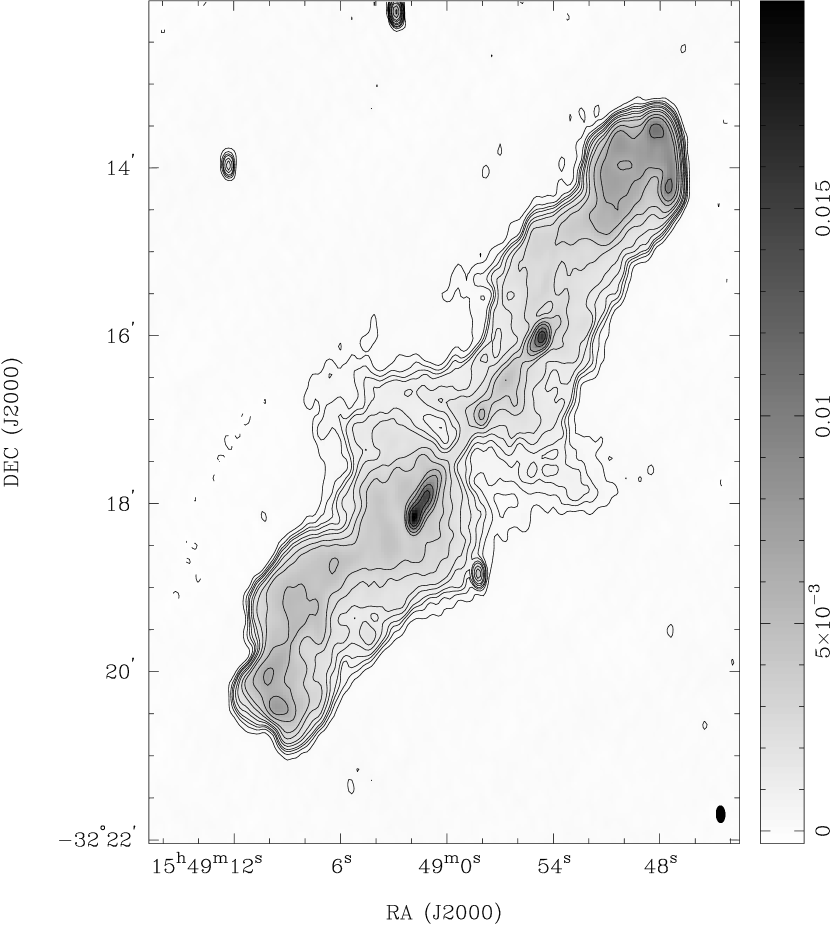
The structure in the outer lobes at 22 cm is shown in Fig. 2. Transverse to the radio axis, the width of the radio source is fairly constant over most of its length. Both lobes have a similar overall morphology and in both cases the ratio of the lobe length to lobe width is . Both lobes are edge-brightened and sharply bounded; in particular, the NW lobe has a pair of emission peaks along a relatively brighter rim at its western end. There are no strong hotspots or any compact structures at the ends of the lobes. The two lobes are wavy and the side-to-side undulations are inversion symmetric about the core position.
In the central regions the bridge flares transverse to the radio axis. The flaring is different for the two lobes. Whereas N1 has extensions on both sides, S1 shows an extension only to one side, the NE side. There is a curious “zone of avoidance” at the center, that is oriented transverse to the radio axis, where the intensity is weak. This gap in emission is displaced from the location of the core: whereas S1 stops short of the core along an edge that is south of the core, N1 continues past the core position and stops at an edge south of the core. Interestingly, the inner lobes show no emission gap and S2 appears continuous across the gap observed between S1 and N1.
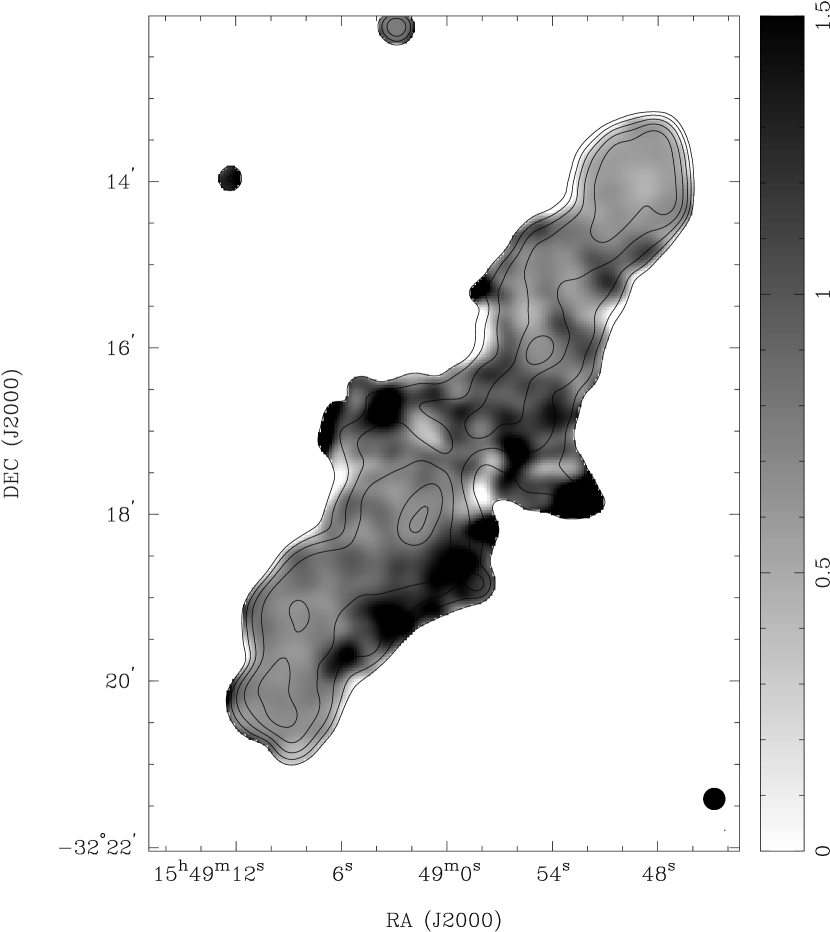
The distribution of the spectral index over the lobes, between 12 and 22 cm, is shown in Fig. 3. The 12 cm visibility data were tapered and imaged to produce a low resolution image and the 22 cm visibility data were imaged with nominal resolution. The deconvolved images, which had similar resolutions, were then convolved to a common final resolution of . Effectively, this analysis ensured that the images used for computing the spectral index distribution image shown in Fig. 3 had been constructed from data with similar spatial frequency range. The observed spectral index is close to 0.6 over the brighter regions at the NW end of the source; at the SE end the spectral index is around 0.7. Overall, there is a steepening of the spectral index from the ends of the outer lobes towards the center where exceeds 0.9. In N1 and S1 the regions with the steepest spectra appear to avoid the brightest parts; in particular, the radio spectrum is relatively steeper with along the SW edge of S1. The spectral indices in these regions, with low surface brightness at 12 cm, are estimated to have an error of 20%.
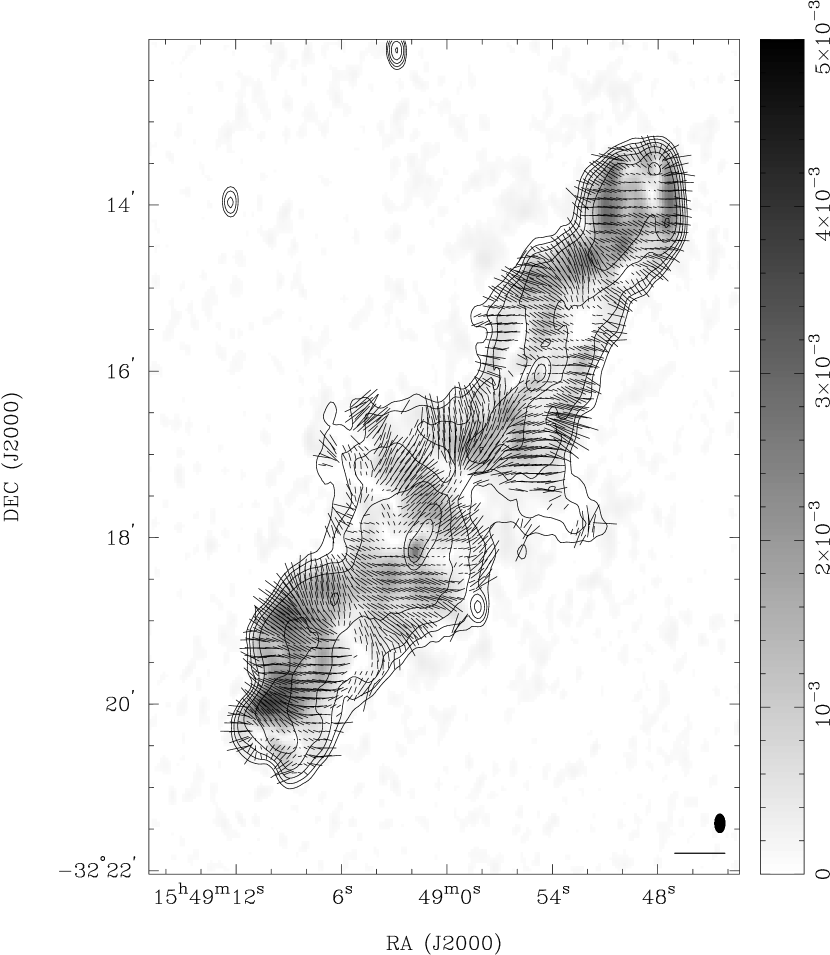
We have determined the distribution of the polarized intensity over the source at 12 and 22 cm. The rotation measure (RM) has a mean value of 14.4 rad m-2 over the source with a 1- scatter of 6 rad m-2. We do not observe any significant changes, within the errors in the measurement, in the RM distribution over the source. The distribution in the 22 cm polarized intensity is shown in Fig. 4; overlaid are vectors showing the orientation of the projected electric field with bar lengths proportional to the fractional polarization. The vector orientations have had the small correction for Faraday rotation that was derived based on the assumption that the observed RM distribution is owing to a foreground screen. The projected magnetic field, which is perpendicular to the electric field orientations shown in the figure, is circumferential along the boundaries of the outer lobes. The fractional polarization is enhanced along the lobe boundary. The projected B-field is aligned with the total intensity ridges in the two lobes and closely follows the bends and wiggles along the lengths of the outer lobes; as expected, the B-field orientation appears to be along the flow in the synchrotron plasma. However, the distribution in the B-field, in this low-resolution image, is perpendicular to the source axis over the inner lobe N2 where we expect the flow in the outer lobe N1 to be along the source axis. It is likely that towards N2 the polarized intensity in this image is dominated by emission from N2 and the observed field represents the orientation in N2 and not in N1. The polarized intensity distribution shows much more structure as compared to the total intensity distribution. The fractional polarization is distinctly lower in the regions of the outer lobes close to the ends of N2 and S2; these can be recognized as being due to beam depolarization because the E-vectors here are observed to sharply change orientation. There are also regions within the outer lobes where polarized intensity is low and, consequently, undetected. They are observed to be located somewhat offset from the ridges, close to where the ridge lines have sharp bends, and preferentially on the concave side. The low polarized intensity at some of these locations might also be due to beam depolarization. The wings transverse to the radio axis at the center of the radio galaxy show parallel B-fields, this is particularly noticeable along the inner edge of S1. Additionally, the wings have a relatively high (30–60%) fractional polarization.
To summarize the polarization properties, overall there is order in the magnetic field structure and we recognize the following components: (1) the parallel B-field that closely follows the ridges in the two lobes over several hundreds of kiloparsecs, (2) the parallel B-field along the edges of most of the source, and (3) the parallel B-field in the wings on both sides of the “zone of avoidance”.
We estimated the average depolarization ratio (as a ratio of the percentage polarization at 22 cm to that at 12 cm) over different parts of the outer lobes: the ratio is about 0.96 at the SE end and close to 1.0 at the NW end. In the central parts the ratio falls to about 0.92. Depolarization is most pronounced on the SW sides of the inner parts of N1 and S1 where the ratio is as low as 0.83. These are the parts with the steepest spectral indices and, as discussed in section 3.1, these parts are on the side where extended X-ray emission has been detected.
2.2 The Inner Double
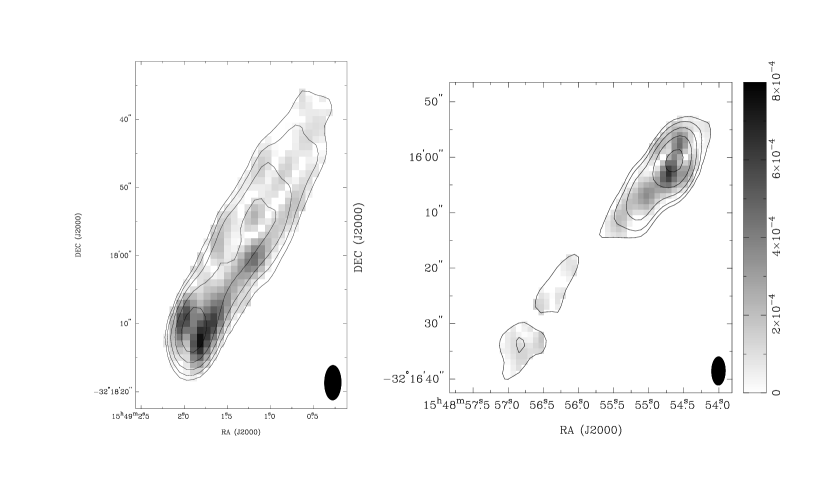
A high resolution 12 cm image of the inner double is shown in Fig. 5 with a beam of FWHM . We also show, in Fig. 6, a 12 cm image made excluding visibilities with spatial frequencies less than 3 k; this image reproduces only structure with angular scales smaller than about and shows the inner lobes without the diffuse underlying outer lobe emission. The total flux density of the inner double is 53 and 78 mJy respectively at 12 and 22 cm. The inner double is observed to be twin oppositely directed beams that are traced continuously from the core and terminating at bright axially elongated cylindrical components. N2 and S2 consist of bright ends, short trails, and relatively lower-surface-brightness emission connecting the ends to the core. The striking feature of the inner double is the near constancy of its width over its length; this is best represented visually in the 12 cm total intensity gray-scale image in Fig. 1. The deconvolved FWHM, derived using the image in Fig. 6, is about – all along the length of the inner double.
The bright ends are resolved in the direction transverse to the radio axis and have deconvolved FWHM in the range – corresponding to a linear size of kpc; this is less than the FWHM widths of the short trails and lower surface brightness parts of the inner double. As shown in Fig. 1, these bright peaks at the ends of inner double are the brightest components in the entire source; however, their surface brightness (at 12 and 22 cm) is in the range 0.1–0.4 mJy arcsec-2, which is much lower than what is usually observed in the hotspots of powerful radio galaxies. The peak at the end of S2 is brighter and has a smaller deconvolved size — both by factors of 1.4 — as compared to the peak at the end of N2. Additionally, the bright trail behind the peak in S2 is observed to extend more than twice the distance as compared to that in N2. The low surface brightness parts of N2 show intensity variations with maxima 3–4 times the minima; the S2 beam is more uniform.
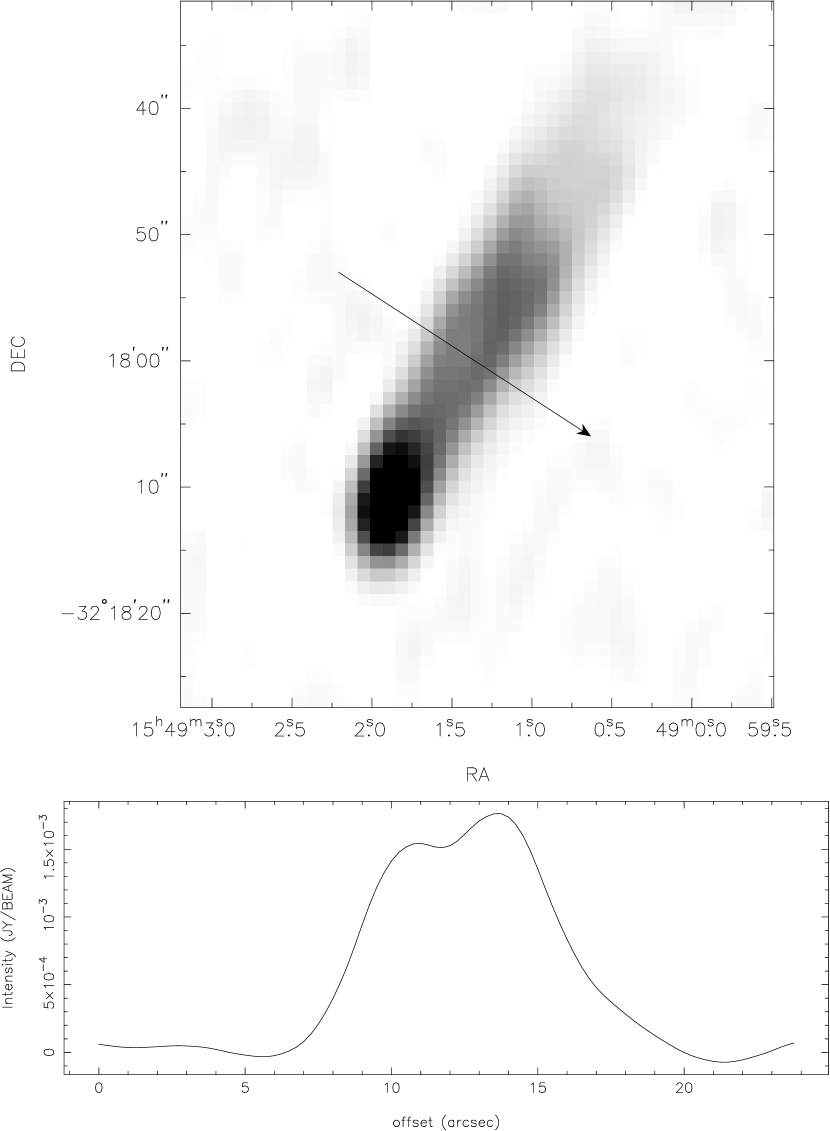
The ATCA observations presented in this paper show that the bright trails in N2 and S2, i.e., on both sides of the inner double, have double peaked transverse profiles. In Fig. 7, we show a slice profile made transverse to the axis in the bright trail close to the end of S2 to display this characteristic. The observations suggest that the emission is predominantly from a cylindrical sheath. In the lower surface brightness parts closer to the core, the present observations do not have the surface brightness sensitivity (at this resolution and observing frequency) to conclusively differentiate between edge-brightened and filled emission.
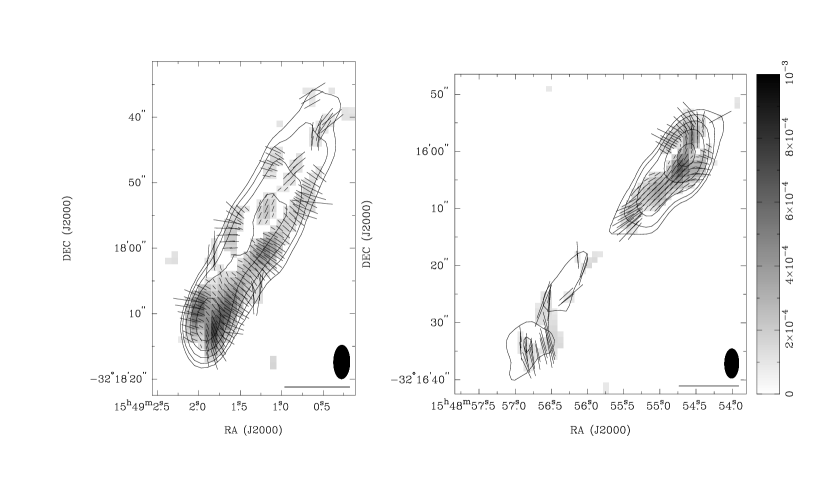
The 12-cm polarization in the inner double is shown in Figs. 8 & 9 with the same resolution as the total intensity distribution in Fig. 5. The polarized intensity is shown in Fig. 8 using gray scales. The electric vectors are shown in Fig. 9 with lengths representing the fractional polarization and with their orientations corrected for Faraday rotation assuming a uniform RM of 14.4 rad m-2. At the end of S2, there are two peaks in polarized intensity located on either side of the peak in total intensity. In the bright trail at the end of S2 there is an enhancement of the polarized intensity, as well as the fractional polarization, along the edges. Similarly, at the end of N2, the peaks in polarized intensity avoid the total intensity peak and are located along the boundary. In the brighter regions at the ends of the inner double the projected magnetic field is circumferential along the edges and the fractional polarization takes on values as high as 45%. The distributions of the polarized intensity, as well as that of the fractional polarization, show an additional ridge running along the middle on both sides of the inner double. Along this central line, the magnetic field is oriented perpendicular to the source axis and the percentage polarization reaches 40%. The variations in the polarized intensity transverse to the axis are perhaps because of beam depolarization owing to a flip in the orientation of the linear polarization in going from the central ridge line to the edges.
The distribution in the spectral index over the inner lobes is shown in Fig. 10. Images of the inner lobes at 12 and 22 cm were separately constructed using visibilities restricted to a common range of 3–29 k, both images were convolved to a common final beam of FWHM and these were used in deriving the distribution in the spectral index. The spectral index is fairly constant at about over the bright ends and associated trails in the inner double. However, there is some evidence for a steeper spectral index with in the low brightness parts closer to the core.
The inner double is curved over its entire length; N2 and S2 bend to the SW with a mirror symmetry. If we extrapolate the curved trajectories of the inner double, N2 meets the end of the N1 at the recessed peak along the western rim and S2 appears heading for the SW tip of S1.
2.3 The radio core and host galaxy
The radio core is unresolved in our images and has a deconvolved size FWHM. The core flux density is 4.5 mJy at 22 cm and has a spectral index between 22 and 12 cm. The core power is W Hz-1 at 1.4 GHz and is 0.25% of the total source power.
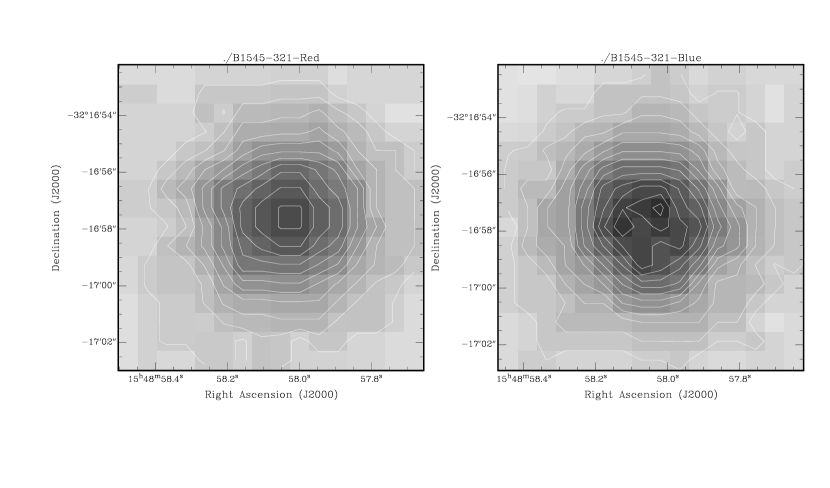
The host galaxy, coincident with the radio core, is derived to have an absolute magnitude . The SuperCOSMOS (SCOS) digitization of the UK Schmidt plates in the red and blue (Fig. 11) show that the parent galaxy is symmetric in the red but has isophotal distortions and patchiness in the blue. There is an indication of a central dust lane oriented orthogonal to the axis of the radio galaxy.
3 Discussion
3.1 The relic outer lobes
The source has a total radio power of W Hz-1 at 1.4 GHz. Given the absolute optical magnitude of the host galaxy, the radio power places the source above the FR I-FR II dividing line (Owen, 1993) and in the powerful radio galaxy regime. This is consistent with the edge brightened morphology of the outer lobes and the spectral steepening in the outer lobes towards the core. However, the outer lobes do not appear to have any hotspots at their ends. This suggests that the outer double is not currently being fed by beams from the center and is a relic of a powerful radio galaxy created by past activity in the central engine. The relatively low and uniform surface brightness distribution across the outer lobes and the overall steep spectrum support the relic hypothesis.
Radio galaxies that are observed to have small axial ratios and fat double type structure tend to have relatively steep radio spectra as compared to other powerful double radio sources and they are presumed to be relics (Muxlow & Garrington, 1991); however, PKS B1545321 is not a fat double. The circumferential magnetic fields, increased percentage polarization towards the lobe edges and the sharp boundaries of the outer lobes indicate a compression of the lobe plasma as it expands against the external medium. Similarly, the high fractional polarization and parallel B-field in the central flare suggest a compression of backflowing lobe against material in the “zone of avoidance”. These observations, which indicate that the lobes are dynamically evolving, may be reconciled with the lack of hotspots at the ends if the beams feeding the outer lobes have been switched off relatively recently. We find that the core power and the total power in PKS B1545321 are consistent with the correlation found between these quantities for active radio galaxies (Giovannini et al., 1988); this again implies that the outer lobes have not faded significantly since the beams to these lobes were switched off. Additionally, the concordance suggests that the core power has not changed significantly as a consequence of the restarting of the beams and that the current beam power is likely to be the same as it was prior to the interruption. Assuming that the core power was about W Hz-1 at 1.4 GHz while the beams fed the outer lobes, the correlation found by Giovannini et al. (1988) indicates that the total power of the source was at most about W Hz-1 at 0.4 GHz. This implies that the radio power of the outer lobes has reduced by at most a factor of 10, and - assuming a tangled magnetic field - adiabatically expanded by at most a factor of 1.4, since the beams were switched off. It may be noted here that the closeness of the brightness peaks in the outer lobes to the boundaries of the lobes indicates that the true expansion factor is much less than this limit. If the density of the ambient IGM is assumed to be at most 10 (Burles et al., 1999), the relic outer lobes, which have a minimum energy density of ergs cm-3, would expand with a speed of at least assuming ram pressure confinement. Together with the limit on the expansion factor, we infer that the time elapsed since the beams ceased feeding hotspots at the ends of N1 and S1 is yr.
N1 is observed on the sky to extend beyond the core whereas S1 appears to be docked 100 kpc short of the core. In the lobes of powerful double radio galaxies that extend to the center, the bridges are either continuous or are observed to be docked symmetrically about the core. Assuming that lobes do not backflow past the core, the observed structure in PKS B1545321 suggests that the source is not on the plane of the sky and, additionally, the lobe structure is intrinsically asymmetric about the core. N1 and S1 are docked at different distances from the core; additionally, the deviations from axi-symmetry may be different for the two lobes.
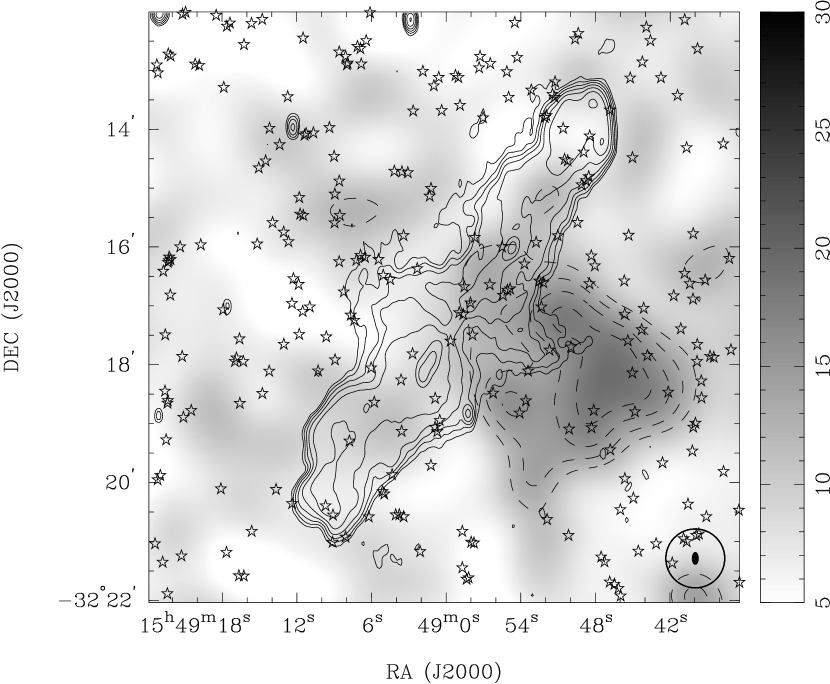
We have extracted archival ROSAT total-band PSPC images of the field, smoothed the -pixel counts with a Gaussian of FWHM , and displayed the X-ray brightness distribution in Fig. 12. Contours of the 22-cm radio intensity are overlaid. Extended low surface brightness X-ray emission is observed with a peak at a location offset to the SW of the radio core. The sky positions of objects, which are classified as galaxies (based on SCOS digitization of the UK Schmidt red and blue plates) and are cataloged in SCOS to have magnitudes within of that of the host galaxy, are marked in the figure. The GRG is in a neighbourhood with a high galaxy count: this has been noted by Subrahmanyan, Saripalli & Hunstead (1996) who found that in the vicinity of this GRG the sky density of galaxies within mag. of the host galaxy is a factor of 6 greater than the mean. We have examined the galaxy distribution within different magnitude ranges centered at the magnitude of the host galaxy and find no evidence for any concentration of galaxies at the location of the X-ray peak.
The X-ray gas is not observed to extend along the “zone of avoidance” where there is a deficit of synchrotron emission. However, the central radio wing to the SW of the core is observed to extend towards the X-ray peak: this radio component occupies a gap in the X-ray emission and the X-ray contours follow the radio contours suggesting that the synchrotron plume has pushed aside the thermal gas. The close correspondence between the X-ray and radio emission suggests a physical interaction between the radio plume and the gas responsible for the X-ray emission. X-ray gas with comparable brightness is not observed on other sides of the radio source and this argues against a scenario where the X-ray gas was centered on the host galaxy before it was displaced by the synchrotron gas.
Strom & Jägers (1988) suggested that thermal gaseous halos, which are ubiquitous in giant ellipticals, may be the cause for gradients in the observed Faraday depolarization along radio lobes. In the case of PKS B1545321, the offset thermal gas environment observed in the PSPC images, along with any thermal gas halo associated with the host elliptical galaxy, may be responsible for the increased depolarization observed towards the central regions of the outer lobes and, in particular, towards the SW parts.
3.2 The renewed activity
Although the outer lobes appear to be relics of a powerful radio source in which the energy injection via beams has recently ceased, the nucleus is currently active as evidenced by the visibility of the radio core. The current activity appears as twin beams with bright ends that are well recessed from the ends of the source. At these ends the B-field is circumferential and the polarized intensity peaks are on either side of the total intensity peaks suggesting that the beams terminate at these relatively bright components located well short of the ends of the outer lobes. When powerful beams that terminate in hotspots at the ends of FR II double radio sources decline in beam power, we would expect the forward advance speeds of the hotspots to decline and the decreased beam power may also impact on the beam collimation and stability; we would not expect the hotspots to recess or retreat. The two double radio structures share a common core component and a common radio axis, both are likely to have been produced as a result of different episodes of nuclear activity in this common central engine and the restarting has happened without any change in the direction of the ejection axis. PKS B1545321 appears to be a striking example of restarted activity in a powerful radio galaxy in which new beams are observed in the act of ploughing through the relict cocoon of past activity.
The 1.4 GHz total power of the inner double is W Hz-1 placing it below the FR I-FR II divide. The inner double has a linear size of 340 kpc and if we compare with 3CRR sources in the size range 300–400 kpc, the inner double in PKS B1545321 has a radio power that is more than an order of magnitude below the lowest power observed for edge brightened sources. Given its relatively low power, the structure of the inner double might be expected to resemble edge-darkened sources and have bright inner jets and a bright core. However, the morphology of the inner double is edge brightened and this is typical of powerful FR II radio sources spanning a wide range of linear sizes. Additionally, no bright jets are observed and the core contains less than 5% of the total power of the inner double: these properties are also more representative of FR II type sources (Muxlow & Garrington, 1991).
The inner double has an FR II morphology. The relation between the optical magnitude of the host galaxy versus radio power (Owen, 1993) indicates that an FR II type double source, with an optical magnitude corresponding to the host of PKS B1545321, would have a 1.4 GHz radio power in the range – W Hz-1 if it were evolving in an IGM environment. The observed radio power of the inner lobe is lower by a factor in the range 4–1000. FR II sources in IGM environments are inferred to be advancing with speeds a few percent of the speed of light (Scheuer, 1995). If we assume that the low observed power in the inner lobes is owing to a 1D expansion of the post-hotspot material (which has a tangled B-field) along the source axis and in the relatively low density cocoon environment, we infer that the inner lobes are advancing with speeds that are a factor 2–64 greater than that in sources in IGM environments. The inner double in PKS B1545321 is expanding with speeds exceeding 0.1 and its age is inferred to be less than yr.
Edge-brightened radio galaxies over a wide range of linear sizes from parsecs to several megaparsecs have overall a self-similar morphology (Alexander, 2000; Subrahmanyan, Saripalli & Hunstead, 1996); the inner double in PKS B1545321, although it is edge brightened has a very different structure. The lobes of the inner double are about 12–14 kpc wide all along their lengths. This width is larger than known jet widths; however, the high axial ratio lobes do not resemble the cocoons that we see typically associated with FR II radio galaxies. The inner double, viewed as a separate radio source, has one of the highest axial ratio lobes among known edge brightened radio galaxies and, as mentioned in section 2.2, a remarkable feature of the inner double is its almost constant width. The high axial ratio in which the total length is about 26 times the width, is nearly twice larger than the highest axial ratio observed among 3CRR radio galaxies that have sizes 300–400 kpc.
The indications are that the unusual circumstances in which the new beams are evolving — emerging into a relic synchrotron plasma instead of ambient thermal gas — dramatically alters the dynamical evolution resulting in an edge-brightened structure, with a high axial ratio, in a relatively low luminosity source.
3.3 The structure and development of the restarted beams
The edge-brightening observed in total intensity along the boundaries of the short trails at the ends of N2 and S2, together with the flip in the B-field from being transverse to the radio axis along the centre to a parallel configuration at both boundaries, suggests that the flow is along the center and post-hotspot plasma forms a sheath or cocoon. The enhanced fractional polarization at the boundaries, together with the parallel B-field configuration, suggest a compression of this sheath plasma. Although the inner lobes are observed to be of constant width, implying that the lateral expansion is insignificant, the surface brightness in the inner lobes decreases and the spectral index steepens towards the core. The inner lobe properties, including the width and surface brightness, are observed to be continuous and unchanged as S2 traverses the “zone of avoidance”.
The new beam propagates into the cocoon formed in the past activity phase. The ambient medium is, therefore, not galactic or intergalactic thermal gas, as is usually the case, but synchrotron plasma. The two parameters that govern the beam propagation: the Mach number of the jet flow, which depends on the sound speed in the ambient gas, and the ratio of the density of the jet material to the ambient medium will both be unusual. The density of the synchrotron plasma is expected to be lower than that for an IGM environment unless there is substantial entrainment. The lobes of GRGs are overpressured with respect to the IGM (Subrahmanyan & Saripalli, 1993; Saripalli, Subrahmanyan & Udaya Shankar, 2002). In cluster environments, where the ambient intra-cluster medium (ICM) surrounding radio sources has been observed, the radio lobes create synchrotron cavities sweeping aside most of the ambient gas (Böhringer et al., 1993). These suggest that the sound speed in the environment of the inner lobes is higher as compared to the IGM environment encountered at the ends of the beams that created the outer lobes. Additionally, the density contrast between the beams and the environment is lower for the restarted beams. Cocoon formation is pronounced when light, supersonic beams encounter high densities (Norman et al., 1982); in the case of the restarted beams only weak shocks are expected as the (mildly supersonic) beam impinges on the relic synchrotron cocoon. The beam is expected to propagate almost ballistically and the formation of strong hotspots as well as cocoons is inhibited. The shocked post-hotspot jet material would not spread out; instead, it is expected to move forwards trailing behind the hotspot (Williams, 1991). The extremely narrow, constant width and weak cocoon with decreasing surface brightness towards the center that we see in the inner double of PKS B1545321 could be representing just such a trail. The surface brightness at the ends of the inner double is significantly lower than the typical surface brightness of hotspots in edge-brightened radio galaxies (Hardcastle et al., 1998): this is consistent with the weak Mach disks that were produced in the simulations of restarted jets made by Clarke & Burns (1991). On the other hand, we do not detect any feature in the surrounding outer lobes resembling the bow shock predicted in their simulations.
The forward advance speed of the inner lobes is expected to be higher than that in powerful sources in which beams encounter relatively denser IGM or inter-stellar medium (Clarke & Burns, 1991). The exceptionally high axial ratio of the inner double as compared to sources of similar size suggest an unusually high axial advance speed for the inner double. In addition, the parallel B-field configuration seen in the cocoon can be representing the natural outcome of anisotropic expansion of a tangled field (Leahy, 1991). As discussed in the section 3.2, the greater expansion losses could be the cause for the relatively low luminosity of the inner double as compared to edge-brightened sources that have similar sizes. The axial expansion of the cocoon plasma, due to forward momentum of the post-hotspot material, will have an effect on the spectral index distribution in the case of a curved electron energy spectrum and may be a contributing factor for the spectral steepening seen away from the ends. Ageing of the synchrotron plasma after it leaves the hotspot is commonly held as the main cause for the gradual steepening of the spectral index towards the core; however, the inner double has been inferred to have an age yr and significant spectral steepening is not expected in this time.
A few rare examples of radio galaxies, such as the GRG 4C39.04, do have constant width and high axial ratio lobes similar to that in the inner double. Constant width cocoons in these sources have been attributed to static pressure balance (as suggested for 4C39.04 by Hine (1979)) or to ram pressure balance in the transverse direction against a falling external density medium (as suggested for the GRG 8C 0821+695 by Lacy et al. (1993)). The inner double in PKS B1545321 is developing within the outer relic lobes that have displaced most of the intergalactic thermal material and the uniformity in the brightness of the outer lobes in the vicinity of the inner double implies that here the synchrotron plasma, including any thermal entrainment, is uniform. Therefore, ram pressure in a falling external density is unlikely to be the cause for the constant width of the inner double.
The inner lobes as well as their environment — the relic outer lobes — are both synchrotron plasma and, unless entrainment is significant or there are departures from minimum energy conditions, differences in surface brightness reflect differences in internal pressures. If we assume minimum energy conditions, the short trails behind the two ends of the inner double are 10 times over-pressured with respect to the surrounding outer lobe plasma. Regions of lower surface brightness farther from the ends and towards the core are also over-pressured, but by smaller factors. The limb-brightening in total intensity and fractional polarization, together with the parallel B-fields along the boundaries of the inner lobes, support the suggestion that the inner lobes are over-pressured and not statically pressure confined. In this context, the constancy of the width of the inner lobe suggests that either the lateral expansion speed (which results in a ram pressure confinement of the inner lobes) is much smaller than the forward advance speed of the ends of the inner lobes, or that the inner lobes are confined by other mechanisms (e.g. magnetic confinement).
On both sides, the inner double is observed to gradually bend over its entire length. The bending is reflection symmetric about the core. The observations imply that the jet is bent and that it follows a curved path. The cocoon/sheath follows the jet along its curved path forming a trail along the bent jet. Sharp bends and wiggles that are reflection symmetric might be caused by accelerations experienced by the host as a result of interactions with close companions (Begelman et al., 1984); however, the observed bending in the inner double is gradual and all along the length suggesting that the bending is not due to any momentary interaction. Such gradual reflection symmetric bends are more likely to be caused by relative motions of the host galaxy and the surrounding medium; however, it is unlikely that any relative motion between the host galaxy and the IGM will affect the new beams that are shielded from the IGM by the synchrotron plasma of the outer lobes. The jet probably deviates from a straight path because there is a continuous bending arising from an interaction at the ends of the beams with the surrounding cocoon material. Large scale density or pressure gradients in the surrounding outer relic lobes with a component perpendicular to the radio axis could cause bending of both jets towards a common direction. In such a case, the lateral bending force would have to result in a velocity component, transverse to the radio axis, that is about 4% of the forward velocity. The immediate environment of the jets is the synchrotron plasma in the backflowing outer lobe and here we do not observe increased emissivity (and synchrotron pressure) on the convex side of the bend. Neither do we observe any gradients in RM transverse to the radio axis and in the vicinity of the inner lobes. Although there is evidence for a transverse gradient in depolarization (see section 2.1) it is in the opposite sense to that required to account for the bend.
The inner and outer lobes are collinear implying that the ejection axis has not changed in the restarting. Unless the channels in which the beams feeding the outer lobes closed, the restarted beams may be expected to follow the old paths and, if the past beams followed curved trajectories just before they stopped we may expect the new beams to follow the same curved trajectories. The observation that the trajectories of the new beams are towards emission peaks at the ends of N1 and S1 supports such a scenario.
4 A comparison with restarting inner doubles proposed previously
Although several cases of radio galaxies with evidence for recurrence have been recognized, detailed observations of the inner double structures exist in the literature for only a few: J0116473 (Saripalli, Subrahmanyan & Udaya Shankar, 2002), 3C219 (Clarke et al., 1992), 3C288 (Bridle et al., 1989) and 3C424 (Black et al., 1992). 3C219 and 3C424 have a prominent stunted jet only on one side. Inner doubles that represent a restarting phase may be recognized by two main properties: a higher surface brightness and a circumferential B-field configuration at their ends. The inner double in PKS B1545321 displays both of these properties most clearly. This is also the case for the inner double in J0116473. In all examples of restarting inner doubles observed to date the inner double is very narrow and although there is a brightening at the ends (weak hotspot) there are no lobes of the kind observed in normal edge brightened radio sources. In 3C424, J0116473 and PKS B1545321 the cocoon is recognized by a trail of emission behind the hotspot and this trail has a falling surface brightness towards the core. These trails are observed to have sharp edges indicating that we might be observing a contact discontinuity between the new cocoon and the relic cocoon. The new cocoons are also observed to have projected magnetic fields that are parallel to the edges: this is further evidence suggesting that the material spewn out in the new phase is confined by the relic cocoon environment and that the inner doubles might not have extensive cocoons beyond what is observed. Our observations suggest a constant width for the cocoon of the inner double in PKS B1545321. It is interesting that in the re-started source 3C219 as well there is evidence for a 3–4 times wider cocoon of constant width surrounding the jet.
5 Summary
We have presented observations of the giant radio galaxy PKS B1545321 that is a spectacular example of a source undergoing a renewal of nuclear activity. The new activity is manifest as twin, narrow, edge brightened radio structures that are symmetric about a radio core and fully embedded within more extended and diffuse outer lobes. The inner double structure has an exceptionally large axial ratio. It is suggested that the high axial ratio and absence of wide lobes are a result of the evolution in a synchrotron plasma environment. The unusual development is also expected to result in an unusually high forward advance for the ends of the new beams and this is probably the cause for the low observed radio luminosity for the inner double. Improved imaging of the inner lobes with the VLA are underway and these will be presented along with a model for the evolution of the inner double in a later paper.
The relic outer lobes in this source have sharp edges and an axial ratio similar to the typical values for powerful radio galaxies. These outer lobes are also characterized by a close correspondence between the total intensity structures and magnetic field all along the large scale structure. The dynamically evolving state of the outer lobes is interpreted as implying that the beams to the outer lobes switched off relatively recently and that the restarting has occured on a timescale small as compared to the dynamical timescale of the outer lobes.
References
- Alexander (2000) Alexander, P. 2000, MNRAS, 319, 8
- Black et al. (1992) Black, A. R. S., Baum, S. A., Leahy, J. P., Perley, R. A., Riley, J. M., & Scheuer, P. A. G. 1992, MNRAS, 256, 186
- Begelman et al. (1984) Begelman, M. C., Blandford, R. D., & Rees, M. J. 1984, Rev. Mod. Phys., 56, 255
- Böhringer et al. (1993) Böhringer, H., Voges, W., Fabian, A. C., Edge, A. C., & Neumann, D. M. 1993, MNRAS, 264, L25
- Bridle et al. (1989) Bridle, A. H., Fomalont, E. B., Byrd, G. G., & Valtonen, M. J. 1989, AJ, 97, 674
- Burles et al. (1999) Burles, S., Nollett, K., Truran, J., & Turner, M. S. 1999, Phys. Rev. Lett., 82, 4176
- Clarke et al. (1992) Clarke, D. A., Bridle, A. H., Burns, J. O., Perley, R. A., & Norman, M. L. 1992, ApJ, 385, 173
- Clarke & Burns (1991) Clarke, D. A., & Burns, J. O. 1991, ApJ, 369, 308
- Giovannini et al. (1988) Giovannini, G., Feretti, L., Gregorini, L., & Parma, P. 1988, A&A, 199, 73
- Hardcastle et al. (1998) Hardcastle, M. J., Alexander, P., Pooley, G. G., & Riley, J. M. 1998, MNRAS, 296, 445
- Hine (1979) Hine, R. G. 1979, MNRAS, 189, 527
- Jones & McAdam (1992) Jones, P. A., & McAdam, W. B. 1992, ApJS, 80, 137
- Lacy et al. (1993) Lacy, M., Rawlings, S., Saunders, R., & Warner, P. J. 1993, MNRAS, 264, 721
- Leahy (1991) Leahy, J. P. 1991, in Beams and Jets in Astrophysics, ed. P. A. Hughes (Cambridge: Cambridge Univ. Press), 100
- Muxlow & Garrington (1991) Muxlow, T. W. B., & Garrington, S. T. 1991, in Beams and Jets in Astrophysics, ed. P. A. Hughes (Cambridge: Cambridge Univ. Press), 52
- Norman et al. (1982) Norman, M. L., Winkler, K. -H. A., Smarr, L., & Smith, M. D. 1982, A&A, 113, 285
- Owen (1993) Owen, F. N. 1993, in Jets in Extragalactic Radio Sources, ed. H. -J. Röser, & K. Meisenheimer (New York: Springer), 273
- Roettiger et al. (1994) Roettiger, K., Burns, J. O., Clarke, D. A., & Christiansen, W. A. 1994, ApJ, 421, L23
- Saripalli, Subrahmanyan & Udaya Shankar (2002) Saripalli, L., Subrahmanyan, R., & Udaya Shankar, N. 2002, ApJ, 565, 256
- Saripalli et al. (1986) Saripalli, L., Gopal-Krishna, Reich, W., & Kühr, H. 1986, A&A, 170, 20
- Schoenmakers et al. (2000) Schoenmakers, A. P., de Bruyn, A. G., Röttgering, H. J. A., van der Laan, H., & Kaiser, C. R. 2000, MNRAS, 315, 371
- Scheuer (1995) Scheuer, P. A. G. 1995, MNRAS, 277, 331
- Shimmins & Bolton (1974) Shimmins, A. J., & Bolton, J. G. 1974, Australian J. Phys. Suppl. 32, 1
- Simpson et al. (1993) Simpson, C., Clements, D. L., Rawlings, S., & Ward, M. 1993, MNRAS, 262, 889
- Slee (1977) Slee, O. B. 1977, Australian J. Phys. Suppl. 43, 1
- Strom & Jägers (1988) Strom, R. G., & Jägers, W. J. 1988, A&A, 194, 79
- Subrahmanyan, Saripalli & Hunstead (1996) Subrahmanyan, R., Saripalli, L., & Hunstead, R. W. H. 1996, MNRAS, 279, 257
- Subrahmanyan & Saripalli (1993) Subrahmanyan, R., & Saripalli, L. 1993, MNRAS, 260, 908
- Williams (1991) Williams, A. G. 1991, in Beams and Jets in Astrophysics, ed. P. A. Hughes (Cambridge: Cambridge Univ. Press), 342
- Wright et al. (1991) Wright, A. E., Wark, R. M., Troup, E., Otrupcek, R., Jennings, D., Hunt, A., & Cooke, D. J. 1991, MNRAS, 251, 330
| Frequency (MHz) | Flux density (Jy) | Reference |
|---|---|---|
| 80 | 14 | Slee (1977) |
| 843 | 3.6 | Subrahmanyan, Saripalli & Hunstead (1996) |
| 1384 | 1.8 | This work |
| 2496 | 1.1 | This work |
| 5000 | 0.29 | Shimmins & Bolton (1974) |
| 8400 | 0.07 | Wright et al. (1991) |