Discovery of type-I X-ray bursts from the low-mass X-ray binary 4U 1708–40
Abstract
We report the discovery of type-I X-ray bursts from the low-mass X-ray binary 4U 1708–40 during the 100 ks observation performed by BeppoSAX on 1999 August 15–16. Six X-ray bursts have been observed. The unabsorbed 2–10 keV fluxes of the bursts range from () erg cm-2s-1. A correlation between peak flux and fluence of the bursts is found, in agreement with the behaviour observed in other similar sources. There is a trend of the burst flux to increase with the time interval from the previous burst. From the value of the persistent flux we infer a mass accretion rate /yr, that may correspond to the mixed hydrogen/helium burning regime triggered by thermally unstable hydrogen. We have also analysed a BeppoSAX observation performed on 2001 August 22 and previous RXTE observations of 4U 1708–40, where no bursts have been observed; we found persistent fluxes of more than a factor of higher than the persistent flux observed during the BeppoSAX observation showing X-ray bursts.
keywords:
accretion, accretion discs – stars: individual(4U 1708–408) – stars: neutron – X-rays: general1 Introduction
Many low-mass X-ray binaries (hereafter LMXBs) are known to show type-I X-ray bursts which have proven to be important diagnostic tools for these systems (see Lewin, van Paradijs & Taam 1995 for a review). X-ray bursts are thought to originate from thermonuclear flashes, caused by thermal instabilities, in the accreted matter on the surface of weakly magnetized neutron stars (NS). The time interval between the bursts ranges from tens of minutes to days. In a source the burst activity can stop for periods from days to months (but also years, as, for example, in the case of transient sources). In some cases, a relation has been observed between burst properties and persistent flux. As the persistent flux increases the recurrence time between bursts tends to increase (typically from a few hours to more than a day) and the bursts become less energetic (e.g., Hoffman, Lewin & Doty 1977). For instance, in the case of 4U 1705–44 the persistent flux increased by a factor while the burst intervals increased by a factor of (Langmeier et al. 1987; Gottwald et al. 1989). When the persistent flux increases further the bursts disappear completely. This behaviour is observed in several sources like, for example, MXB 1659–29 (Lewin, Hoffman & Doty 1976), GX 3+1 (Makishima et al. 1983) and EXO 0748–673 (Gottwald et al. 1986). However, in other sources (e.g. 4U 1820–30: Clark et al. 1977; 4U 1728–34: Basinska et al. 1984) the opposite behaviour was sometimes observed: the recurrence time between bursts decreased while the persistent flux increased. Nevertheless, at least in the case of 4U 1820–30 (Clark et al. 1977), the bursts (again) disappear for higher acretion rates, when the source is in its high state.
Current theories of type-I X-ray bursts (Fujimoto et al. 1981; Fushiki and Lamb 1987; see Bildsten 2000) predict three different regimes in mass accretion rate for unstable burning: i) mixed H/He burning triggered by thermally unstable H ignition, at low accretion rates ( /yr); ii) pure He shell ignition following steady H burning, at intermediate accretion rates ( /yr /yr); iii) mixed H/He burning triggered by thermally unstable He ignition at high accretion rates ( /yr /yr). At even higher steady He burning occurs, the nuclear fuel for the burst is depleted, causing the bursts to disappear completely. On the basis of these theories, an anticorrelation between persistent flux and burst recurrence time is expected; since as increases a lower amount of time is needed to accumulate the critical amount of fuel necessary to begin the burst, the recurrence time between bursts is expected to decrease with increasing . This is contrary to what is observed (e.g., Hoffman, Lewin & Doty 1977; van Paradijs, Penninx & Lewin 1988). There are basically two interpretations for these observations. van Paradijs et al. (1988) found evidence of a continuous stable burning of accreted nuclear fuel in burst sources; the observed correlation between persistent emission and burst recurrence time can be explained as the rate of this stable burning, increasing, removes nuclear fuel for thermonuclear flash. Recently, Bildsten (2000) proposed that another solution of this mismatch between theory and observations can be obtained by relaxing the hypothesis of spherical accretion and assuming that the accretion of fresh material only occurs on a fraction (e.g., the equator) of the NS surface. The crucial parameters, in this case, is the accretion rate per unit area: if the covered area increases enough with increasing , the accretion rate per unit area indeed decreases. Indeed, the whole scenario is not completely clear yet, since recent results (e.g. Muno et al. 2000; Franco 2001; van Straaten et al. 2001) suggest that there is not a unique trend between and burst properties for all the sources.
Type-I X-ray burst profiles depend strongly on photon energy: decays are much shorter at high photon energies than at low photon energies (Lewin et al. 1995). This softening of the burst spectrum during the decay results from the cooling of the NS photosphere. If the luminosity during the burst reaches the Eddington limit , the NS photosphere expands. Since for a blackbody (see below) , when the radius of the photosphere R expands, the effective temperature decreases (Tawara et al. 1984; Lewin, Vacca & Basinska 1984; Vacca, Lewin & van Paradijs 1986).
In this paper we report on the discovery of type-I X-ray bursts from the LMXB 4U 1708–40 (Forman et al. 1978) during a BeppoSAX observation. Not much is known about this system. A first analysis of the 2–12 keV X-ray spectrum of 4U 1708–40 was made by Warwick et al. (1988) using EXOSAT observations during which the 2–6 keV source flux was erg s-1 cm-2. The spectrum was well fitted by a power law with a spectral index and a column density N cm-2.
| SAX | Parameters | Power law | CompTT |
|---|---|---|---|
| 1999 | + Gaussian | + Gaussian | |
| NH | |||
| Npl (LECS) | |||
| Npl (MECS) | |||
| kT0 (keV) | |||
| kTe (keV) | |||
| NTT (LECS) | |||
| NTT (MECS) | |||
| Eline (keV) | |||
| (keV) | |||
| eqw (eV) | 344 | 286 | |
| Ftot | |||
| SAX | Parameters | Power law | |
| 2001 | + blackbody | ||
| NH | (fixed) | ||
| Npl (MECS) | |||
| kTbb (keV) | |||
| Nbb (MECS) | |||
| Ftot | |||
| RXTE | Parameters | Cutoffpl | |
| + blackbody | |||
| NH | (fixed) | ||
| Ncut | |||
| Ecut (keV) | |||
| kTbb (keV) | |||
| Nbb | |||
| Ftot |
2 Observations and Data Analysis
 |
 |
We have analysed a BeppoSAX observation of 4U 1708–40, performed on 1999 August 15–16 for a total observation time of ks. We report on results from the Low Energy Concentrator Spectrometer (LECS, a thin-window position-sensitive gas scintillator proportional counter with extended low energy response, 0.1–10 keV, and a field of view, FOV, of ; Parmar et al. 1997) and the Medium Energy Concentrator Spectrometers (MECS, position sensitive gas scintillator proportional counters operating in the 1.3–10.5 keV band, with a FOV of ; Boella et al. 1997b). The source was not detected in the Phoswich Detection System (PDS, energy range 13–200 keV; Frontera et al. 1997). For both imaging instruments we selected the data in circular regions of radius centered on the source. We used the standard response matrices and background files (1997 version for MECS and 2000 for LECS) for the spectral analysis. To analyse the BeppoSAX spectra of the source we selected the energy range 0.12–4 keV for LECS and 1.8–10 keV for MECS. In the 1999 August 15-16 BeppoSAX observation six X-ray bursts are detected. We have used LECS and MECS combined to analyse the persistent emission, the second, third, fourth and fifth bursts, and only the MECS to analyse the first and the sixth bursts, since the LECS was off in these time intervals. The BeppoSAX observation is periodically interrupted due to earth occultations and the passage through the South Atlantic Anomaly. These ‘gaps’ last on average ks after ks of on-source observation. The BeppoSAX instruments were off more often in the last part of the observation (namely between the fourth and the sixth burst) so that the on-source exposure time is ks.
We have also analysed a 150 ks BeppoSAX observation of 4U 1708–40 performed on 2001 August 22 (with an on-source exposure time of ks) and 14 (non contiguous) observations from the public RXTE data archive, five performed in 1997 and nine in 2000, with a total on-source exposure time of ks. For the RXTE observations we have used data taken with the Proportional Counter Array (PCA, which consists of five co-aligned Proportional Counter Units, PCUs, sensitive in the energy range 2–60 keV; Zhang et al. 1993). Starting from 2000 May 12, the propane layer on Proportional Counter Unit 0 (PCU0), which functions as an anticoincidence shield for charged particles, was lost. Therefore we excluded the PCU0 data from the 2000 June spectrum we have analysed. The PCA observations background, estimated using pcabckest v2.1e was also subtracted.
We produced light curves of the 2001 BeppoSAX observation and of all the RXTE observations; in all these data we did not find any burst. Although a small variation in average count rate (around 20%) occurred in the RXTE data between the 1997 observations and the 2000 observations, the light curve of each observation shows steady persistent emission without any significant variation in count rate; we analysed the spectrum of just one of the RXTE observations available, as a representative case. To analyse the PCA spectrum we have used Standard2 data in the energy range 2.5–25 keV and produced the detector response matrix with pcarsp v7.11. A systematic error of 1% was added to account for residual uncertainties in the detector calibration. We have used XSPEC v11.1.0 to fit the spectra.
3 Results
 |
 |
In the 1 s time resolution LECS and MECS light curves of the 1999 observation we see persistent emission, at a count rate of counts/s in the MECS light curve. The light curve also shows six X-ray bursts (the times at which each burst occurred are reported in Table 2). The bursts last s. Excluding the bursts, the persistent emission does not show significant intensity variations during the whole observation. Five bursts out of six exhibit a rapid rise ( sec) followed by a slower decay, whereas one of the bursts (the fourth) has a triangular shape with approximatly equal rise and decay times of 20 sec. In Fig. 1 we show the light curve in the MECS range (upper panel) and the corresponding hardness ratio (HR keV keV, bottom panel) of the first burst, the one observed with the best statistics (the behaviour of the other bursts are comparable with this). The hardening during the rise and the softening during the decay, together with the shape of the bursts, identify 4U 1708–40 as a type-I X-ray burster.
3.1 Persistent Emission
We produced LECS and MECS spectra of the persistent emission of the 1999 August 15–16 observation of 4U 1708–40 excluding intervals of 200 s around (starting about 70 s before) each of the six detected bursts. The spectrum in the range 0.12–10 keV is shown in Fig. 2. We fit the spectrum with a power law corrected for photoelectric absorption and a Gaussian emission line at keV which gives a reduced of for 420 (the reduced without the Gaussian emission line is 1.3 for 423 ). We find a high equivalent hydrogen column density, N cm-2, consistent with the position of the source in the direction of the galactic center, and a power law photon index . No significant thermal component (i.e., blackbody) is found (with an upper limit on the flux of erg cm-2s-1, fixing the blackbody temperature to 1.3 keV, see below). The 2–10 keV flux is erg cm-2s-1, corresponding to a luminosity of erg s-1 at a distance of 8 kpc (see Section 4). We obtain a fit of similar quality (reduced with 421 d.o.f.) using the Comptonisation model CompTT (Titarchuk 1994a,b), with a slightly lower column density, N cm-2, and a Gaussian emission line at keV. In Table 1 we show the fit parameters of the persistent emission corresponding to these two models.
For comparison we have also analysed the 4U 1708–40 spectrum during one of the RXTE observations (the 3 ks observation performed in 2000 June 18, obsID 50060-04-01-00). A simple absorbed (the column density was fixed to N cm-2, in accordance with the BeppoSAX spectrum) power law is not able to fit the spectrum in the whole energy range. A blackbody component with a color temperature of keV is needed to adequatly fit the data (an F-test gives a probability of chance improvement of the fit for the addition of this component of ). A high energy cutoff at relatively low energy (E keV) is also necessary (reduced with 44 d.o.f.). We show this spectrum, together with residuals in units of with respect to the best-fit model, in Fig. 3 and the best-fit parameters in Table 1. We measure a 2–10 keV unabsorbed flux of erg cm-2s-1, a factor times higher than the flux of the persistent emission we measure during the BeppoSAX observation. In Fig. 3 we note residuals around 6–7 keV. For comparison with the spectrum during the 1999 August 15–16 BeppoSAX observation, we tried to add a Gaussian emission line in the range 6.4–6.9 keV. We find a Gaussian line at keV with an equivalent width of 87 eV. The parameters of the other components does not change significantly.
We have also analysed the MECS spectrum of the BeppoSAX observation performed on 2001 August 22. The best-fit is obtained using a power law with a slope of , and a blackbody with a color temperature of kT keV (reduced with 172 d.o.f.; Table 1). The spectrum is compatible with a Gaussian emission line between 6.4 and 6.7 keV, similar to the one used to fit the source spectrum during the previous BeppoSAX and RXTE observations, although this component is not required in this case. The unabsorbed 2–10 keV flux is erg cm-2s-1. This model is consistent with the best-fit model of the PCA 2–10 keV spectrum, that is well fit with a power law with a and a blackbody with a color temperature of keV.
| burst # (time) | kTbb | Nbb | F |
|---|---|---|---|
| 1 (21655 s) | |||
| 2 (29160 s) | |||
| 3 (39620 s) | |||
| 4 (52350 s) | |||
| 5 (57498 s) | |||
| 6 (91064 s) |
3.2 X-ray Bursts
We have analysed the six X-ray bursts of the 1999 BeppoSAX observation. We do not have enough statistics to select different intervals during the bursts and analyse the rise and decay spectra separately. Therefore we have analysed six spectra (one for each burst) each averaged over the whole s burst duration. From these spectra we have subtracted the spectrum of the persistent emission and fitted them with a blackbody component. In Table 2 we show the results of the fits for each of the six bursts. Note that, because the spectra of the bursts soften significantly during the observation (see Fig. 1) the fit parameters, such as blackbody color temperatures, have to be considered average estimates over the bursts.
4 Discussion
We have analysed two BeppoSAX observations (taken in 1999 and 2001) and RXTE observations (taken in 1997 and 2000) of 4U 1708–40 and discovered this source to be an X-ray burster. This allows us to classify 4U 1708–40 as a NS system. In the 1999 BeppoSAX observation we found six bursts. Five bursts have a rapid rise ( s) with a slow decay ( s), and one has a triangular shape, although it shows spectral properties similar to those of the other bursts. The fluxes of the persistent emission in the RXTE observations and in the 2001 BeppoSAX observation are and times, respectively, higher than the flux of the persistent emission in the 1999 BeppoSAX observation. While we observe six bursts during the 1999 BeppoSAX observation we do not observe any burst during the RXTE observations and during the 2001 BeppoSAX observation. This would be in agreement with the general behaviour of X-ray bursters: the bursts disappear above a certain flux value due to steady nuclear burning (e.g., van Paradijs et al. 1979; van Paradijs et al. 1988; see Lewin et al. 1995 for a review).
Several sources show a correlation between the peak flux and the fluence of the bursts (e.g. Sztajno et al. 1983; Basinska et al. 1984; Lewin et al. 1987). Some of them also show a saturation in the peak flux at high fluences, which has been explained by the fact that the luminosity has reached a critical value that can be interpreted as the Eddington limit luminosity. One of the best examples is MXB 1728-34 (Basinska et al. 1984; Di Salvo et al. 2000; Galloway et al. 2002). This property can be used to infer the distance to the source. In Fig. 4 we plot the flux at the peak (calculated using the count rate at the peak of the burst in the 0.3 s resolution light curve) versus the fluence (the average bolometric flux times the duration of the burst) for each of the six bursts of 4U 1708–40. The plot shows an approximately linear correlation between and . Although we do not see a saturation of in this correlation (and therefore we cannot derive the Eddington luminosity and the distance to the source) we can at least give an upper limit to the distance assuming the highest peak flux of the bursts to be less than . Since erg s-1 (assuming and correcting for gravitational redshift; van Paradijs & McClintock 1994), taking the bolometric flux at the peak of the first burst ( erg cm-2s-1), we obtain kpc, not a stringent constraint. Since the source is in the direction of the galactic center we assume 8 kpc as the source distance. At 8 kpc saturation would occur at 4 times this flux level.
 |
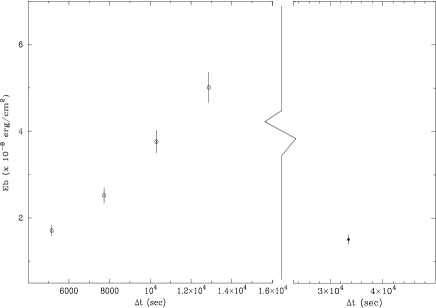 |
Note that, as was pointed out by many authors, sometimes not all the accreted fuel is burned during the burst event, and the presence of a residual fuel can have significant implications for the lack of regularity of the burst behaviour (Ayasly & Joss 1982; Hanawa & Fujimoto 1984; Woosley & Weaver 1985; Lewin et al. 1995). To investigate this point we have also calculated the values of =(GM/R)/ (an observational quantity defined as the ratio of the average total energy in the persistent emission to that emitted in the burst) which is expected to be for a thermonuclear burst in the mixed hydrogen/helium burning regime (e.g., Lewin et al. 1995). We measure for all the bursts, but one, starting from the first burst. Given that the accretion rate is consistent with being constant, this implies a correlation between the time interval during which matter accretes onto the NS and the energy emitted in the following burst. The only exception is the last burst for which, assuming that the fifth and the sixth bursts are consecutives, we find a value for that is much larger than 40 (). In Fig. 5 we plot the fluence of the bursts as a function of the time interval between each burst and the previous one. There is a clear trend of the fluence to increase with the time interval for all the bursts, except the sixth. This trend is in agreement with the behaviour of other sources (Lewin et al. 1995 for a review) and with the expectation that the longer the burst interval is, the larger is the amount of nuclear fuel available for the burst. The sixth burst seems not to follow this trend. Most probably we have missed some bursts in between the fifth and the sixth because of the presence of gaps (see §2). Indeed, we find a gap about 3000 s before the sixth burst, just where, following the correlation in Fig. 5, we would expect to find another burst.
Based on the observed persistent flux and the distance to the source, we can estimate the accretion rate and therefore the burning regime expected in this case. We find /yr. This corresponds to the mixed hydrogen/helium burning regime triggered by thermally unstable hydrogen (Fujimoto et al. 1981; Fushiki and Lamb 1987; see also Bildsten 2000). This is consistent with the value of we find for almost all the bursts.
Acknowledgements
SM acknowledges financial support from the Nederlandse Organisatie voor Wetenschappelijk Onderzoek. TB acknowledges the CARIPLO foundation for financial support. WHGL is grateful for support from NASA. We would like to thank the anonymous referee for helpful comments on the paper.
References
- [] Ayasli, S., Joss, P.C., 1982, ApJ, 256, 637
- [] Basinska, E.M., Lewin W.H.G., Szyajno, M., Cominsky, Marshall, F.J., 1984, ApJ, 281, 337
- [] Bildsten, L., 2000, in Stephen S. Holt and William W. Zhang, eds, Cosmic Explosions: Tenth Astrophysics Conference, AIP Conference Proceedings, Vol. 522, College Park, Maryland, 11-13 Oct 1999. American Institute of Physics, 2000, p.359-369, /astro-ph/0001135
- [] Boella, G. et al., 1997, A&AS, 122, 327
- [] Clark, G.W., Li, F.K., Canizares, C., Hayakawa, S., Jernigan, G., Lewin, W.H.G., 1977, MNRAS, 179, 651
- [] Di Salvo, T., Iaria, R., Burderi, L., Robba, N.R., 2000, ApJ, 542, 1034
- [] Forman, W., Jones, C., Cominsky, L., Julien, P., Murray, S., Peters, G., Tananbaum, H., Giacconi, R., 1978, ApJSS, 38, 357
- [] Frontera, F., Costa, E., dal Fiume, D., Feroci, M., Nicastro, L., Orlandini, M., Palazzi, E., Zavattini, G., 1997, A&AS, 122, 357
- [] Fujimoto, M.Y., Hanawa, T., Miyaji, S., 1981, ApJ, 247, 267
- [] Fushiki, I., Lamb, D.Q., 1987, ApJ, 323, L55
- [] Galloway, D.K., Psaltis, D., Chakrabarty, D., Muno, M.P., 2002, ApJ, submitted, /astro-ph/0208464
- [] Gottwald, M., Haberl, F., Parmar, A.N., White, N.E., 1986, ApJ, 308, 213
- [] Gottwald, M., Haberl, F., Langmeier, A., Hasinger, G., Lewin, W. H. G., van Paradijs, J., 1989, ApJ, 339, 1044
- [] Hanawa, T., Fujimoto, M.Y., 1984, PASJ, 36,119
- [] Hoffman, J.A., Lewin, W.H.G., Doty, J., 1977, MNRAS, 179, 57
- [] Langmeier, A., Sztajno, M., Hasinger, G., Truemper, J., Gottwald, M., 1987, ApJ, 323, 288
- [] Lewin, W.H.G., Hoffman, J.A., Doty, J., 1976, IAU Circ., 2994
- [] Lewin, W.H.G., Vacca, W.D., Basinska, E.M., 1984, ApJ, 277, L57
- [] Lewin, W.H.G., Penninx, W., van Paradijs, J., Damen, E., Sztajno, M., Truemper, J., van der Klis, M., 1987, ApJ, 319, 893
- [] Lewin, W.H.G., van Paradijs, J., Taam, R.E., 1995, in Lewin W.H.G., van Paradijs J., van den Heuvel E.P.J., eds, X-ray binaries, 1995, Cambridge Univ. Press, Cambridge
- [] Makishima, K. et al., 1983, ApJ, 267, 310
- [] Parmar, A.N. et al., 1997, A&AS, 122, 309
- [] Shimura, T., Takahara, F., 1995, ApJ, 445, 780
- [] Sztajno, M., Basinska, E.M., Cominsky, L.R., Marshall, F.J., Lewin, W.H.G., 1983, ApJ, 267, 713
- [] Taam, R.E., Picklum, R.E., 1979, ApJ, 233, 327
- [] Tawara et al., 1984, ApJ, 276, L41
- [] Titarchuk, L., 1994a, ApJ, 343, 313
- [] Titarchuk, L., 1994b, ApJ, 429, 340
- [] Vacca, W.D., Lewin, W.H.G., van Paradijs, J., 1986, MNRAS, 220, 339
- [] van Paradijs, J., Cominsky, L., Lewin, W.H.G., Joss, P.C., 1979, Nature, 280, 375
- [] van Paradijs, J., Penninx, W., Lewin, W.H.G., 1988, MNRAS, 233, 437
- [] van Paradijs, J., McClintock, J.E., 1994, A&A, 290, 133
- [] van Paradijs, J., 1998, in Buccheri R., van Paradijs J., Alpar M.A., eds, The Many Faces of Neutron Stars. Dordrecht, Boston: Kluwer Academic Publishers, 279
- [] van Straaten S., van der Klis M., Kuulkers E., Mńdez M., 2001, ApJ, 551, 907
- [] Woosley, S.E., Weaver, T.A., 1985, in Woosley S.E., ed., AIP Conf. Proc. 115, High energy transients in astrophysics. AIP Press, New York
- [] Zhang, W., Giles, A.B., Jahoda, K., Soong, Y., Swank, J.H., Morgan, E.H., 1993, Proc. SPIE, 2006, 324