theDOIsuffix \Volume324 \IssueS1 \CopyrightissueS1 \Month01 \Year2003 \pagespan1 \Receiveddate19 February 2003 \Reviseddate00 March 2003 \Accepteddate00 March 2003 \Dateposted00 March 2003
Hot Molecular Gas in the Central 10 Parsecs of the Galaxy
Abstract.
We present results from observations of NH3(1,1), (2,2), (3,3), and (6,6) with the Very Large Array. The data sample the inner 10 pc (4′) of the Galaxy and have a velocity coverage of –140 to +130 km s-1. The velocity integrated NH3(3,3) image shows that the Sgr A East supernova remnant is impacting the 50 km s-1 GMC in the northeast, the northern ridge in the north, and the western streamer in the west. These results imply that the Sgr A East has a large effect on the molecular environment near Sgr A* and may be pushing much of the molecular gas away from Sgr A*. The physical properties of the western streamer and its relation to Sgr A East are discussed in detail. We also summarize the detection of hot molecular gas less than 2 pc from Sgr A* in projected distance. This gas is seen only in NH3(6,6) and has line widths of 75–85 km s-1, indicating that it is physically close to the nucleus.
keywords:
Galactic Center, ISM, radio linespacs Mathematics Subject Classification:
04A251. Introduction
At a distance of only kpc (Reid 1993), the Galactic Center provides a unique opportunity to study in detail the environment around a supermassive black hole. It is now generally accepted that a black hole of M⊙ is located at the dynamical center of the Galaxy (Eckart & Genzel 1997; Ghez et al. 1998, 2000; Schödel et al. 2002). In the radio, emission from the inner region of the accretion flow is observed as the strong ( Jy) source, Sgr A*. Sgr A* is surrounded by arcs of ionized gas (Sgr A West) that appear to be feeding the nucleus (Lo & Claussen 1983; Roberts & Goss 1993). These arcs are, in turn, surrounded by an apparent “ring” of molecular material at a radius of pc from Sgr A* called the circumnuclear disk (CND, Güsten et al. 1987). Sgr A*, Sgr A West, and the CND appear to be located near the front edge of the expanding supernova remnant (SNR), Sgr A East, but the exact position of the features along the line-of-sight is very difficult to determine (Pedlar et al 1989; Maeda et al. 2002).
For the past two decades, the origin of the clouds in the CND and the mini-spiral has remained unclear. Many attempts have been made to detect connections between two nearby giant molecular clouds (GMCs) and the CND. Okumura et al. (1989), Ho et al. (1991), and Coil & Ho (1999,2000) detect a long filamentary “streamer” in NH3(1,1) and (2,2) emission that connects the “20 km s-1 cloud” (M–0.13–0.08; Güsten, Walmsley, & Pauls 1981) to the southeastern edge of the CND. A small velocity gradient along this “southern streamer” as well as heating and increased line widths as the streamer approaches the Galactic Center indicate that gas may be flowing from the 20 km s-1 GMC towards the circumnuclear region. This connection has also been observed in HCN(3-2) (Marshall et al. 1995), 13CO(2-1) (Zylka, Mezger , & Wink 1990), and 1.1 mm dust (Dent et al. 1993). Other candidates for connections between the GMCs and the CND include a possible connection between the northeastern edge of the CND and the “50 km s-1 cloud” (M-0.03–0.07; Ho 1993) and a second connection between the 20km s-1 GMC and the southwest lobe of the CND (Coil & Ho 1999,2000).
Spectral line observations of the Galactic center are inherently difficult due to the large range of velocities in the region. In order to detect all of the emission from the CND, a velocity coverage of at least km s-1 is necessary. Near Sgr A*, clouds with velocities as high as –185 km s-1 have been detected (Zhao, Goss, & Ho 1995). Previous NH3 observations by Coil & Ho (1999,2000) focused on the kinematics of the 20 and 50 km s-1 GMCs using a velocity window of 75 km s-1 and a velocity resolution of 4.9 km s-1. Pointings were made towards Sgr A* as well as in the direction of these GMCs in the south and east.
In order to produce a more complete picture of the molecular environment at the Galactic center, we have imaged the central 10 pc of the Galaxy in NH3(1,1), (2,2), (3,3), and (6,6) with the Very Large Array222The National Radio Astronomy Observatory is a facility of the National Science Foundation operated under cooperative agreement by Associated Universities, Inc. (VLA). These data fully sample the inner 10 pc (4′) of the Galaxy and have a velocity coverage of –140 to +130 km s-1. In this article, we summarize two of the most important results of this project, but we also refer the reader to McGary, Coil, & Ho (2001), McGary & Ho (2002), and Herrnstein & Ho (2002, 2003) for more detailed discussions. The observations and data reduction are summarized in Section 2. Section 3 focuses on the velocity integrated NH3(3,3) image, which indicates that Sgr A East has a large effect on the molecular gas in the region. In Section 4, we present the results of our observations of NH3(6,6) at the Galactic Center and the detection of hot molecular gas less than 2 pc in projected distance from Sgr A*.
2. Observations and Data Reduction
The metastable (J=K) NH3(J,K) rotation inversion transitions at GHz have proven to be useful probes of dense (104–105 cm-3) molecular material near the Galactic center. They tend to have a low optical depth and a high excitation temperature at the Galactic center, making them almost impervious to absorption effects (Ho & Townes 1983). Satellite hyperfine lines separated by 10–30 km s-1 on either side of the main line enable a direct calculation of the optical depth of NH3, although the large line widths at the Galactic center make it necessary to model effects due to blending of the line profiles (Herrnstein & Ho 2002). In addition, line ratios of different transitions can be used to calculate the rotational temperature, , of the gas.
NH3(1,1), (2,2), and (3,3) were observed with the VLA in 1999 March. Observations were made in the D north-C array, which provides the most circular beam at the low elevation of the Galactic Center. With a maximum projected baseline of 1 km, this smallest configuration of the VLA provides the most sensitivity to extended features such as long, filamentary streamers. A five-pointing mosaic was centered on Sgr A* (, ), with the remaining four pointings offset by to the northeast, northwest, southeast and southwest. The resulting data fully sample the central 4′ (10 pc) of the Galaxy. By using a velocity resolution of km s-1, we were also able to obtain a velocity coverage of –140 to +130 km s-1, including almost all of the velocities observed near the nucleus. With these data, we can probe the morphology and kinematics of the entire CND as well as the surrounding molecular material.
Each pointing was calibrated separately using AIPS. (A detailed discussion of the data reduction can be found in McGary, Coil, & Ho 2001.) The data were then combined in the uv-plane and deconvolved using the Maximum Entropy Method in MIRIAD. A Gaussian taper was applied to the data to aid in the detection of extended features. The final beam size for all three transitions is roughly with a PA of . For the NH3(3,3) velocity integrated image, the noise level (calculated assuming line emission typically appears in seven channels) is Jy beam-1 km s-1 (McGary, Coil, & Ho 2001).
Observations of NH3(6,6) were made on 2001 October 1 and November 16 with a setup and spatial coverage identical to our previous NH3 data. Observations of this line, which has a frequency of 25 GHz, only recently became possible at the VLA after the upgrade of the 23 GHz receivers. These data represent the first successful observation of this line with the VLA. The data calibration and image deconvolution also used the same method as our original NH3 observations. The final beam size after application of a Gaussian taper (FWHM=) to the uv data is with a PA of . For the velocity integrated image, the noise level is Jy beam-1 km s-1.
3. The Effect of Sgr A East on the Molecular Environment
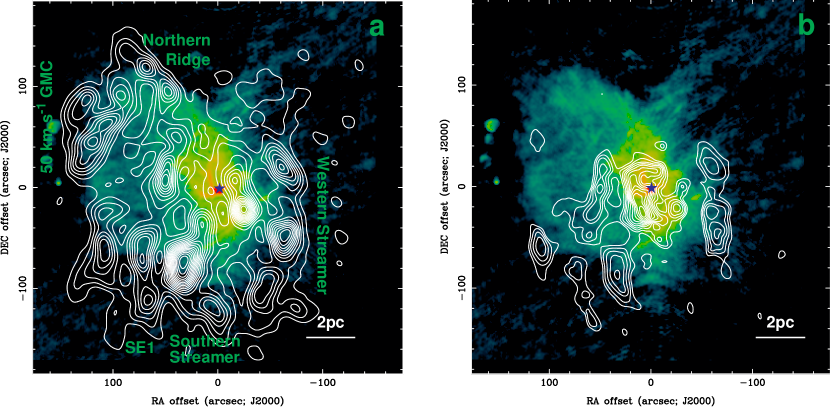
Figure 1a shows the velocity integrated NH3(3,3) image in contours overlaid on a 6 cm continuum image (Yusef-Zadeh & Morris 1987). The contours are in steps of . In the continuum image, the point source Sgr A* (, ) is the brightest feature and is labeled with a star. The Sgr A East shell appears as faint, extended emission with a roughly circular shape and centered slightly to the east of Sgr A*. NH3(3,3) is detected throughout most of the central 10 pc and the major features discussed in this paper are labeled in Figure 1a. The gain of the telescope goes to zero at the edge of the mosaic, roughly 5 pc from Sgr A*. The 50 km s-1 GMC extends beyond the mosaic to the northeast while the 20 km s-1 cloud is located almost entirely outside our mosaic, to the south of the southern streamer. However, the northern ridge and western streamer are located within the edge of our mosaic and their filamentary morphologies are real.
Some of the clouds in our image, including SE1 and the southern streamer, appear to be kinematically connected to gas near the nucleus (McGary, Coil, & Ho 2001). However, much of the gas appears to lie along the edge of the expanding Sgr A East supernova remnant (SNR). In the northeast, Sgr A East is impacting the 50 km s-1 GMC. Originally, it was believed that the molecular cloud had been pushed away from the nucleus by the expanding shell (Mezger et al. 1989; Pedlar et al. 1989). However, with a mass of M⊙ (Güsten, Walmsley, & Pauls 1981; Mezger et al. 1989), it seems unlikely that Sgr A East has a large effect on the 50 km s-1 GMC. The physical properties of the NH3 along the edge of the 50 km s-1 GMC appear to support this theory. The intrinsic line width of gas in the 50 km s-1 cloud is km s-1, roughly equal to the mean line width throughout the inner 10 pc. In addition, one would expect the gas to be heated if it is being moved by the expanding shell. The rotational temperature of the gas can be calculated from our NH3(1,1) and (2,2) data by
| (1) |
where is the ratio of the main hyperfine line of NH3(2,2) and (1,1) and is the opacity of the NH3(1,1) main hyperfine line (Ho & Townes 1983). This equation assumes equal excitation temperatures and beam filling factors for both transitions. For the 50 km s-1 cloud, we calculate a temperature of K (Herrnstein & Ho 2003), corresponding to a kinetic temperature of 25 K (Walmsley & Ungerechts 1983; Danby et al. 1988).
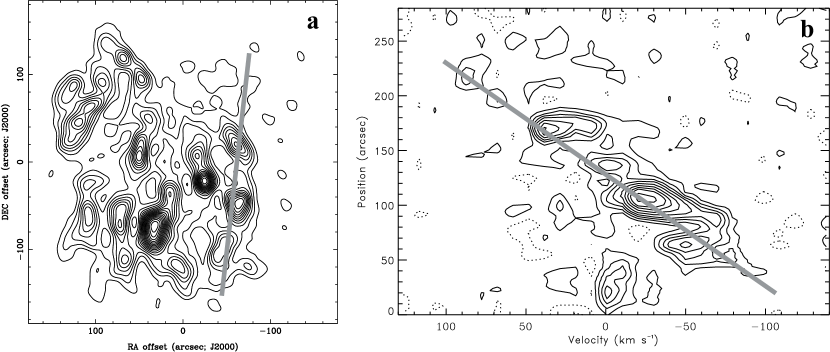
With a slightly elevated rotational temperature of 25 K, the northern ridge may have been heated by the impact of Sgr A East. However, it is the western streamer that appears to be most strongly affected by the expansion of the SNR. The western streamer has a striking velocity gradient of 1 km s-1 arcsec-1 (25 km s-1 pc-1) along its entire length of 150′′ (6 pc) (See Figure 2). The velocity gradient can be explained by a ridge of gas moving outwards with the expansion of Sgr A East and highly inclined to the line-of-sight. This scenario would place the southern part of the streamer on the front side of the shell. The western streamer also shows the largest rotational temperature of any feature in our map, with K, or a kinetic temperature near 80 K (Herrnstein & Ho 2003). Assuming an abundance of NH3 relative to H2 (X(NH3)) of (Townes et al. 1983; Harju, Walmsley, & Wouterloot 1993), the total mass of the western streamer is M⊙, more than two orders of magnitude less than the 50 km s-1 GMC (Herrnstein & Ho 2003). Observations of hot NH3 cores indicate that X(NH3) is elevated in warm environments and can be as high as (Hüttemeister et al. 1993). The mass estimate for the western streamer is therefore assumed to be an upper limit. It is not surprising that this less massive feature shows much more evidence for interaction with Sgr A East than the 50 km s-1 GMC.
In McGary, Coil, & Ho (2001), we detected evidence for a connection between the northern ridge and the northeastern lobe of the CND. A physical connection between these two features must imply that Sgr A East is close to the CND. The large impact of Sgr A East on molecular gas in the central 10 pc has led us to question whether observed connections between the GMCs and CND represent infalling material. It is possible that the Sgr A East shock front recently passed through Sgr A*, and is now pushing material away from the supermassive black hole. This scenario has also been used to explain other features at the Galactic center including an ionized gas halo surrounding Sgr A East (Maeda et al. 2002) and high negative velocity features seen near Sgr A* (Yusef-Zadeh, Melia, & Wardle 2000). Although more data are necessary to confirm or refute this theory, it is clear that a detailed understanding of Sgr A East may be necessary before we can fully understand Sgr A* and the central few parsecs of the Galaxy.
4. Hot Molecular Gas near Sgr A*
Molecular gas is expected to be heated as it approaches the nucleus. An increased rotational temperature in the part of the southern streamer closest to the CND has been used to argue that the cloud is physically close to Sgr A* (Coil& Ho 1999). However, the reality of this effect has remained in doubt because the emission also becomes faint near Sgr A*. In Figure 1a, the NH3(3,3) emission weakens and almost disappears near Sgr A*. The lack of emission in the inner 2 pc of the Galaxy could signal the existence of a molecular hole near Sgr A*. We suspected that temperatures become so high near Sgr A* that even the NH3(3,3) transition is no longer well-populated. In order to detect hot molecular gas near Sgr A*, we observed the central 4′ (10 pc) of the Galaxy in NH3(6,6) using the new 23 GHz receivers at the VLA. At 412 K above ground, NH3(6,6) has more than three times the equivalent energy of NH3(3,3).
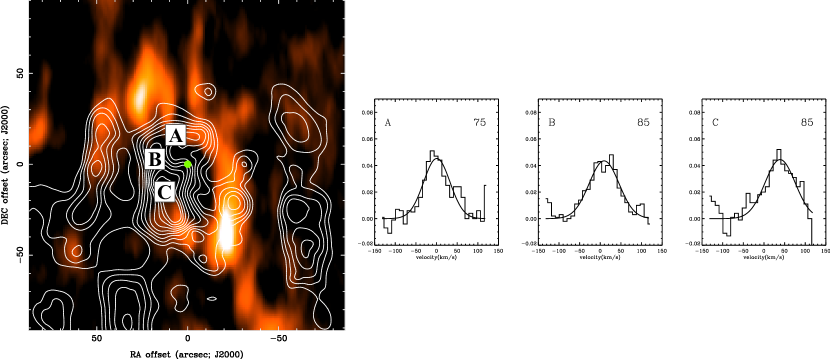
Figure 1b shows velocity integrated NH3(6,6) emission in contours in steps of overlaid on the same 6 cm continuum image. NH3(6,6) is detected in many of the features seen in lower NH3 transitions, including the western streamer, but the image is dominated by emission less than 1.5 pc (40′′) in projected distance from the nucleus. Figure 3a overlays the velocity integrated NH3(6,6) image on a grey-scale image of velocity integrated HCN(1-0) (Wright et al. 2001). The HCN(1-0) shows the bright clumps that form the inner ring of the CND. Much of the NH3(6,6) emission comes from a region interior to the CND in projection.
Spectra taken at three positions interior to the CND are plotted in Figure 3b. The large line widths of 75–85 km s-1 in the central 1.5 pc indicate that this gas is physically close to the nucleus. Spectra are well-fitted by Gaussian profiles. Although the shape of the line profiles are similar to those from the CND for other molecules (e.g. Wright et al. 2001), the emission appears to be kinematically independent of material in the CND (Herrnstein & Ho 2002).
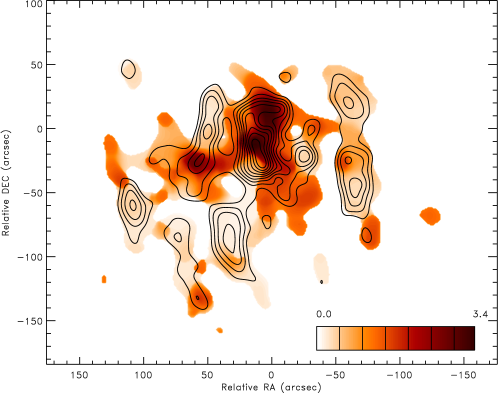
The detection of NH3(6,6) emission from a cloud is a strong indication that the cloud is very warm. In our data, clouds in which NH3(6,6) is detected tend to have high (2,2)-to-(1,1) rotational temperatures. Figure 4 shows the line ratio of NH3(6,6) to (3,3). The NH3(6,6) has been convolved to the resolution of the NH3(3,3) data. Because NH3(3,3) is so faint near the nucleus, we use as the NH3(3,3) flux density to calculate a lower limit of the line ratio for those pixels with faint (3,3) emission. Interior to the CND, line ratios of NH3(6,6) to (3,3) exceed the theoretical limit of 2.3 (Herrnstein & Ho 2002). These large line ratios may the the result of a larger filling factor for NH3(6,6), or the dynamic range of the NH3(3,3) data may be limited by nearby bright emission (McGary, Coil, & Ho 2001). It is unlikely that the gas is out of thermal equilibrium because the equilibration time is s. Line widths are quite large in the region (50 – 80 km s-1) making it unlikely for the NH3(6,6) population to be inverted. The large line widths also make absorption of NH3(3,3) by an un-associated, cool foreground cloud unlikely.
If the NH3(6,6) emission originates in a radiatively heated cloud, then it is possible that the NH3(3,3) is absorbed by cooler material in the same cloud (with the same line width) that has been shielded from the radiation. The NH3(6,6) would be unaffected by absorption because the cooler gas would contain almost no NH3(6,6). This shielded layer of cool gas must be located between the heated layer of the cloud and the observer. Therefore, if the clouds with line ratios greater than 2.3 are heated by photons emanating from the nucleus, then they must be located in front of the nucleus along the line-of-sight.
5. Summary
Using the VLA, we have observed NH3(1,1), (2,2), (3,3), and (6,6) to investigate the physical properties of molecular gas in the central 10 pc of the Galaxy. These data fully sample a field centered on Sgr A* with a velocity coverage of –140 to +130 km s-1. Much of the NH3 emission originates along the edge of Sgr A East, indicating that this expanding shell is greatly affecting the physical environment near Sgr A*. In addition, a hot component of molecular gas appears to be located less than 2 pc from Sgr A*. This gas has line widths of more than 70 km s-1 and high (6,6)-to-(3,3) line ratios, indicating that it is physically close to the nucleus.
References
- [1] Coil, A. L. & Ho, P. T. P. 1999, ApJ, 513, 752
- [2] Coil, A. L. & Ho, P. T. P. 2000, ApJ, 533, 245
- [3] Danby, G., Flower, D. R., Valiron, P., Schilke, P., & Walmsley, C. M. 1988, MNRAS, 235, 229
- [4] Dent, W. R. F., Matthews, H. E., Wade, R. , & Duncan, W. D. 1993, ApJ, 410, 650
- [5] Eckart, A. & Genzel, R. 1997, MNRAS, 284, 576
- [6] Ghez, A. M., Klein, B. L., Morris, M. , & Becklin, E. E. 1998, ApJ, 509, 678
- [7] Ghez, A. M., Morris, M., Becklin, E. E., Tanner, A., & Kremenek, T. 2000, Nature, 407, 349
- [8] Güsten, R., Genzel, R., Wright, M. C. H., Jaffe, D. T., Stutzki, J. , & Harris, A. I. 1987, ApJ, 318, 124
- [9] Güsten, R., Walmsley, C. M. , & Pauls, T. 1981, A&A, 103, 197
- [10] Harju, J., Walmsley, C. M., & Wouterloot, J. G. A. 1993, A&AS, 98, 51
- [11] Herrnstein, R. M. & Ho, P. T. P. 2002, ApJL, 579,83
- [12] Herrnstein, R. M. & Ho, P. T. P., in preparation
- [13] Ho, P. T. P. 1993, in Proc. of the 2nd Cologne-Zermatt Symposium, The Physics and Chemistry of Interstellar Molecular Clouds, ed. G. Winnewisser & G. Pelz (New York: Springer), 33
- [14] Ho, P. T. P., Ho, L. C., Szczepanski, J. C., Jackson, J. M., Armstrong, J. T. , & Barrett, A. H. 1991, Nature, 350, 309
- [15] Ho, P. T. P. & Townes, C. H. 1983, ARA&A, 21, 239
- [16] Hüttemeister, S., Wilson, T. L., Henkel, C., & Mauersberger, R. 1993, A&A, 276, 445
- [17] Lo, K. Y. & Claussen, M. J. 1983, Nature, 306, 647
- [18] Maeda, Y. et al. 2002, ApJ, 570, 671
- [19] Marshall, J., Lasenby, A. N. , & Harris, A. I. 1995, MNRAS, 277, 594
- [20] McGary, R. S., Coil, A. L., & Ho, P. T. P. 2001, ApJ, 559, 326
- [21] McGary, R. S. & Ho, P. T. P. 2002, ApJ, 577, 757
- [22] Mezger, P. G., Zylka, R. Salter, C. J., Wink, J. E., Chini, R. Kreysa, E. , & Tuffs, R. 1989, A&A, 209, 337
- [23] Okumura, S. K., et al. 1989, ApJ, 347, 240
- [24] Pedlar, A., Anantharamaiah, K. R., Ekers, R. D., Goss, W. M., van Gorkom, J. H., Schwarz, U. J., Zhao, J.-H. 1989, ApJ 342, 769
- [25] Reid, M. J. 1993, ARA&A, 31, 345
- [26] Roberts, D. A. & Goss, W. M. 1993, ApJS, 86, 133
- [27] Schödel, R. et al. 2002, Nature, 419, 694
- [28] Townes, C. H., Genzel, R., Watson, D. M., & Storey, J. W. V. 1983, ApJL, 269, 11
- [29] Walmsley, C. M. & Ungerechts, H. 1983, 122, 164
- [30] Wright, M. C. H., Coil, A. L., McGary, R. S., Ho, P. T. P., & Harris, A. I. 2001, ApJ, 551, 254
- [31] Yusef-Zadeh, T., Melia, F., Wardle, M. 2000, Science, 287, 85
- [32] Yusef-Zadeh, F. & Morris, M. 1987, ApJ, 320, 545
- [33] Zhao, J.-H., Goss, W. M., & Ho, P. T. P. 1995, 450, 122
- [34] Zylka, R. Mezger, P. G. , & Wink, P. E. 1990, A&A, 234, 133