The intrinsic emission of Seyfert galaxies observed with BeppoSAX/PDS
We present a study of the hard X-ray spectrum (15 keV) of different classes of Seyfert galaxies observed
with BeppoSAX/PDS.
Using hard X-ray data, we avoid absorption effects modifying the Seyfert emission and have direct access to
the central
engine of these sources.
The aim of this study is first to characterize the general properties of the hard X-ray
spectrum of Seyfert 1, 1.5 and 2 galaxies and secondly to compare their intrinsic emission
to test unified models according to which all the classes have the same nucleus.
We compute the average spectrum of 14 Sy 1, 9 Sy 1.5 and 22 Sy 2 galaxies observed by the PDS (15-136 keV).
The average spectrum of Sy 1 differs from that of Sy 2, the first requiring the
presence of a high energy cutoff which is absent in the second. We also show that
the reflection component is possibly more important in the Sy 2 emission.
The nature of Sy 1.5 galaxies is ambiguous as they have a
negligible reflection component (like Sy 1) and do not require a cutoff (like Sy 2).
Key Words.:
Galaxies: active – Galaxies: nuclei – Galaxies: Seyfert – Gamma rays: observations – Methods: data analysis – Methods: statistical1 Introduction
According to unified models (Antonucci & Miller, 1985), Seyfert 2 galaxies harbor a bright Seyfert 1 nucleus which is hidden from our view by an optically and geometrically thick obscuring torus. Consequently, the difference between type 1 and 2 Seyfert galaxies would be only due to viewing angle. Several observational facts in favor of unified models have been found:
-
•
detection of Polarized Broad Lines (PBL hereafter) in several Seyfert 2 galaxies (Antonucci & Miller, 1985; Miller & Goodrich, 1990; Tran, 1995; Young et al., 1996; Awaki et al., 2000; Moran et al., 2000; Alexander, 2001; Gu et al., 2001; Lumsden et al., 2001), interpreted as scattering of the Broad Lines Region emission by warm material placed above an absorption torus.
-
•
large absorbing column densities observed in the hard X-ray spectra of Seyfert 2 galaxies (Guainazzi et al. (2001) and references therein).
-
•
suspicion of anisotropic ionization radiation from the nucleus through the structures in the light of [OIII] line at 5007 Å (e.g. in NGC 5252 (Tadhunter & Tsvetanov, 1989)).
X-ray data have played a
major role in support of unified models.
The X-ray spectra of Seyfert galaxies are known relatively well and are composed at energies above 3 keV
of a power law, a Fe line and a Compton reflection component (Nandra & Pounds (1994), Gondek et al. (1996)
Nandra et al. (1997), Zdziarski et al. (1999), Zdziarski et al. (2000)). Some questions remain like the shape and the presence
of a cutoff at higher energies.
Furthermore, some observations are inconsistent with unified models at least in their simplest formulation. High energy
spectra of a sample of Seyfert 2 galaxies observed by OSSE suggest an intrinsic difference in the
hard X-ray emission of both classes of Seyfert galaxies. The two classes differ in the slope of the
intrinsic
power law, in the energy of the exponential cutoff, in the amount of absorption and reflection
(Zdziarski, 1995).
Hard X-ray spectra are a powerful tool to probe
and test unification models by providing a direct view on the central engine emission mostly free of absorption effects.
The form of the individual hard X-ray spectra is poorly constrained due to limited
photon statistics. This can be improved by considering the average spectrum of a sample to extract the
properties of a class.
We study the hard X-ray emission (above 15 keV) of Seyfert 1, 1.5 and 2 galaxies in order to investigate
several questions:
-
•
Are the high energy index slope of Seyfert 2 and Seyfert 1 identical?
-
•
Do the Seyfert 1 and 2 spectra have a cutoff? In thermal Compton models the high energy cutoff provides a reliable estimate of the comptonizing material temperature (Rybicki & Lightman, 1979). Therefore, differences in cutoffs or their absence indicate different comptonizing medium temperatures.
-
•
What is the importance of Compton reprocessed emission for each class? Could the reflection be the only cause to the observed difference between Seyfert 1 and Seyfert 2?
To answer these questions, we compute the average PDS spectrum of each class. We consider for inclusion in the Seyfert 2 sample only galaxies for which the absorption column density is less than 71023cm-2 to ensure that, above 15 keV, absorption is less than 50 of the flux. We are thus in the position to characterize the intrinsic emission of the various types of objects.
2 Selection procedure of our sample
We start by including all (i.e. 68) Seyfert PDS spectra available in the public archive of BeppoSAX Data Center111http://www.asdc.asi.it/bepposax/. We have investigated the possibility of source confusion in the PDS aperture by looking in the MECS images and excluded two confused objects from this study. We then form three subsamples characterizing Sy 1, Sy 1.5 and Sy 2 galaxies respectively.
2.1 The nature of objects composing the subsamples
We follow the optical classification of Seyfert galaxies indicated in the NASA/IPAC Extragalactic Database222http://nedwww.ipac.caltech.edu/(NED) and exclude LINERs for the ambiguity of their classification. We include Sy 1 and Sy 1.2 galaxies in the Seyfert 1 subsample, Sy 1.5 in the Seyfert 1.5 subsample and Sy 1.9 and Sy 2 in the Seyfert 2 subsample. We exclude Seyfert 1.8 for which the classification is too ambiguous between Seyfert 1.5 and Seyfert 2 galaxies.
2.2 Absorption effects in Seyfert 2 galaxies emission
Hard X-rays give a direct access to the intrinsic emission
provided that we avoid absorption effects which contaminate the Seyfert 2 galaxies spectra at
lower energies.
Objects with N1.51024cm-2 (so called Compton thick) have
a Thomson
optical depth larger than one. Electron scattering modifies their emission even in the hard X-ray energy domain. We
therefore eliminated
all such
objects from consideration.
In summary, we consider only objects for which e is larger than 0.5 at 15 keV, and
are respectively the Thomson and the photoelectric cross section. This means that we keep only objects
having a column density less than 71023cm-2.
The role of absorption in our Seyfert 2 class study is exhaustively explained in the appendix B.
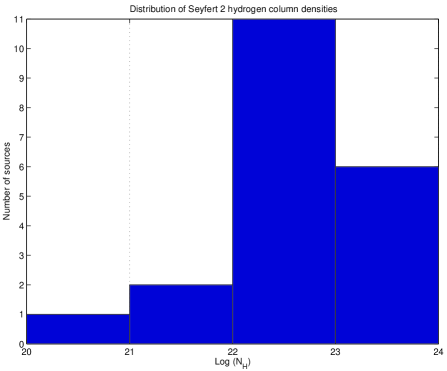
We present in Figure 1 the column density distribution for the Seyfert 2
galaxies sample. The majority of the objects have N between 1022cm-2 and
1023cm-2.
We present in Figure 2 the hydrogen column density distribution versus the redshift for Seyfert 2 galaxies.
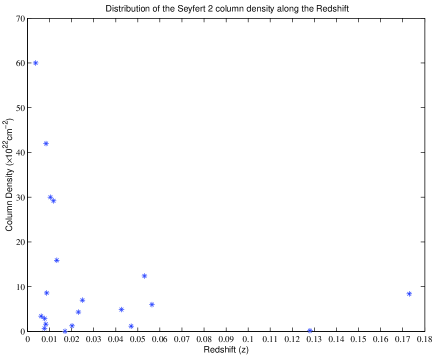
We note a large number of high column densities at low redshift. This is probably an observational artefact due to the fact that distant and highly absorbed Seyfert 2 galaxies are hardly detectable.
2.3 Data quality criterion
The third criterion we introduce is the quality of the data. We calculate the integrated signal to noise ratio of each object in the PDS energy range (15-136 keV). The data are used only when the integrated signal to noise ratio is equal to or larger than 2. This threshold is high enough to conclude to a detection by the PDS detector for a known source.
3 Properties of our samples
3.1 Redshift distributions
We present in Figure 3 the redshift distribution for the three classes of Seyfert galaxies.
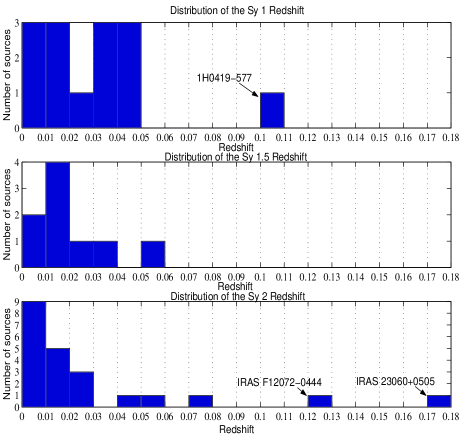
Most of the objects have a redshift less than 0.05 (93 for Sy 1, 89 for Sy 1.5 and 82 for Sy 2 galaxies). The difference between the redshift distributions of Sy 1 and Sy 2 galaxies may be due to biases in object selections when planning X-ray observation programmes. Indeed, absorbed objects being more difficult to observe will be looked for at small distances.
3.2 Comparison of the data quality
We determine the integrated signal to noise ratio in the PDS energy range (15-136 keV) for each object (Figure 4).
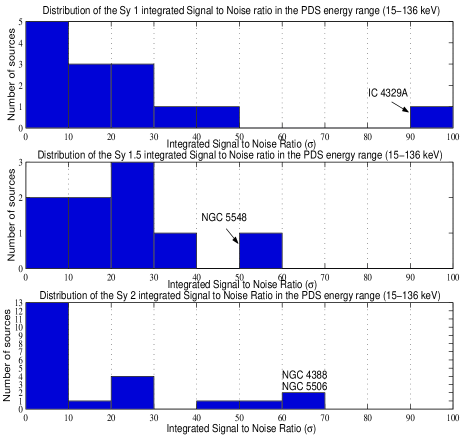
The majority of the objects have an integrated signal to noise ratio less than 30 (79 for Sy 1, 78 for Sy 1.5 and 82 for Sy 2 galaxies). The Seyfert 1, 1.5 and 2 samples are dominated by low signal to noise spectra.
3.3 Flux distributions
We measure the integrated flux in the PDS energy range of each object (Figure 5). The majority of the sources have a hard X-ray flux less than 1510-11erg s-1 cm-2 between 15 keV and 136 keV.
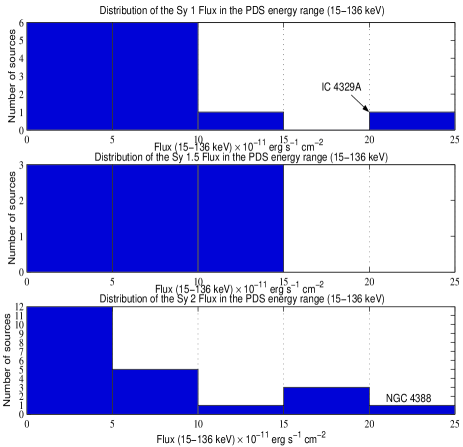
The proportion of objects with a flux less than or equal to 1510-11erg s-1 cm-2 is of 93 for Sy 1, 100 for Sy 1.5 and of 82 for Sy 2 galaxies.
3.4 Luminosity distributions
From the flux we calculate the integrated luminosity using H0=75 km s-1 Mpc-1 and q0=0.5 as cosmological parameters. The results are shown in Figure 6.
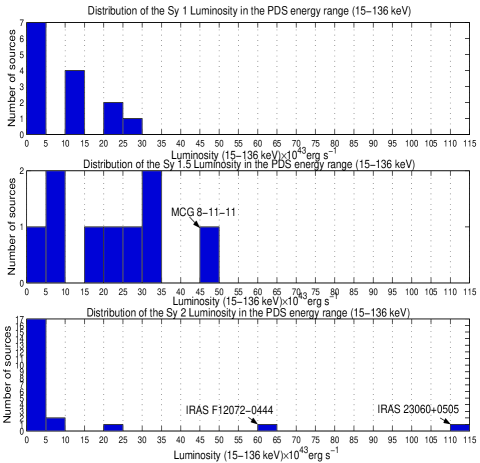
The majority of the objects have a hard X-ray luminosity less than or equal to 301043erg s-1 between 15 keV and 136 keV (93 for Sy 1, 100 for Sy 1.5 and 91 for Sy 2). In the Seyfert 2 subsample, two objects have a luminosity above 301043erg s-1: IRAS F12072-0444 with a luminosity of 61.51043erg s-1 and IRAS 23060+0505, with a luminosity of 1111043erg s-1. These two galaxies are warm Ultra Luminous Infrared Galaxies and are probably quasars regarding their hard X-ray luminosity. However, they are classified as Seyfert 2 galaxies in NED and therefore kept in our sample.
3.5 Excluded objects
Several objects have been excluded from our initial sample. We review below all the dismissed sources and the reason of their exclusion.
-
1.
NGC 4151: with an integrated signal to noise ratio of 227.5 and an integrated flux in the PDS energy range of 5810-11erg s-1 cm-2, this object would strongly dominate the sample. We will discuss this bright Seyfert 1.5 galaxy in the paper II of this study where individual objects are discussed (Deluit & Courvoisier, 2003).
-
2.
Mrk 1073: this object is not detected in the MECS and LECS instruments and has a very high signal in the PDS. We excluded it from our sample because its PDS spectrum is probably in part due to a nearby source.
-
3.
NGC 1386: a large fraction of the PDS flux is due to the nearby NGC 1365 (Maiolino et al., 1998).
-
4.
MCG 5-18-002: we excluded this source in reason of its uncertain absorption given as N 1025 cm-2 by Maiolino et al. (1998). The value is based only on the [OIII] flux and requires further confirmation.
-
5.
Considering the data quality criterion, we also exclude four Seyfert 1 (TON S180, GQCOMAE, IRAS 13224-3809 and Mrk 478) and four Seyfert 2 (NGC 3081, IRAS 11058-1131, IRAS 10126+7339 and NGC 4941). All these objects have an integrated signal to noise ratio less than 2.
3.6 The final sample
The initial sample of all Seyfert galaxies observed with BeppoSAX included 68 objects among 18
Sy 1, 10 Sy 1.5 and 40 Sy 2 galaxies.
Our sample is finally composed of 67 observations for a total of 45 Seyfert galaxies of which 14 are Seyfert 1 galaxies, 9 are Seyfert 1.5
and 22 are Seyfert 2 galaxies.
The list of objects composing our subsamples, their characteristics and their spectral properties
is given in Table A.1. for Sy 1 and Sy 1.5 galaxies samples and in Table A.2. for the Sy 2 galaxies
sample.
4 Data Analysis
The BeppoSAX instruments cover a wide spectral band and consist of four co-aligned
Narrow Field Instruments (NFI) plus two Wide Field Cameras perpendicular to the axes of the NFI and
looking in opposite directions.
The NFI is composed by a Low Energy Concentrator Spectrometer (LECS: Parmar et al. (1997)), three
Medium Energy Concentrator Spectrometer (MECS: Boella et al. (1997)) and a Phoswich Detector
Counter (PDS: Frontera et al. (1997)). LECS and MECS have imaging capabilities and operate
respectively in the 0.1-5 keV and 2.0-10 keV. The instrument used in this study, the PDS, is an instrument using rocking
collimators, the energy band is between 15-200 keV. The PDS consists in four phoswich units
operating in collimator mode with two of them pointing towards the source, the other two
away. The two pairs switch on and off source and the net source spectra are
obtained by subtracting the ’off’ (which represent the background) from the ”on” counts.
The PDS data available on the web are already background subtracted.
A more detailed description of the background and of the subtraction procedure is available
from http://www.sdc.asi.it/software.
The data analysis has been performed with the XSPEC (Arnaud, 1996) version 11 package and using the
last PDS response matrices
released by the SAX Data Center.
We kept in the input and output files the same binning for the average spectrum as was
available for the
original data of each source.
For a source observed several times, we first compute its
average spectrum.
We then compute the average subclass spectrum
taking into account of the exposure time of each data set.
The energy band is from 15 to 136 keV.
5 Spectral properties of the different classes of Seyfert galaxies
We present in Figure 7 the average counts spectrum of the three classes of Seyfert galaxies.
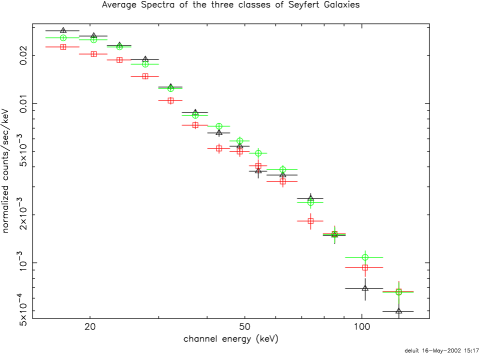
The spectrum of each class has an integrated signal to noise ratio
of 96
for Seyfert 1 galaxies, 74.4 for Seyfert
1.5 galaxies and 94 for Seyfert 2 galaxies.
No normalization has been applied to obtain the average spectra shown in this figure.
We compare the Seyfert classes following two ways. First through a model independent method comparing
directly the counts spectra. Secondly
through a model dependent method using a fitting procedure to investigate the physical processes at the origin
of the emission.
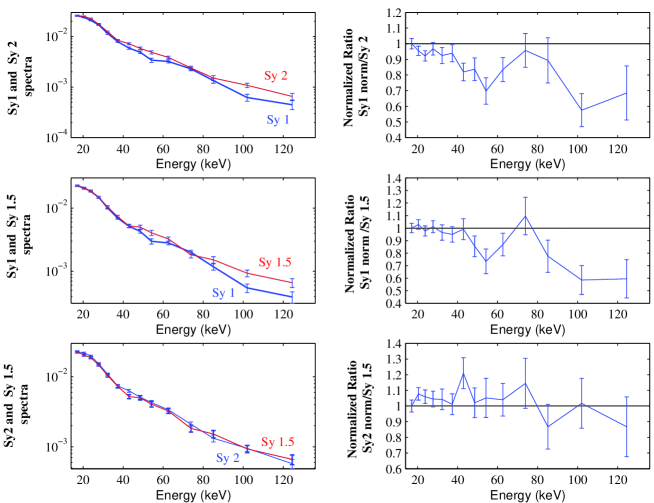
5.1 Model Independent Method: comparison of the normalized counts spectra
We compare the different average spectra normalizing them at 15 keV. This allows us to compare their emission independently of the average flux. The result is shown in Figure 8. On the left column, we present the normalized counts spectra of the three pairs of classes, on the right side we give the ratio of each pair.
5.1.1 Comparison between Seyfert 1 and Seyfert 2 emission
The two spectra are similar below 40 keV confirming that the Sy 2 galaxies emission is not significantly modified by absorption effects. Above 40 keV, the Sy 2 emission dominates that of Sy 1. The difference between the two classes increases above 90 keV. Indeed, the hard photons population is more important in Sy 2 than in Sy 1 galaxies showing that the observed Sy 2 spectrum is harder than Sy 1. The deficit of hard photons in the Sy 1 class can be explained either by the presence of a cutoff in its emission and/or by a reflection process occurring in the Sy 2 emission. The possibility that the Sy 2 intrinsic power law is harder than Sy 1 cannot be excluded. The Sy 1 average emission is 42% weaker than that of Sy 2 around 100 keV where they differ most in the normalized ratio.
5.1.2 Comparison between Seyfert 1 and Seyfert 1.5 emission
The spectra are identical below 40 keV. The Sy 1.5 emission slightly dominates between 40 and 65 keV. At higher energies, the Sy 1.5 spectrum contains a more important hard photons population. As in Sy 2 galaxies, the Sy 1.5 emission domination above 80 keV can be produced by a cutoff in Sy 1 or by a harder Sy 1.5 primary power law. The Sy 1 average emission is 41% weaker than that of Sy 1.5 at 100 keV where they differ most in the normalized ratio.
5.1.3 Comparison between Seyfert 1.5 and Seyfert 2 emission
The two spectra remain very close along the PDS energy band. Indeed, the maximal deviation between the two spectra in the normalized ratio does not exceed 20% at 40 keV where the Sy 2 average emission is marginally higher than that of Sy 1.5. Thus, we consider in a first approach that the spectrum of Sy 1.5 and Sy 2 present notable similarities.
5.1.4 Summary
The main result of this model independent study is that Sy 2 differ from Sy 1 galaxies and that Sy 1.5 and Sy 2 are similar. In particular in the high energy domain where the Sy 1.5 and Sy 2 classes present a more important hard photons population compared with Sy 1 galaxies. The processes that can be responsible for the observed differences between the three classes is investigated in the next subsection.
5.2 Model Dependent Method: investigating the physical processes into Seyfert galaxies engine
To interpret our data in terms of models taking the PDS spectral response matrices into account, we
fit
the spectra with different theoretical models.
We first fit the spectra with simple models (power law, broken power law and cutoff
power law). We then consider reflection with
the PEXRAV model described below.
All the results are summarized in Tables 1 and 2.
| Model | Seyfert | Ebreak/cutoff | /d.o.f. | FTEST | |||
|---|---|---|---|---|---|---|---|
| Class | Index Slope | (keV) | Index Slope | reduced | Probability value | ||
| Power Law | 1 | 2.03 | - | - | 50.0/12 | 4.17 | - |
| 1.5 | 1.90 | - | - | 16.7/12 | 1.39 | - | |
| 2 | 1.90 | - | - | 44.2/12 | 3.68 | - | |
| Broken Power Law | 1 | 1.65 | 28 | 2.25 | 14.7/10 | 1.47 | 2.2 |
| 1.5 | 1.62 | 26 | 2.01 | 10.3/10 | 1.03 | 5.010-2 | |
| 2 | 1.36 | 24 | 2.04 | 13.9/10 | 1.39 | 3.110-3 | |
| Cutoff Power Law | 1 | 1.49 | 70 | - | 15.2/11 | 1.38 | 4.510-4 |
| 1.5 | 1.64 | 152 | - | 13.3/11 | 1.21 | 5.8 | |
| 2 | 1.45 | 87 | - | 17.6/11 | 1.60 | 1.8 |
Note:
The uncertainties correspond to 90
confidence level based on a =2.7 criterion (Lampton et al., 1976)
| PEXRAV PARAMETERS | ||||||
| Seyfert | Efolded | R | /d.o.f. | cos | ||
| Class | Index Slope | (keV) | Reflection | reduced | fixed | |
| 1 | 1.92 | 238 | 0.93 | 13.2/10 | 1.32 | 0.45 |
| 1.5 | 1.96 | 9.810 | 0.73 | 10.8/10 | 1.08 | 0.45 |
| 2 | 1.99 | 2.410 | 1.47 | 13.1/10 | 1.31 | 0.45 |
| 1 | 1.89 | 221 | 0.48 | 13.1/10 | 1.31 | 0.87 |
| 1.5 | 1.95 | 8.210 | 0.39 | 10.7/10 | 1.07 | 0.87 |
| 2 | 2.00 | 3.610 | 2.33 | 13.0/10 | 1.30 | 0.30 |
| Seyfert | Efolded | R | /d.o.f. | cos | ||
| Class | Index Slope | (keV) | Reflection | reduced | free | |
| 1 | 1.91 | 231 | 0.53 | 13.2/9 | 1.47 | 0.81 |
| 1.5 | 1.95 | 1.010 | 0.36 | 10.7/9 | 1.19 | 0.95 |
| 2 | 2.00 | 2.810 | 2.55 | 13.0/9 | 1.44 | 0.28 |
Notes:
The uncertainties correspond to 90
confidence level based on a =2.7 criterion (Lampton et al., 1976).
NC indicates that no constraint has been found on this limit.
[a] the value indicates that the high energy cutoff is far above values that can be measured
by the
PDS showing the absence of a measured cutoff.
5.2.1 Fitting of the spectra with simple theoretical models
The power law model gives
the worst statistical results for all the classes. For Sy 1 and 2 galaxies, this model is
statistically unacceptable with a reduced 2 greater than 2 indicating that their spectra require
an additional component. For the Sy 1.5 galaxies, this model
is more
adapted.
Sy 1 emission requires a
cutoff considering
both the statistical result of the test and the FTEST probability,
confirming our model independent analysis. The presence of a cutoff
is unprobable in Sy 1.5 and Sy 2 galaxies. Indeed, the 2 method gives the best result for
a broken power law (=1.03 for Sy 1.5 and =1.30 for Sy 2) compared with the cutoff
model (=1.21 and = 1.60 respectively).
In subsection 5.1, we noted two maxima in the ratio between Sy 1 and Sy 2 spectra around 40 keV and 100 keV. These
features may be due to a combination of a cutoff in Sy 1 (here found at 70 keV) and/or a reflection hump in Sy 2 class that we
investigate in the next section.
5.2.2 Fitting of the spectra with the reflection model PEXRAV
Previously, we suspected the presence of a reflection component in the Sy 1.5 and Sy 2 spectrum. We investigate this hypothesis using the PEXRAV model (Magdziarz & Zdziarski, 1995) in XSPEC. This model calculates the expected X-ray spectrum when a point source of X-rays is incident on optically thick, mainly neutral material. The parameter R measures the reflection component. If the primary source is isotropic and neither the source nor the reflector are obscured, then R can be linked to the solid angle seen through the reflector as R. This model and in particular the reflection component are inclination dependent. We apply this model in two ways: first, we fix the inclination from the normal of the disk at a medium angle to test the occurrence of the reflection as well as the presence of other components independently to any strong inclination influence. We then change the angle value fixing or letting it free in order to understand its role and to obtain the inclination value for which we have the best fit. The results are shown in Table 2.
-
1.
Intermediate inclination analysis
The inclination is initially fixed at an intermediate value of cos =0.45.
The test indicates that PEXRAV significantly improves the data fitting of Sy 1 and Sy 2 galaxies compared with simple models, not however for the Sy 1.5 spectrum that remains best represented by a broken power law. Therefore, reflection may play a role for the two main Seyfert classes and be absent in Sy 1.5 emission. This is confirmed by the reflection amount which can be non existent for Sy 1.5 (R=0.73-0.71) whereas its presence is strongly suggested in Sy 2 emission (R=1.47-0.77) at the 2 level. The primary power law indices of the three classes are within 1, however Sy 2 emission could be softer compared with the Sy 1 index slope (=1.99 for Sy 2 against =1.92 for Sy 1).
A strong difference appears in the high energy cutoff which is relatively well identified for Sy 1 (Ec=238-176 keV) and totally absent for Sy 1.5 and Sy 2 classes. The main result is that the spectrum of Sy 2 galaxies differs from that of Sy 1 with the absence of a cutoff and a possible presence of an important reflection component in the Sy 2 emission. -
2.
Inclination influence
We change the inclination value to test unified models which suggest that Sy 2 galaxies are seen edge-on.-
(a)
Fixed inclination at different angles
We fix the inclination at cos =0.30 and cos =0.87. The influence of the inclination parameter is not crucial on the final result of the test. The best fit for Sy 1 and Sy 1.5 is obtained for cos =0.87, an angle of 30∘ from the normal of the disk. The reflection component value is lower for cos =0.87 than for an inclination of cos =0.45 as predicted by the fact that the reflection is inclination dependent in the PEXRAV model. We also confirm that we obtain for the Sy 2 galaxies the best value for cos =0.30 namely an angle of 73∘. The increase of the reflection component is numerically important (2.33 against 1.47 previously) but statistically unconvincing. The reflection is less predominant in the two other Seyfert classes. -
(b)
Free inclination
We then let the inclination free to avoid as much as possible the dependence between the different parameters. We find that Sy 1.5 galaxies would be seen closer to the normal to the disk with an inclination of 18∘ whereas the Sy 1 class would be viewed from an angle of 36∘ and the Sy 2 from 74∘.
It should be noted that in the PEXRAV implementation of the reflection model, a stronger reflection hump systematically induces a large inclination.
-
(a)
5.3 Investigating a link between the index slope and the reflection parameter R
We investigate whether the index slope and the reflection R are independently measured through the ”draw” of this possible correlation using XSPEC (Figures 9 and 10).
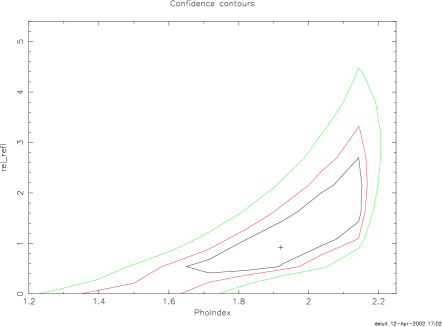
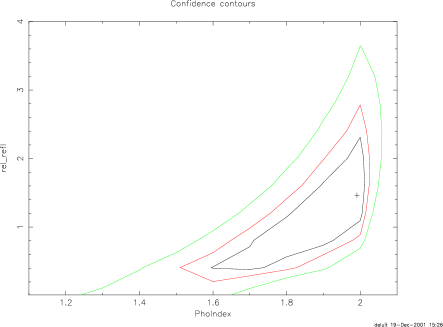
This study is performed using an intermediate angle of cos =0.45
for all classes.
For both Sy 1 and Sy 2 classes, if the average spectrum has a high index slope (e.g. = 2) then it
has a larger amount of reflection than if it has a hard spectrum (e.g. =1.6).
We also note that if any class would have an index slope of less than 1.2, then reflection is not required
to account for the data.
The index slope is the signature of the
primary X-ray source. Therefore, a link between the index slope and the reflection amount
would indicate
that the source of the cooling photons is related to the emission from the material at the origin of the
Compton reflection.
We will study using individual object spectra whether there is a correlation between and R in the Paper
II (Deluit & Courvoisier, 2003).
5.4 Results
With a model independent method we find that Sy 2 galaxies are similar to Sy 1.5 and differ
from Sy 1 galaxies.
With a model dependent method, the best of all theoretical models adopted for the
two main classes is the PEXRAV model whereas the Sy 1.5 spectrum is well represented by a broken power
law.
Considering the cutoff power law model, E-Γexp(-E/Ec), we find that Sy 1.5 and
Sy 2 have similar behavior in the sense that their spectra do not require any cutoff
whereas the Sy 1 spectrum presents a well constrained cutoff at 70
keV. In model including reflection, the cutoff energy in Sy 1 emission is found at 221-158 keV and still not
required in Sy 1.5 and Sy 2 emission.
The main result is thus the presence of a high energy cutoff in Sy 1 that it is absent in
other categories. The role and place of Sy 1.5 are not clearly identified. Indeed, Sy 1.5 are close to Sy 1
concerning the relatively low reflection
influence, and similar to Sy 2
regarding the absence of a cutoff.
5.5 Discussion and Perspectives
Our results concerning the index slope of Sy 1 emission confirm the results obtained by Zdziarski et al. (1995) and Gondek et al. (1996) who found 0.9. Our results differ, however, in what regards Sy 2 galaxies. Zdziarski et al. (1995) and Zdziarski et al. (2000) found that Sy 2 are harder than Sy 1 which we do not find. Secondly, Zdziarski et al. (1995) found a negligible reflection in Sy 2 emission whereas in our study, we emphasize the possible importance of this component in the Sy 2 average spectrum.
5.5.1 High energy cutoff
The presence or absence of a high energy cutoff is not influenced by the inclination of the system with
respect to the line of sight. The measured cutoff in the Sy 1 galaxies emission while none is found in Sy 2 galaxies
clearly indicates intrinsic differences in their primary emission.
However this lack could also be explained by a wide
distribution of cutoff energies whereas the presence of a cutoff in the Sy 1 average spectrum indicates a narrow
range of comptonizing temperatures in the class.
A cutoff in the Sy 1 emission provides, according to thermal Compton models, a reliable
estimate of the electron temperature in the Comptonizing medium. The Sy 1 cutoff found at
kBT=220 keV corresponds
to a temperature of
T2.6109
K for the electron gas in the case of unsaturated comptonization.
If the absence of a cutoff in Sy 1.5 and Sy 2 galaxies is confirmed, it indicates either the
importance of non thermal Compton
scattering or a higher temperature of the Comptonizing medium.
5.5.2 The role of reflection
We show that Sy 2 galaxies may have a stronger reflection component than the other classes. Our
fits also indicate that the inclination of Sy 2 could be larger than that of the other galaxies. Both
results are not independent, only models free of this degeneracy will allow us to deconvolve
the geometry of the reflection medium from inclination effects.
We also find that the average spectrum of Sy 2 galaxies, more affected by absorption than Sy 1, shows more reflection
than that of Seyfert 1 galaxies suggesting a link between the two processes.
5.5.3 Implications of our results
To investigate further these assertions, it is necessary to test our results
in a different way, through the study of the distribution of the individual spectral
parameters on a large sample of Seyfert galaxies. Therefore, we will study the distribution of the
parameters , Ec and R for each object of a given class as far as can be measured to date and to compare
them in order to test the results found in this paper. This study, presented in Paper II, will
allow us to know
whether the absence of a high energy cutoff
in Sy 1.5 and Sy 2 is due to a wide distribution of values within the class and to study the correlation between
the reflection
and the power law slope.
Seyfert 2 galaxies have different intrinsic emission and therefore different physical conditions in the inner regions.
Sy 2 galaxies in which no cutoff has been found have probably a higher temperature
comptonizing medium
than Sy 1 galaxies. This reveals that the ratio heating/cooling of this medium is different in both classes.
Our study has to be pursued within the Sy 2 galaxies where two subclasses known as Sy 2 with Polarized Broad Lines
(PBL)
and without PBL are found. Unified schemes predict that both types have a hidden Sy 1 nucleus. We have to search for common
behavior in the intrinsic emission of both Sy 2 subclasses and to compare them with Sy 1 emission features
(see Deluit (2003)).
The nature of
the fueling mechanism occurring in the nucleus is unsolved and could also contribute to the
Seyfert 2 particularity. Indeed, Sy 2 galaxies have been found to host starbursts more often than type 1 AGNs
(Levenson et al., 2001). We could expect that in Sy 2 objects the accreted matter
originates predominantly in starbursts.
6 Conclusion
We obtained and studied the average hard X-ray spectra of Seyfert 1, 1.5 and 2 galaxies
observed by the PDS on board BeppoSAX.
We emphasized several differences in the central engine behavior of the two main Seyfert classes
indicating that the Seyfert 1 and 2 galaxies have at least various physical conditions in their inner regions or are
different objects. The differences cannot be due only to inclination/absorption effects as claimed by unified models.
The next steps in the Seyfert studies will be the search for the presence of a high energy cutoff
in individual Seyfert galaxies to investigate the importance of the different physical processes in their emission
(thermal and/or non thermal) and the investigation of the nature of the reflection medium
(disk or material surrounding the nucleus), of its composition (density, homogeneity) and its localization.
It is also important in a different set of considerations to investigate whether Seyfert 1 and Seyfert 2 have intrinsic differences in their
star formation rate, morphology and/or environment.
References
- Alexander (2001) Alexander, D. M. 2001, MNRAS, 320, L15
- Antonucci & Miller (1985) Antonucci, R. R. J. & Miller, J. S. 1985, ApJ, 297, 621
- Arnaud (1996) Arnaud, K. A. 1996, in ASP Conf. Ser. 101: Astronomical Data Analysis Software and Systems V, Vol. 5, 17+
- Awaki et al. (2000) Awaki, H., Ueno, S., Taniguchi, Y., & Weaver, K. A. 2000, ApJ, 542, 175
- Bassani et al. (1999) Bassani, L., Dadina, M., Maiolino, R., Salvati, M., Risaliti, G., della Ceca, R., Matt, G., & Zamorani, G. 1999, ApJS, 121, 473
- Boella et al. (1997) Boella, G., Chiappetti, L., Conti, G., Cusumano, G., del Sordo, S., La Rosa, G., Maccarone, M. C., Mineo, T., Molendi, S., Re, S., Sacco, B., & Tripiciano, M. 1997, A&AS, 122, 327
- Brandt et al. (1997) Brandt, W. N., Fabian, A. C., Takahashi, K., Fujimoto, R., Yamashita, A., Inoue, H., & Ogasaka, Y. 1997, MNRAS, 290, 617
- Cappi et al. (1996) Cappi, M., Mihara, T., Matsuoka, M., Brinkmann, W., Prieto, M. A., & Palumbo, G. G. C. 1996, ApJ, 456, 141+
- Comastri et al. (1998) Comastri, A., Vignali, C., Cappi, M., Matt, G., Audano, R., Awaki, H., & Ueno, S. 1998, MNRAS, 295, 443+
- Della Ceca et al. (2001) Della Ceca, R., Pellegrini, S., Bassani, L., Beckmann, V., Cappi, M., Palumbo, G. G. C., Trinchieri, G., & Wolter, A. 2001, A&A, 375, 781
- Deluit (2003) Deluit, S. 2003, in preparation
- Deluit & Courvoisier (2003) Deluit, S. & Courvoisier, T. J.-L. 2003, in preparation
- Frontera et al. (1997) Frontera, F., Costa, E., dal Fiume, D., Feroci, M., Nicastro, L., Orlandini, M., Palazzi, E., & Zavattini, G. 1997, A&AS, 122, 357
- Gondek et al. (1996) Gondek, D., Zdziarski, A. A., Johnson, W. N., George, I. M., McNaron-Brown, K., Magdziarz, P., Smith, D., & Gruber, D. E. 1996, MNRAS, 282, 646
- Gu et al. (2001) Gu, Q., Maiolino, R., & Dultzin-Hacyan, D. 2001, A&A, 366, 765
- Guainazzi et al. (2001) Guainazzi, M., Fiore, F., Matt, G., & Perola, G. C. 2001, MNRAS, 327, 323
- Guainazzi et al. (1998) Guainazzi, M., Matt, G., Antonelli, L. A., Fiore, F., Piro, L., & Ueno, S. 1998, MNRAS, 298, 824
- Hayashi et al. (1996) Hayashi, I., Koyama, K., Awaki, H., & Yamauchi, S. U. S. 1996, PASJ, 48, 219
- Lampton et al. (1976) Lampton, M., Margon, B., & Bowyer, S. 1976, ApJ, 208, 177
- Leighly et al. (2000) Leighly, K. M., Cappi, M., Kay, L., Halpern, J. P., Awaki, H., Ueno, S., & Magalhaes, A. M. 2000, in Rossi2000: Astrophysics with the Rossi X-ray Timing Explorer. March 22-24, 2000 at NASA’s Goddard Space Flight Center, Greenbelt, MD USA, p.E125, E125–+
- Levenson et al. (2001) Levenson, N. A., Weaver, K. A., & Heckman, T. M. 2001, ApJ, 550, 230
- Lumsden et al. (2001) Lumsden, S. L., Heisler, C. A., Bailey, J. A., Hough, J. H., & Young, S. 2001, MNRAS, 327, 459
- Magdziarz & Zdziarski (1995) Magdziarz, P. & Zdziarski, A. A. 1995, MNRAS, 273, 837
- Maiolino et al. (1998) Maiolino, R., Salvati, M., Bassani, L., Dadina, M., della Ceca, R., Matt, G., Risaliti, G., & Zamorani, G. 1998, A&A, 338, 781
- Miller & Goodrich (1990) Miller, J. S. & Goodrich, R. W. 1990, ApJ, 355, 456
- Moran et al. (2000) Moran, E. C., Barth, A. J., Kay, L. E., & Filippenko, A. V. 2000, ApJ, 540, L73
- Morrison & McCammon (1983) Morrison, R. & McCammon, D. 1983, ApJ, 270, 119
- Nandra et al. (1997) Nandra, K., George, I. M., Mushotzky, R. F., Turner, T. J., & Yaqoob, T. 1997, ApJ, 477, 602+
- Nandra & Pounds (1994) Nandra, K. & Pounds, K. A. 1994, MNRAS, 268, 405
- Parmar et al. (1997) Parmar, A. N., Martin, D. D. E., Bavdaz, M., Favata, F., Kuulkers, E., Vacanti, G., Lammers, U., Peacock, A., & Taylor, B. G. 1997, A&AS, 122, 309
- Risaliti et al. (1999) Risaliti, G., Maiolino, R., & Salvati, M. 1999, ApJ, 522, 157
- Rybicki & Lightman (1979) Rybicki, G. B. & Lightman, A. P. 1979, Radiative processes in astrophysics (New York, Wiley-Interscience, 1979. 393 p.)
- Smith & Done (1996) Smith, D. A. & Done, C. 1996, MNRAS, 280, 355
- Tadhunter & Tsvetanov (1989) Tadhunter, C. & Tsvetanov, Z. 1989, Nature, 341, 422
- Tran (1995) Tran, H. 1995, ApJ, 440, 565+
- Turner et al. (1997) Turner, T. J., George, I. M., Nandra, K., & Mushotzky, R. F. 1997, ApJ, 488, 164+
- Ueno et al. (1998) Ueno, S., Ward, M. J., O’Brien, P. T., Stirpe, G. M., & Matt, G. 1998, in The Active X-ray Sky: Results from BeppoSAX and RXTE, 554+
- Weaver et al. (1996) Weaver, K. A., Nousek, J., Yaqoob, T., Mushotzky, R. F., Makino, F., & Otani, C. 1996, ApJ, 458, 160+
- Weaver et al. (1997) Weaver, K. A., Yaqoob, T., Mushotzky, R. F., Nousek, J., Hayashi, I., & Koyama, K. 1997, ApJ, 474, 675+
- Xue et al. (1998) Xue, S., Otani, C., Mihara, T., Cappi, M., & Matsuoka, M. 1998, PASJ, 50, 519
- Young et al. (1996) Young, S., Hough, J. H., Efstathiou, A., Wills, B. J., Bailey, J. A., Ward, M. J., & Axon, D. J. 1996, MNRAS, 281, 1206
- Zdziarski et al. (1995) Zdziarski, A. A., Johnson, W. N., Done, C., Smith, D., & McNaron-Brown, K. 1995, ApJ, 438, L63
- Zdziarski et al. (1999) Zdziarski, A. A., Lubinski, P., & Smith, D. A. 1999, MNRAS, 303, L11
- Zdziarski et al. (2000) Zdziarski, A. A., Poutanen, J., & Johnson, W. N. 2000, ApJ, 542, 703
Appendix A The final sample of the objects studied
We present below the characteristics of the objects composing the final sample of our study. The Table A.1. includes the Seyfert 1 and Seyfert 1.5 galaxies subsamples and the Table A.2. represents the Seyfert 2 subsample.
| Source Name | RA | DEC | Redshift | S/N1 | F6 | L7 |
| (h m s) | (∘ ′ ′′) | z | ||||
| Seyfert 1 galaxies sample | ||||||
| Mrk 335 | 00 06 19.3 | +20 12 10.0 | 0.025 | 3.01 | 1.38 | 1.67 |
| Fairall 9 | 01 23 45.6 | 58 48 14.0 | 0.047 | 11.8 | 5.42 | 23.5 |
| NGC 985 | 02 34 37.6 | 08 47 08.0 | 0.043 | 9.69 | 3.63 | 13.1 |
| 1H0419-577 | 04 26 01.0 | 57 12 00.0 | 0.104 | 2.00 | 1.18 | 25.7 |
| Mrk 1102 | 09 25 12.9 | +52 17 11.0 | 0.035 | 12.8 | 4.35 | 10.4 |
| REJ1034+393 | 10 34 38.8 | +39 38 34.0 | 0.042 | 2.14 | 0.71 | 2.44 |
| NGC 3783 | 11 39 01.7 | 37 44 20.0 | 0.011 | 48.5 | 14.2 | 3.31 |
| NGC 40512 | 12 03 09.5 | +44 31 50.9 | 0.002 | 7.25 | 2.06 | 0.02 |
| NGC 4593 | 12 39 39.4 | 05 20 38.0 | 0.008 | 23.0 | 9.63 | 1.19 |
| MCG 6-30-15 | 13 35 53.2 | 34 17 48.0 | 0.008 | 33.0 | 7.19 | 0.84 |
| IC 4329A5 | 13 49 19.2 | 30 18 35.9 | 0.016 | 99.0 | 22.6 | 11.2 |
| ESO 141-G55 | 19 21 14.3 | 58 40 13.0 | 0.036 | 15.3 | 5.37 | 13.6 |
| Mrk 5092 | 20 44 09.7 | 10 43 23.9 | 0.034 | 27.4 | 9.73 | 21.9 |
| NGC 7469 | 23 03 15.5 | +08 52 26.0 | 0.016 | 28.0 | 5.11 | 2.52 |
| Seyfert 1.5 galaxies sample | ||||||
| Mrk 1152 | 01 13 50.2 | 14 50 59.9 | 0.053 | 3.32 | 0.59 | 3.22 |
| NGC 526A | 01 23 54.1 | 35 03 56.0 | 0.019 | 13.7 | 5.89 | 4.15 |
| MCG 8-11-11 | 05 54 53.5 | +46 26 21.0 | 0.021 | 29.3 | 11.4 | 9.25 |
| Mrk 6 | 06 52 12.1 | +74 25 36.9 | 0.019 | 21.0 | 7.67 | 5.24 |
| NGC 35162 | 11 06 47.2 | +72 34 08.0 | 0.009 | 29.8 | 11.5 | 1.71 |
| Mrk 766/NGC42532 | 12 18 26.2 | +29 48 46.0 | 0.013 | 14.0 | 3.63 | 1.16 |
| NGC 55485 | 14 17 595 | +25 08 12.0 | 0.017 | 52.6 | 10.6 | 6.06 |
| Mrk 841 | 15 04 01.2 | +10 26 16.0 | 0.036 | 7.71 | 2.71 | 6.92 |
| NGC 72133 | 22 09 16.2 | 47 10 00.0 | 0.006 | 31.4 | 7.03 | 0.49 |
Note:
1 Integrated Signal to Noise ratio in the PDS energy range
2 2 available observations
3 3 available observations
4 4 available observations
5 5 available observations
6 Integrated Flux in 10-11erg s-1 cm-2
7 Integrated Luminosity in 1043erg s-1
| Source name | RA | DEC | Redshift | N1 | S/N4 | F5 | L6 |
|---|---|---|---|---|---|---|---|
| (h m s) | (∘ ′ ′′) | z | |||||
| IRAS 00198-7926 | 00 21 53.8 | 79 10 08.0 | 0.073 | - | 2.10 | 2.18 | 22.9 |
| NGC 1358 | 03 33 39.5 | 05 05 20.0 | 0.013 | - | 2.28 | 1.38 | 0.48 |
| IRAS 05189-2524 | 05 21 01.3 | 25 21 42.9 | 0.043 | 4.90[B] | 2.66 | 1.14 | 4.04 |
| NGC 2110 | 05 52 11.2 | 07 27 20.8 | 0.008 | 2.89[H] | 20.5 | 8.62 | 1.01 |
| NGC 29922 | 09 45 42.0 | 14 19 36.9 | 0.008 | 0.69[W96] | 25.8 | 7.98 | 0.91 |
| MCG 5-23-16 | 09 47 40.1 | 30 56 53.9 | 0.008 | 1.62[W97] | 45.8 | 19.8 | 2.62 |
| IRAS F12072-0444 | 12 09 45.1 | 05 01 14.9 | 0.128 | 0.17[D] | 4.88 | 1.84 | 61.5 |
| NGC 43882 | 12 25 46.7 | +12 39 44.0 | 0.008 | 42.0[B] | 63.8 | 22.1 | 3.00 |
| NGC 45073 | 12 35 37.0 | 39 54 32.0 | 0.012 | 29.2[C] | 58.1 | 19.1 | 5.12 |
| NGC 4939 | 13 04 14.5 | 10 20 26.9 | 0.010 | 30.0[M] | 3.56 | 2.26 | 0.47 |
| NGC 5252 | 13 38 16.3 | +04 32 20.0 | 0.023 | 4.33[Ca] | 2.86 | 2.26 | 2.34 |
| NGC 55063 | 14 13 14.8 | 03 12 28.0 | 0.006 | 3.40[S] | 69.0 | 17.0 | 1.25 |
| NGC 5674 | 14 33 52.0 | +05 27 28.0 | 0.025 | 7.00[B] | 5.05 | 1.69 | 2.07 |
| NGC 6300 | 17 17 00.3 | 62 49 15.0 | 0.004 | 60.0[Le] | 23.1 | 8.35 | 0.22 |
| IRAS 18325-5926/F 49 | 18 36 58.3 | 59 24 09.0 | 0.020 | 1.26[B] | 6.06 | 1.25 | 0.99 |
| ESO 103-G35 | 18 38 20.3 | 65 25 40.0 | 0.013 | 15.9[T] | 7.84 | 7.96 | 2.71 |
| IRAS 20210+1121 | 20 23 25.6 | +11 31 32.9 | 0.056 | 6.0[U] | 2.24 | 0.87 | 5.45 |
| NGC 71722 | 22 02 02.2 | 31 52 12.0 | 0.009 | 8.61[G] | 9.73 | 4.43 | 0.65 |
| NGC 7314 | 22 35 46.0 | 26 03 01.0 | 0.005 | 1.16[T] | 18.5 | 7.07 | 0.30 |
| IRAS 23060+0505 | 23 08 33.8 | +05 21 29.0 | 0.173 | 8.40[Br] | 4.20 | 1.79 | 112 |
| NGC 7582 | 23 18 23.5 | 42 22 11.9 | 0.005 | 12.4[X] | 24.2 | 10.5 | 0.57 |
| NGC 7679 | 23 28 46.8 | +03 30 38.9 | 0.017 | 0.04[DC] | 4.98 | 1.36 | 0.76 |
Note:
References concerning the Hydrogen column density:
B: Bassani et al. (1999),
Br: Brandt et al. (1997),
Ca: Cappi et al. (1996),
Co: Comastri et al. (1998)
D: Deluit, this work, see Paper II of this study,
DC: Della Ceca et al. (2001),
G: Guainazzi et al. (1998),
H: Hayashi et al. (1996),
Le: Leighly et al. (2000),
M: Maiolino et al. (1998),
S: Smith & Done (1996) ,
T: Turner et al. (1997),
U: Ueno et al. (1998),
W96: Weaver et al. (1996),
W97: Weaver et al. (1997),
X: Xue et al. (1998)
1 Hydrogen column density in 1022 cm-2 units
2 2 available observations
3 3 available observations
4 Integrated Signal to Noise Ratio
5 Integrated Flux in 10-11erg s-1 cm-2
6 Integrated Luminosity in 1043erg s-1
Appendix B The role of absorption in Seyfert 2 class studies
According to actual models, the X-ray emission of many Seyfert 2 galaxies is characterized by a power law
similar to that observed in Seyfert 1, with a cutoff at low energies ( 10 keV) due to absorption
effects produced by gas column densities higher than 1022cm-2. Seyfert 2 galaxies show a broad
range of absorption, with column densities varying from 1022
cm-2 to
1025 cm-2 (Risaliti et al., 1999). These results
yield to a further
classification
among Seyfert 2 galaxies: Compton thin and Compton thick sources depending on whether their column
density is respectively lower
or larger
than the inverse Thomson cross-section
N= =1.51024
cm-2.
Therefore, for objects presenting a column density
less than 1.51024cm-2
(Compton thin), high energy X-rays penetrate the absorbing material, making the
nuclear source visible to the observer and allowing him to measure the Hydrogen column density. For objects with a column density higher than
1.51024cm-2 (Compton thick), the matter is optically thick to the Compton scattering
and the nucleus is hardly visible.
In the last few years, BeppoSAX data revealed a new highly absorbed class with only a lower limit on the column
density N 1025cm-2 (Risaliti et al., 1999), no detection of the intrinsic emission can
be expected at energies between 15 and 150 keV.
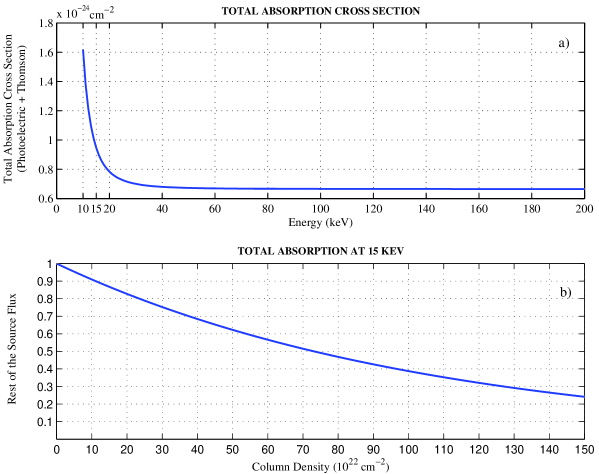
The photoelectric absorption cross section as a function
of
energy is well described by
Morrison & McCammon (1983) up to 10 keV.
The component due to Compton scattering is described by the Thomson cross
section equal to 6.6510-25cm-2.
Compton scattering plays an important role with the photoelectric cross section above 4 keV, and
dominates above 10 keV. Starting with the analytic formulae Morrison & McCammon (1983)
| (1) |
where C0=701.2, C1= 25.2 and C2=0.
The photoelectric cross section at 10 keV is
| (2) |
At 10 keV the E-3 dependence is dominant, we thus extrapolate B.1. to higher energies using
| (3) |
We present in the upper panel of the Figure B.1. the value of the total absorption cross section as a function of energy. The total absorption of the emission from the central engine is characterized as
| (4) |
We compute this at 15 keV, the lower energy used in our study, and show the result in the lower panel of the
Fig. B.1. An object is considered as strongly absorbed when its flux has decreased by 50% due to absorption effects.
We see in the lower panel of Fig. B.1.
that this value corresponds to a column density around 701022 cm-2.
Therefore, we consider that below a column density of 701022cm-2 the absorption is
not an important effect at the energies covered in this study. Thus, we excluded objects with higher
hydrogen column density.
Appendix C Average Counts Spectra fitted by the different models
We present below the counts spectrum of each class fitted by the different models applied in this study.


