Preparation of enriched cosmic ray mass groups with KASCADE
Abstract
The KASCADE experiment measures a high number of EAS observables with a large degree of sampling of the electron-photon, muon, and hadron components. It provides accurate data for an event-by-event analysis of the primary cosmic ray flux in the energy range around the knee. The possibility of selecting samples of enriched proton and iron induced extensive air showers by applying the statistical techniques of multivariate analyses is scrutinized using detailed Monte Carlo simulations of three different primaries. The purity and efficiency of the proton and iron classified events is investigated. After obtaining enriched samples from the measured data by application of the procedures the reconstructed number of hadrons, hadronic energy and other parameters are investigated in the primary energy range eV. By comparing these shower parameters for purified proton and iron events, respectively, with simulated distributions an attempt is made to check the validity of strong interaction models at high energies.
keywords:
cosmic rays; air shower; hadronic interactions; Monte Carlo simulations, nonparametric methods of statistical data analysisPACS:
96.40.Pq 96.40.De, , ,††thanks: on leave of absence from the NIPNE, Bucharest, Romania, , , , , , , , , , , , , , , , , ,††thanks: also University of Lodz, Lodz, Poland, , , , , , , , , ,††thanks: on leave of absence from Moscow State University, Moscow, Russia, , , , , , , , , ,††thanks: corresponding author; email: aro@crdlx5.yerphi.am, , , ,
=
1 Introduction
Above primary energies of a few hundred TeV direct measurements of energy and mass of individual cosmic ray nuclei are unfeasible due to the drastic decrease of the cosmic ray intensity with increasing energy. Hence, one has resort to the measurements of extensive air showers (EAS) which are produced when high energy cosmic ray particles enter into the Earth’s atmosphere. Therefore the determination of primary energy and mass from EAS observables depends on the understanding of the high-energy hadronic interaction features of the primary particle, and further on of the shower development in general. Consequently redundant information on the measurements is required to disentangle the problem.
The idea to use advanced statistical techniques of multivariate analyses [1] for enriching certain classes of primaries [2, 3] and to prepare enriched samples by event-by-event analyses of EAS observations was first investigated for the ANI experiment [4]. The realization has become feasible by recent measurements of the multi-detector experiment KASCADE [5] which provides an accurate experimental basis by simultaneous measurements of many EAS observables for each individual event. The purpose of this paper is to apply these techniques to KASCADE data and to investigate possibilities of testing high-energy hadronic interaction models.
Such an approach appears to be very promising in view of detailed tests of interaction models currently under debate and for paving the way to a consistent description of the hadronic interaction at extremely high energies by experimental signatures. Still the results of the KASCADE experiment concerning the energy spectrum and mass composition of primary cosmic rays are considerably affected by the uncertainties of the used Monte Carlo models, which are estimated to be much larger than the statistical uncertainties, e.g. for the deduced features of the cosmic ray energy spectrum [6].
The present investigation introduces the preparation of samples of enriched cosmic ray mass groups and their use for studies of hadronic interactions with air nuclei. The concept for the classification is based on multivariate nonparametric methods of statistical inference. Using the information on an event-by-event basis empirical statements can be drawn on the validity of the ‘a priori’ knowledge of the Monte Carlo simulations. Global event observables like the muon and electron shower sizes are used in order to select event samples with enriched contents of proton and iron primaries, respectively. Additional observables mainly of the hadronic component are subsequently used for the investigation of interaction features of the primaries. It is worthwhile to mention that results obtained by event-by-event analyses are conditional on the particular hadronic interaction models used for the Monte Carlo simulation. The disentanglement of the threefold problem in determining of the primary mass, primary energy and strong interaction features by a combined analysis can be improved by selecting enriched samples of various mass groups. Even within one pre-chosen model some hints are expected which will enable to understand which particular features of the strong interaction models have to be improved in order to reproduce the experimental data in a consistent way.
2 Experimental setup and simulation procedures
The KASCADE experiment, located at the laboratory site of Forschungszentrum Karlsruhe, Germany at 8∘E, 49∘N, 110 m a.s.l., consists of three main parts - the scintillator array, the central detector and the muon tracking detector. Due to its multi-detector setup, it is able to measure a large number of EAS characteristics for each individual event in the PeV primary energy region. The schematic view of the KASCADE detector installations is shown in Figure 1.
A scintillator array [5] measures secondary
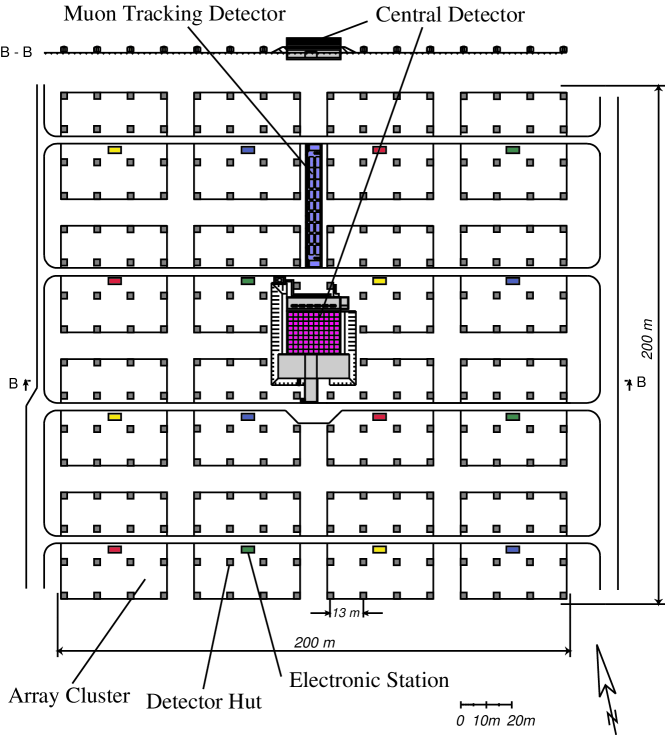
electrons, photons and muons of extensive air showers in 252 detector stations on a grid of 13 m spacing, hence forming an array of m2. The stations contain unshielded liquid scintillation counters and below lead and iron absorbers also plastic scintillators. With this array the reconstruction of the muon and electron size of the EAS is done in an iterative way, e.g. by correcting the electron number by use of the measured muon content [7].
The basic component of the central detector is a finely segmented hadron calorimeter [8]. A m2 iron stack arranged in 9 horizontal planes is equipped by liquid ionisation chambers forming 44,000 electronic channels. The calorimeter measures energy, angle and point of incidence of individual EAS hadrons.
Below 30 radiation lengths of absorber the central calorimeter contains a layer of 456 scintillation detectors [8] acting as trigger for the central detector and measuring the arrival time of muons and hadrons. Underneath the calorimeter two layers of multiwire proportional chambers (MWPC) and one layer of limited streamer tubes (LST) reconstruct muon tracks above an energy of 2.4 GeV with an angular accuracy of about [9].
North of the central detector in a 50 m long tunnel muons above the threshold energy of 0.8 GeV are measured with the help of streamer tubes (LST) [10]. On an area of about 128 m2 three layers of LST track muons with an accuracy of .
For the present analysis 700,000 events registered by the KASCADE field array are used, corresponding approximately to one year data taking. The selection of these showers requires a core distance from the center of the array of less than m and a successful reconstruction of the electron size () and muon size (). The investigated zenith angle range is restricted to . In this sample there are around 6000 events where the shower axis hits the KASCADE central detector, and hence detailed hadronic information of the EAS is available for the analysis.
The simulations for the present analysis use the CORSIKA code version 5.62 [11] with QGSJET [12] as high-energy hadronic interaction model for the EAS development in the atmosphere. The options GHEISHA [13] for the interactions at low energies and EGS4 [14] for the electromagnetic cascades are chosen.
The detailed detector simulation was made on the basis of the GEANT [15] package, taking into account all shower particles, absorber and active materials, energy deposits, and arrival times. More than 20,000 showers are generated for each primary nucleus in the primary energy range of eV. The simulations are performed in 10 energy bins with a spectral slope of inside and of from bin to bin.
| Number of electrons in the EAS () | |
| Truncated number of muons () (MeV) | |
| Number of tracked muons in the central detector (MWPC) (GeV) | |
| Number of reconstructed hadrons at the calorimeter (GeV) | |
| The energy of the most energetic hadron detected (GeV) | |
| Energy sum of the reconstructed hadrons with GeV |
The simulations cover the angular range of . Three different primaries are taken into account: protons, oxygen nuclei, and iron nuclei.
On this basis different EAS parameters are reconstructed whereby simulated and experimental data are handled with the same algorithms. The EAS core position, arrival direction, electron-muon densities, electron size and muon content from the array, hadronic EAS observables, muon tracks and arrival time distributions observed with the central detector, and many other characteristics are reconstructed. EAS parameters used in the present analysis are compiled in Table 1. For a more detailed description of the reconstruction procedures see e.g. refs. [6, 7].
3 Primary energy and mass determination
Multivariate methods are used for the classification of the measured events in mass groups and for energy estimation. These methods take into account the correlations of the used observables. In principle such methods can be applied for any number of observables, but the reconstruction quality is restricted by the statistical accuracy of the reference Monte Carlo sample. For the present analysis a multi-layered feed-forward perceptron neural network algorithm is used to determine the mass and energy of individual primary cosmic rays in the knee region of data registered with KASCADE. It allows to estimate the primary energy and to classify the primary mass into multiple categories using similar procedures. The basics of neural network techniques can be found in [16]. The general procedures for the application of Bayesian and neural network methods at EAS data analysis are given in [17, 6].
For estimation and classification, the observables of
the electromagnetic and
muonic components (,) measured by the
KASCADE field array detectors are used.
The restriction to these two observables is motivated
by following reasons:
Due to the high statistical accuracy available the
uncertainties from EAS fluctuations are smaller
as compared with the hadronic information of EAS.
The information of the KASCADE central detector,
especially the hadronic observables, is intended to be used for
subsequent studies of the interactions of the selected subsamples.
In former studies [18, 19, 20] we have found
that the electromagnetic and muonic component of EAS are described
well by the used high-energy interaction model QGSJET.
The accuracy of the energy estimation, displayed in Figure 2 by the relative deviation of the reconstructed energy from the true energy results in approximately %, with improvements at higher energies and for heavier primaries. It demonstrates the high reliability nearly free from bias eventually arising from the procedure.

We use a wider energy interval for the simulated events than for the experimental ones to avoid an over- or underestimation of primary energies at the boundaries of the investigated energy region. Systematic uncertainties of the energy estimation are the composition of the control sample (here three primaries with equivalent contribution in number of events are used), and the high-energy interaction model itself used for the generation of the samples. Of minor influence is the slope of the energy spectrum used at the Monte Carlo sample if the statistics is large enough over the whole energy range.
After estimating the primary energy each EAS event is classified as being induced by light, intermediate or heavy nuclei. We will refer to these groups as ‘proton’, ‘oxygen’, and ‘iron’. The classification is performed by a neural network independently trained from the net used for the energy estimation. The results of the classification of the trained neural network are presented in Table 2. It shows the probabilities of contamination of events of the different classes in each category. The classification matrix is obtained by classifying 4000 control events (not used for the training) per class. A high purity (rather small share of events from alternative classes) of proton and iron events is obvious, while the oxygen class has a lower purity since it
| j=H | j=O | j=Fe | |
|---|---|---|---|
| i=H | 80 | 18 | 2 |
| i=O | 19 | 58 | 23 |
| i=Fe | 2 | 23 | 75 |
contains a significant contamination from both, protons and irons. The classification depends slightly on primary energy with improved accuracy at higher energies by % due to decreasing fluctuations of the observables. The restriction to three mass groups leads to systematic distortions if intermediate primary mass groups are present in control or measured samples. For example, helium nuclei would be classified mainly as protons and a part of them (more than protons) would be attributed to the medium and heavy classes (see ref. [6]).
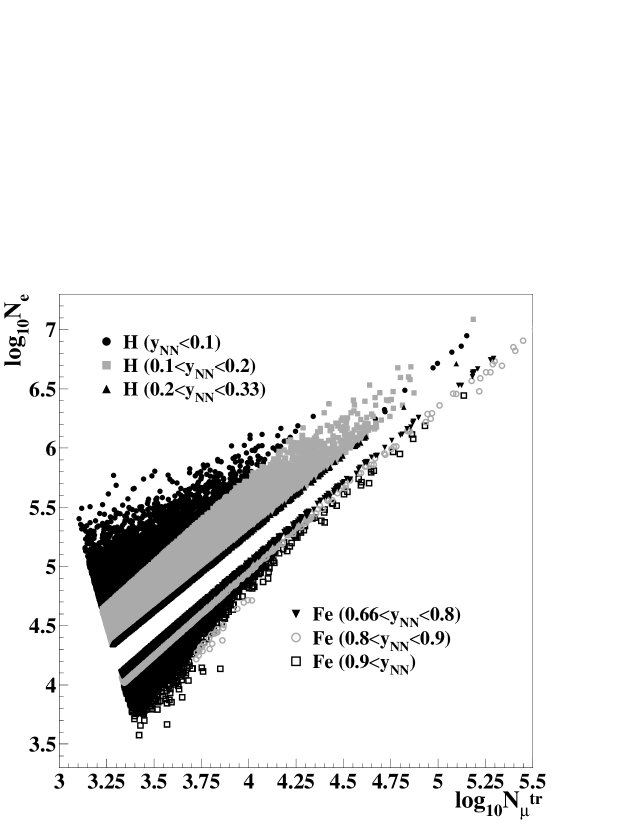
After applying the trained neural networks to measurements we combine the energy and mass information of the analyzed KASCADE data sample. Figures 4 and 4 display the (,)- and (,)-dependence for the three selected samples of primaries. The energy resolution is expected to be % as demonstrated by Monte Carlo simulations (Fig. 2), and the mass discrimination power is % as illustrated in Table 2. The discrimination power is defined as the geometric mean of the probabilities . It is obvious that the mean values are rather close for the intermediate and heavy groups of nuclei, which explains the comparatively strong mixture between these two classes (). The mean numbers of muons are approximately the same for all


primaries in all energy bins. One recognizes small differences from that in the lowest energy bins, but the overall independence of from the primary mass is obvious, i.e. dominates (at KASCADE observation level) the energy estimation. The slight deviations at high energies from a pure power law in case of protons are probably due to a small underestimation at highest energies () (see Figure 2).
4 The purification procedure
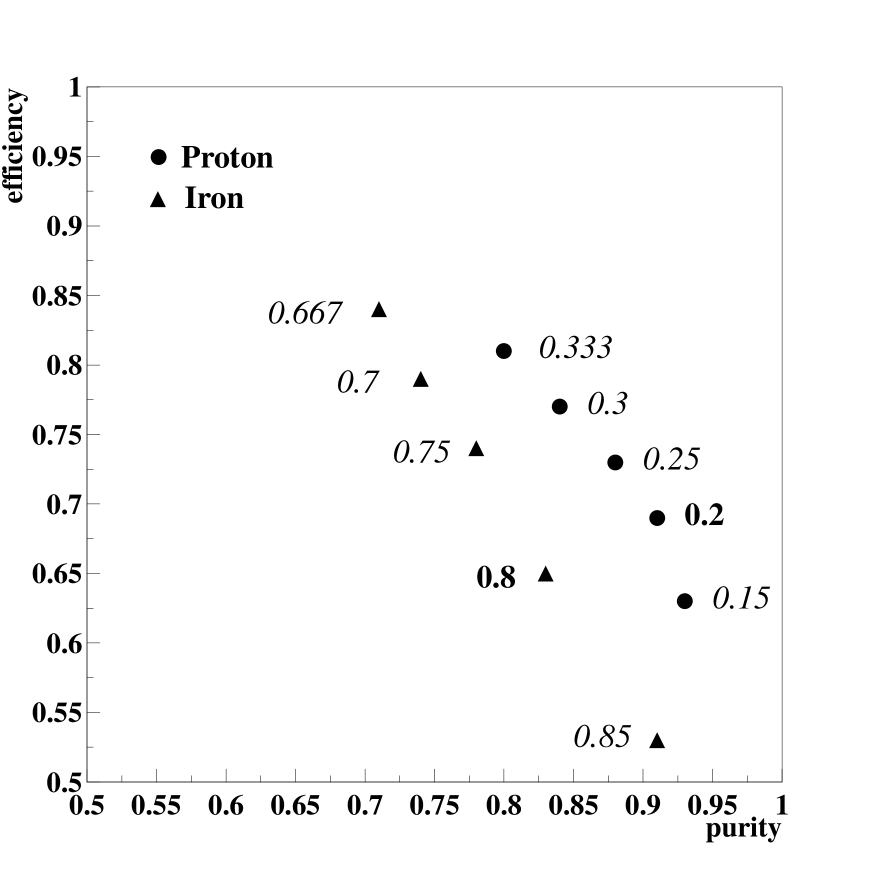
The neural network analyses perform a nonlinear mapping of multidimensional characteristics of the EAS to the real number interval (Fig. 6). Particular class assignments for the three way classification are the subintervals , and for the light, medium, and heavy nuclei, respectively. We characterize the quality of the classification procedures by the ‘purity’ and ‘efficiency’ variables. The purity of a sample is defined as the fraction of true classified events in an actual number of events assigned to a given class. The classification efficiency is defined as the fraction of true classified events to the initial number of events of a given class. The actual classification procedure results in a purity of 80% for the proton class, and of 70% for the iron class assuming equal total numbers of primaries in each of the three classes. The neural information technique [21] allows now to reduce the contamination of misclassified events in each class of nuclei. Of course, the efficiency of the classification is reduced at the same time. The optimum of purity and efficiency to be chosen depends on the given problem. Investigations of the behavior of definite primaries requires a higher purity at may be efficiency, whereas estimation of chemical composition needs high efficiency. It should be remarked, that for obtaining results on chemical composition of a measured sample the numbers in each class have to be corrected with the misclassification matrix. Changing the boundaries of the class assignments will always result in the same composition after the correction, if no systematic effects are introduced. In this analysis the possibility of the selection of maximally pure samples of cosmic ray mass groups will now be investigated, with respect to the question of the cost we have to pay (in terms of efficiency loss) to get light and heavy nuclei induced showers with higher purity.
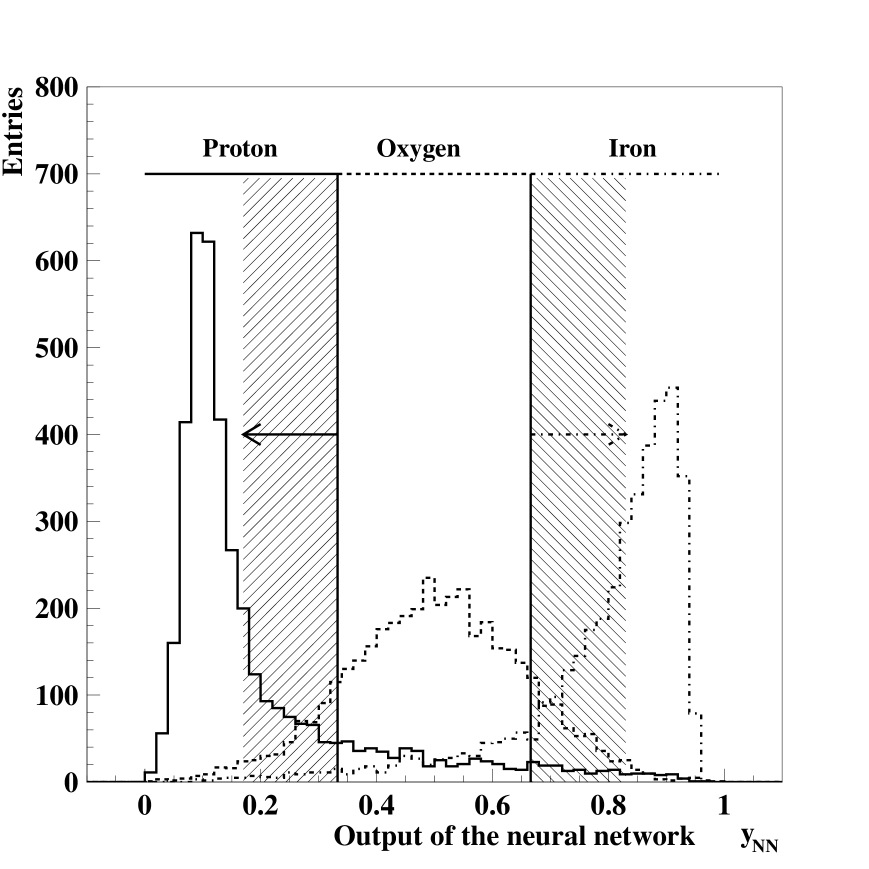
When the neural network (NN) is satisfactorily trained, the NN output distributions for the different classes are overlapping at the subinterval boundaries. Therefore, by shrinking the subintervals, one can remove a large proportion of misclassified events. But, simultaneously one looses parts of the correctly classified events. Figure 6 illustrates this procedure of purification.
Figure 6 plots purity versus efficiency for two classes. For equal total number of simulated events the purity of proton and iron nuclei can reach more than % while the efficiency is still remaining above %. The purity and efficiencies are obtained by classifying 4000 simulated control events per class which are not used for the training of the neural network. For a given purity value the efficiency of proton events is always slightly larger than the efficiency for the iron induced sample, due to the narrower NN output distribution of the protons (Fig. 6), e.g. the separation of oxygen-proton is better than oxygen-iron. The separation of protons from the other classes is good due to the combination of proton and helium nuclei in one class.
For the preparation of the enriched samples to investigate the hadronic interactions the

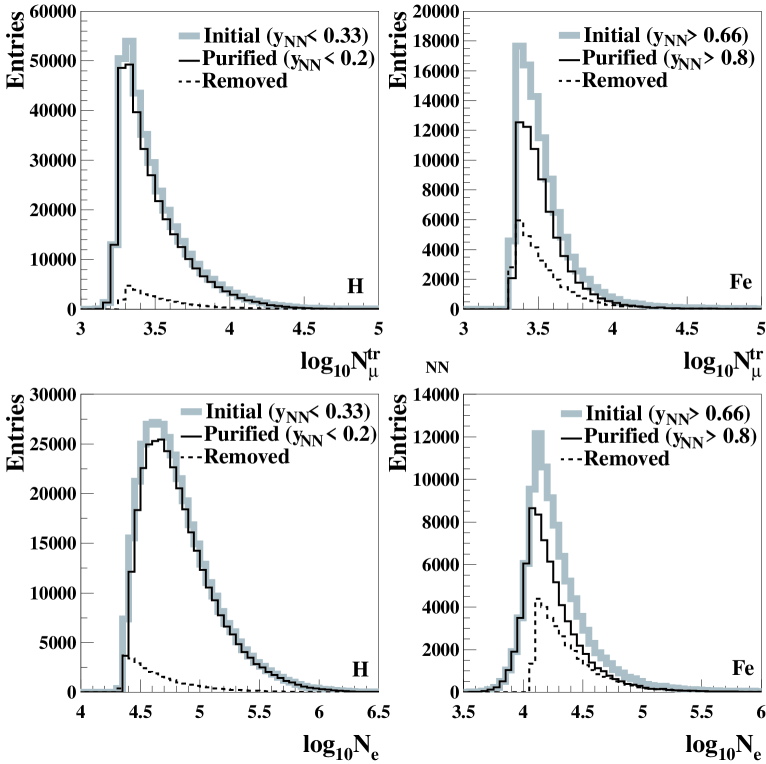
purification procedure has to be scrutinized in order to get the optimal purification not to distorte the initial parameter distributions. Hence, first of all we investigate how the shrinking of the interval for the different classes at the NN output affects the corresponding one- and two-dimensional distributions of the selected events, i.e. the bias introduced by the purification. For this we compare the distributions of observables for the measured EAS samples of events selected by the purification with the removed ones. Figure 7 shows the distributions of EAS parameters of proton and iron classes for two different cuts in the NN output intervals applied to the KASCADE data sample. The upper two plots show the purified and removed distributions compared with the initial ones in case of the muon size, and the lower two plots in case of the electron number. For the shown purification the boundaries are shifted from y to y and from y to y, respectively.
| Initial | 4.82(0.316) | 4.30(0.311) | 3.49(0.228) | 3.54(0.210) |
|---|---|---|---|---|
| Purified | 4.83(0.313) | 4.26(0.300) | 3.49(0.227) | 3.54(0.202) |
| Removed | 4.67(0.309) | 4.40(0.316) | 3.53(0.237) | 3.55(0.229) |
The events are removed over nearly the whole range of the distributions proving the small dependence of the classification on primary energy. A more detailed inspection of Figure 7 shows that only few events with smallest shower size are removed from the iron sample and only few events with largest size from the proton events distribution. The opposite situation is observed for the distribution. Figure 8 illustrates this feature by displaying as example the ratio of the purified to initial sample of the distributions for the proton sample. The shape (Fig. 7) and the mean values with and (Table 3) of the distributions are only slightly changed by the purification procedure. For further investigations using the purified samples it is important that they still represent the total range of the distributions.
In order to scrutinize possible systematic distortions of distributions of parameters not used in the classification procedure, one-dimensional statistical tests [22] have been performed comparing the initial and the purified samples. Table 4 displays the results of three different tests for hadronic observables measured with the KASCADE central detector.
| proton distributions | iron distributions | |||||
|---|---|---|---|---|---|---|
| 0.36 | 0.99 | 0.49 | 0.35 | 0.99 | 0.28 | |
| 0.36 | 0.77 | 0.40 | 0.38 | 0.72 | 0.23 | |
| 0.30 | 0.81 | 0.29 | 0.40 | 0.84 | 0.26 | |
We perform different tests because they compare the distributions using varying statistical criteria. The presented values are the probabilities of accepting the null hypothesis, which is that these two samples are from one and the same population. In cases of small probabilities the null hypothesis is rejected, i.e. there exists a big difference between the two samples. It was found that all probabilities from Table 4 are above the critical values of these tests to reject the null hypothesis [22]. The initial and purified proton and iron samples belong statistically to the same population demonstrating that the purification does not introduce large systematic distortions. It should be noted that these tests have been done for hadronic observables which are not used for energy estimation and mass classification.
Generally, the one-dimensional distributions are not strongly affected by more detailed cuts in the NN output distribution. Therefore, a cut applied to the NN output distribution is not linearly transfered to the distributions of the input parameters.
This feature illustrates that the neural network analysis performs a nonlinear mapping of the multidimensional input vector to an one-dimensional output value, with the observation that the fraction of removed events at the - and -distributions is nearly independent of the shower sizes. This is demonstrated in Figure 9, which displays the (,)-parameters as a two-dimensional distribution. It is obvious that we remove both proton and iron events from the boundary region, where the misclassification probability is high. But by changing the cut values in the NN output different regions of the (,) parameter space are involved. The nonlinearity of the mapping is of importance as linear cuts would not do justice to the intrinsic shower fluctuations in and which depend on primary energy and mass.
We conclude that only small systematic uncertainties are introduced to the parameter distributions when ‘purifying’ the proton and iron samples. But there are still other parameters which may be systematically affected by the cuts.
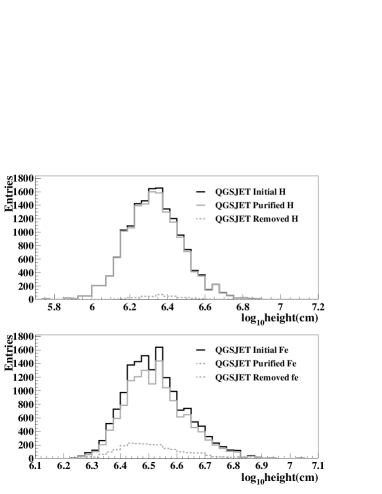

One of these parameters is the height of the first interaction of the primary nucleus. Unfortunately this parameter is not accessible by our experimental data. Therefore the distributions of this parameter for initial and purified proton and iron samples have been only investigated for MC data. As the height of the first interaction influences directly the muon and electron shower sizes at observation level, we expect that the purification affects mainly the boundary region (low heights for iron and large heights for proton) of the height distribution. This is confirmed as displayed in Figure 10. Additionally Figure 10 shows, that an eventual systematic bias introduced for this parameter remains again small.
5 Studies with mass enriched EAS samples
An estimation of the primary energy with % relative error in addition to an accurate classification of the primary particles into 3 mass categories was performed. The purification technique was applied for preparing the enriched samples using only the KASCADE array information () (see also [23]). The procedure facilitates production of enriched samples of proton and iron induced events with the additional knowledge of the primary energy on an event-by-event basis. Some characteristic features of these purified ‘light’ and ‘heavy’ samples will now be discussed, especially the behavior of hadronic observables with primary energy. The event selection and reconstruction procedures are done for simulated and experimental data samples in a corresponding way.


First, the parameters and of the experimental events are compared with those from MC simulations (Figures 12 and 12). A good agreement is displayed, demonstrating the high methodical accuracy, and furthermore, that the electromagnetic and muonic components of EAS are well described by the MC model used. As the method takes also the correlation of the two observables into account, the agreement in both observables suggests the validity of the Monte Carlo model for these gross shower parameters.
The purification of the samples makes it possible to study high-energy muons and hadronic observables detected by the KASCADE central detector separately for showers induced by different primary mass. These parameters are not used for energy estimation and mass clasiification and for producing the enriched samples. In this context a test can be performed on the balance of energy and particle number distributions of the different shower components in the Monte Carlo model. For illustration purposes of the presented techniques we consider the energy sum of the hadrons with GeV reconstructed on shower-to-shower basis from calorimeter data of the central detector system. Only EAS with the core inside the area of the central detector have been used. Additionally an electron number of more than 10,000 and at least two reconstructed hadrons (GeV) for a single event were required. Hence, the number of selected events is noticeably reduced.
In Figure 14 we compare simulations using the QGSJET model [12] with KASCADE data. In the data sample the fraction of showers induced by light nuclei is larger than that of heavy induced showers. Hence the distributions of the proton class are smoother and show smaller statistical fluctuations.


For the data points with lowest reconstructed energies the model predicts an increased hadronic energy sum compared to the data. This may be affected by systematic features of trigger or cut efficiencies, but the increase is even more pronounced if instead the total energy sum the energy of the highest energy reconstructed hadron is considered (Figure 14). This observation together with the information of earlier investigations of KASCADE data [6] suggests that cut and trigger effects are minor sources of the discrepancy. The nonzero contamination of both, proton and iron induced events by the intermediate nuclei has been ignored in the simulations. This unknown role of primaries of intermediate mass (mostly helium nuclei) at the data sample may lead to the systematic differences in the distributions. Figure 15 shows the one-dimensional distribution of the reconstructed hadronic energy for the proton
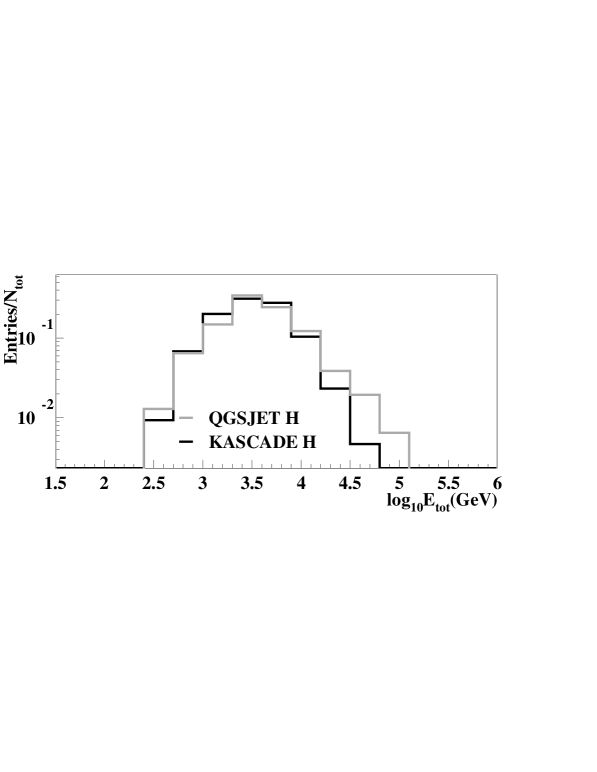
enriched sample in the energy range of for both data and Monte Carlo. Here again a slight overestimation of the hadronic energy at the predictions is visible. It was found that an adaption of the simulated to measured slope of the energy spectrum does not reduce the deviation. But introducing a reasonable part of primary helium nuclei in the simulated sample lead to an overlap of the distributions.
Allowing for the limited accuracy of the method, the distributions shown in Figures 14 and 14, originating from primary proton and iron nuclei do agree well with the predictions of the Monte Carlo simulations, i.e. the overall dependence of the shower observables are consistent with the simulations using the QGSJET model. This finding is also confirmed by considerations of the numbers of high-energy muons and hadrons reconstructed at the central detector. We therefore conclude that the QGSJET model describes the KASCADE data in a consistent way for the considered energy range of eV - eV. The found behavior of the QGSJET model in the present investigations confirms the findings of an earlier publication of the KASCADE collaboration [18]. Especially the results shown in Figure 14 are comparable to comparisons of Monte Carlo events with data in Figure 13 of ref. [18], but in the present case the hadronic parameter is displayed with respect to the reconstructed primary energy and for enhanced samples of different mass groups.
With a larger sample of higher statistical accuracy this kind of comparisons provides, albeit indirectly, reliable information on strong interaction parameters and will help to tune the hadronic interaction models used as Monte Carlo generators. Studies with distributions based on larger statistical accuracy are foreseen for different energy intervals and various hadronic interaction models in a forthcoming paper. A more sophisticated approach is planned with a neural network trained for a classification in four or five mass groups.
6 Summary
The paper presents an approach for the preparation of enriched cosmic ray mass group samples from EAS observations. For that purpose a unified framework of statistical inference has been used, based on nonparametric techniques for the analysis of multivariate parameter distributions. The approach has been demonstrated with experimental data of the multidetector experiment KASCADE, whose large number of EAS observables, simultaneously measured for each event, enables a successful application and useful investigations of high energy hadronic interactions on an event-by-event basis.
For the preparation of samples enriched with events of a given class (mass of the primary particle) the (,)-correlation has been exploited as a potential mass and energy identifier, using reference patterns from Monte Carlo simulations with the QGSJET model as generator of the high-energy hadronic interaction. The classification and misclassification rates have been studied and a purification procedure of the samples has been introduced. Efficiency and purity of the procedure are scrutinized. It has been shown that the purity of the samples (fraction of true classified events in an actual sample allocated to a given class) can be noticeably improved without a drastic reduction of the efficiency (defined as fraction of true classified events of the total number of events of a given class). It should be emphasized that the procedure does remove events over nearly the full range of the distributions, thus avoiding any biasing of the remaining samples. In addition the approach accounts properly for the natural EAS fluctuations, as far as the reference patterns reflect also these fluctuations realistically.
For illustrations, in a second step, the prepared samples have been used to study various EAS observables from the KASCADE experiment and their consistency with the QGSJET model. The electron size and muon content can be fairly well reproduced, as well as hadronic observables measured at the core of showers, though in the latter case the samples are affected by the limited statistical accuracy of the number of events registered with the hadron calorimeter, and of the Monte Carlo simulations. An improvement of the analyses in this direction is a future task with studies of other current hadronic interaction models using the presented distributions.
It is obvious that the demonstrated approach enables a number of interesting investigations of the interaction of such enriched samples with the air nuclei, e.g. studies of the attenuation lengths of specified primary cosmic particles by EAS observations with different zenith angles of incidence and with detector installations on different observation levels.
Acknowledgment
The authors would like to thank the members of the engineering and technical staff of KASCADE who considerably contributed to the reported measurements. The work has been supported by the Ministry for Research of the Federal Republic of Germany and by a NATO Collaborative Linkage Grant between Armenia and Germany (PST.CLG.978825). The Romanian Ministry of Education and Research provided a grant for supporting the collaborating group of the National Institute for Physics and Nuclear Engineering of Bucharest. The Polish collaborating group of the Cosmic Ray Division of the Soltan Institute of Nuclear Studies in Lodz is supported by the Polish State Committee for Scientific Research (grant No. 5 P03B 133 20). The KASCADE collaboration work was embedded in the frame of scientific-technical co-operation (WTZ) projects between Germany and Armenia (ARM 98/002), Poland (POL-99/005), and Romania (ROM 99/005).
References
- [1] Chilingarian A. A., Comp. Phys. Com., 54, 381, 1989
- [2] Chilingarian A. A., Zazyan H. Z., Sov. J. Nucl. Phys., 54, 128, 1991 (in russian)
- [3] Chilingarian A. A., Zazyan H. Z., Il Nuovo Cimento, 14C(6), 555, 1991
- [4] ANI Collaboration, NIM, A 323, 104, 1992
-
[5]
Klages H. O. et al.,
Nucl. Phys. B, 52B, 92, 1997;
Antoni T. et al. - KASCADE collaboration, NIM, 2002, submitted - [6] Antoni T. et al. - KASCADE collaboration, Astropart. Phys., 16, 245, 2002
- [7] Antoni T. et al. - KASCADE collaboration, Astropart. Phys., 14, 245, 2001
- [8] Engler J. et al., NIM, A 427, 528, 1999
- [9] Bozdog H. et al., NIM, A 465, 455, 2001
- [10] Doll P. et al., NIM, A 488, 517, 2002
- [11] Heck D. et al., FZKA-Report 6019, Forschungszentrum Karlsruhe, 1998
- [12] Kalmykov N. N., Ostapchenko S. S., Pavlov A. I., Nuclear Phys. B, 52B, 17, 1997
- [13] Fesefeldt H., Report PITHA-85/02, RWTH Aachen, 1985
- [14] Nelson W. R., Hirayama H., Rogers D. W. O., Report SLAC 265, Stanford Linear Accelerator Center, 1985
- [15] CERN, GEANT: CERN Program Library Long Writeups, 1993
- [16] Bishop C. M., Neural Networks for Pattern Recognition, Oxford Univ. Press, New-York, 1995
- [17] Chilingaryan A. A., Neurocomputing, 6, 497, 1994
- [18] Antoni T. et al. - KASCADE collaboration, J. Phys. G: Nucl. Part. Phys., 25, 2161, 1999
- [19] Antoni T. et al. - KASCADE collaboration, J. Phys. G: Nucl. Part. Phys., 27, 1785, 2001
- [20] Milke J. et al. - KASCADE collaboration, Proc. of the 27th ICRC 2001, Hamburg 1, 241, 2001
- [21] Chilingarian A. A., Program Package ANI, (Users Manual, unpublished) http://crdlx5.yerphi.am/proj/ani
- [22] Fukunaga K., Introduction to Statistical Pattern Recognition, Academic Press, Harcourt Brace Jovanovich Publishers, 1990
- [23] Vardanyan A. A. et al., Proc. of the Workshop ANI 99, Nor-Amberd, Armenia FZKA-Report 6472, Forschungszentrum Karlsruhe, eds. A.A.Chilingarian, A.Haungs, H.Rebel, Kh.Sanosyan, p. 23, 1999