THE MID-INFRARED EMITTING DUST AROUND AB AUR
Abstract
Using the Keck I telescope, we have obtained 11.7 m and 18.7 m images of the circumstellar dust emission from AB Aur, a Herbig Ae star. We find that AB Aur is probably resolved at 18.7 m with an angular diameter of 1.2 at a surface brightness of 3.5 Jy arcsec-2. Most of the dust mass detected at millimeter wavelengths does not contribute to the 18.7 m emission, which is plausibly explained if the system possesses a relatively cold, massive disk. We find that models with an optically thick, geometrically thin disk, surrounded by an optically thin spherical envelope fit the data somewhat better than flared disk models.
1 INTRODUCTION
Herbig Ae/Be stars are pre-main sequence progenitors of intermediate mass A- and B-type stars which possess strong infrared excesses, dominated by thermal emission from dust grains. It is generally thought that these stars possess circumstellar disks (Mannings & Sargent 1997, 2001) in which planets might form. The grain properties (size, temperature and composition) and the macroscopic geometry of the mid-infrared emitting dust around these stars are not yet well determined. In the simplest models, Herbig Ae/Be stars possess optically thick, geometrically thin disks which produce spectral energy distributions (SEDs) with , steeper than the observed SEDs (Hillenbrand et al. 1992). Several groups have suggested a variety of explanations for this discrepancy such as flared disks with a surface layer of small grains (Chiang & Goldreich 1997) and geometrically thin disk embedded in spherically symmetric envelopes (Miroshnichenko et al. 1999). We have carried out a high resolution mid-infrared imaging study of AB Aur to learn about the spatial distribution of warm dust which may allow us to distinguish among models.
AB Aur is a A0 Ve+sh (shell) Herbig Ae star with a Hipparcos distance of 144 pc from the Sun. Since AB Aur lies near the zero age main sequence, there is some uncertainty in estimating its age. Mannings & Sargent (1997) estimate a total stellar luminosity and effective temperature, = 53.6 and , which corresponds to a stellar age and mass of 3-5 Myr and 2.5 , using pre-main sequence tracks computed by D’Antona & Mazzitelli (1994). Van den Ancker, de Winter, & Tjin A Djie (1998) have estimated a total stellar luminosity and effective temperature, = 47 and , which corresponds to a stellar age and mass of 2 Myr and 2.4 , using pre-main sequence tracks computed by Palla & Stahler (1993). AB Aur is an excellent source for high resolution mid-infrared imaging because it is bright and close by. It is one of four stars in the Hillenbrand et al. (1992) sample which possess a Q band magnitude brighter than -1.0 and lies at a distance less than 150 pc. All models for the dust distribution around AB Aur presume that it is a single star. If AB Aur is a binary, then current models are incomplete.
Millimeter aperture synthesis imaging of AB Aur has resolved a rotating disk of 13CO (J=10), with a radius of 450 AU and at a position angle of 79, around AB Aur, with velocities consistent with Keplerian rotation (Mannings & Sargent 1997). Based upon the aspect ratio of the major:minor axes, Mannings & Sargent (1997) find an inclination of 76° for the disk. Previous mid-infrared imaging studies of AB Aur report spatially resolved observations of the mid-infrared emission at 17.9 m using the 5 m Hale telescope (Marsh et al. 1995). They find an elongated disk, with an East-West extent of 8020 AU and a North-South extent of 2520 AU and thus a position angle consistent with that observed for the CO disk. However, subsequent higher resolution near infrared interferometry (Millan-Gabet et al. 1999; Millan-Gabet, Schloerb, & Traub 2001) and scattered light imaging of AB Aur (Grady et al. 1999) suggest a disk inclination of less than 45.
The dust around AB Aur has been studied with a variety of techniques. Near infrared, interferometric observations at H and K’ bands have resolved a ring of emission with a radius of 0.35 AU (Millan-Gabet et al. 1999). ISO 2-200 m spectra have revealed the presence of PAH, FeO, and olivine emission features and Si-O and O-Si-O bending modes (van den Ancker et al. 2000). However, to date, no complete view of the dust around AB Aur has been constructed. Thus, we discuss models for the dust around AB Aur in the context of millimeter continuum fluxes, infrared spectra, and near infrared visibilities. In addition, we compare models for the dust around AB Aur with our high resolution Keck 18.7 m map.
2 OBSERVATIONS
Our data were obtained on 2000 February 20 (UT) and 2000 August 9 (UT) at the Keck I telescope using the Long Wavelength Spectrometer (LWS) which was built by a team led by B. Jones and is described on the Keck web page. The LWS is a 128128 SiAs BIB array with a pixel scale at the Keck telescope of 0.08 and a total field of view of 10.210.2. We used the “chop-nod” mode of observing and two different filters: 11.2-12.2 and 18.2-19.2 m. The seeing on 2000 August 9 was significantly better than that on 2000 February 20; thus, we concentrate our analysis on the data obtained in August 2000. We used Cet for flux and point spread function (PSF) calibrations and MWC 480 (an unresolved Herbig Ae star) and And for additional PSF calibrations. The data were reduced at UCLA using standard LWS routines.
We flux calibrate our February and August data using the result for Tau and Cet that = 507.8 Jy and 174.5 Jy, respectively and = 189.4 Jy and 66.3 Jy (Gezari et al. 1987) extrapolated to our bands assuming that between 10 and 20 m. For AB Aur, we find = 252 Jy and 192 Jy for February and August, respectively, and = 312 Jy and 172 Jy for February and August, respectively. We conservatively estimate the uncertainties associated with our measurements from the drift in the fluxes of all of our standard stars throughout the night. Comparison of our fluxes and of published fluxes in the 10 m and 20 m bands (listed in Tables 2 and 3) suggest that AB Aur is variable at mid-infrared wavelengths. The 2410% 11.7 m variability we observe is consistent with the 21.76.6% IRAS 12 m 6 month variability reported by Prusti & Mitskevich (1994). The 468% 18.7 m variability we observe is significantly larger than the 14.38.5% variability IRAS 25 m 6 month variability reported by Prusti & Mitskevich (1994). However, the absolute magnitudes of our 18.7 m fluxes are similar to 17 m fluxes measured using ISO and the IRTF, 24.4 Jy (Thi et al. 2001) and 22.7 Jy (Richter et al. 2002) respectively.
The color temperature, inferred from our 11.7 m and 18.7 m photometry, for our data agrees within the error bars for our two epochs of observations. The flux ratio, (11.7 m)/(18.7 m), is 0.80.1 and 1.10.2 for Februrary 2000 and August 2000, respectively. Thus, we can not rule out the possibility that changes in intrinsic luminosity of the star generate the observed variability. AB Aur possesses strong variability in the H P Cygni profile and in measurements of the linear polarization of UBVRI. Based upon monitoring of these diagnostics in 1993 and 1994, Beskrovnaya et al. (1995) suggest that circumstellar inhomogeneities may be responsible for the variability on hour to month long timescales. Prusti & Mitskevich (1994) suggest that dust formation in the stellar wind or dust on eccentric orbits may be reponsible for the mid-infrared variability.
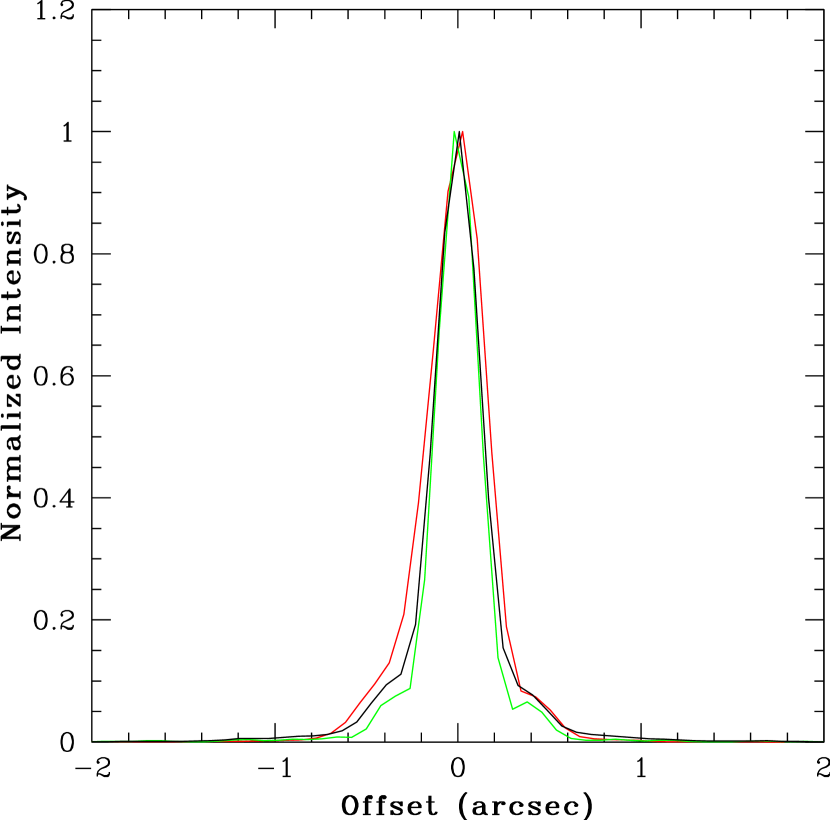
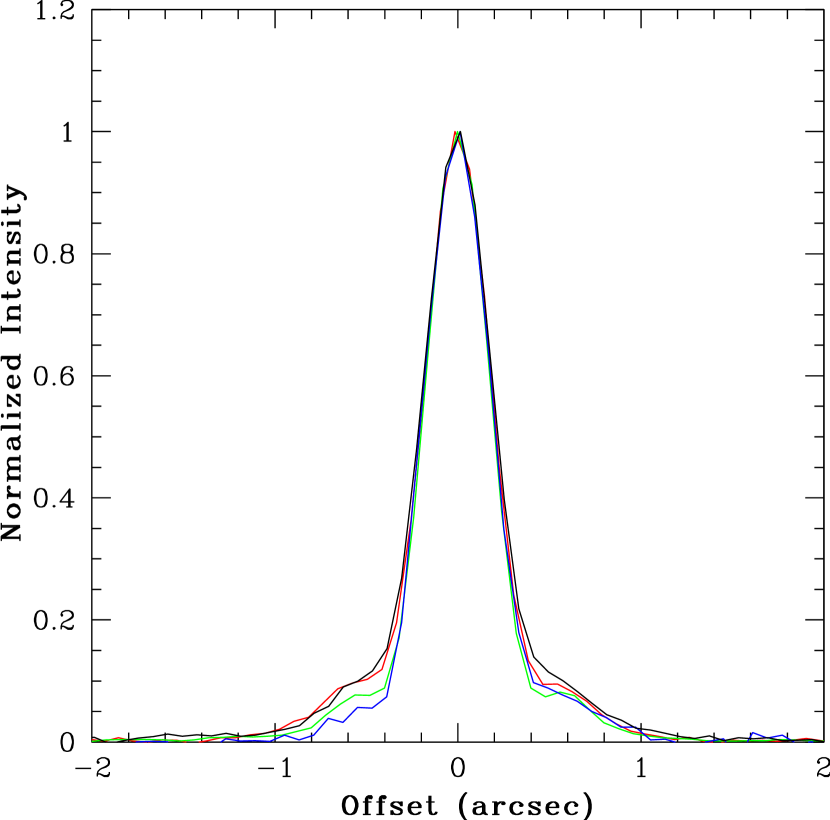
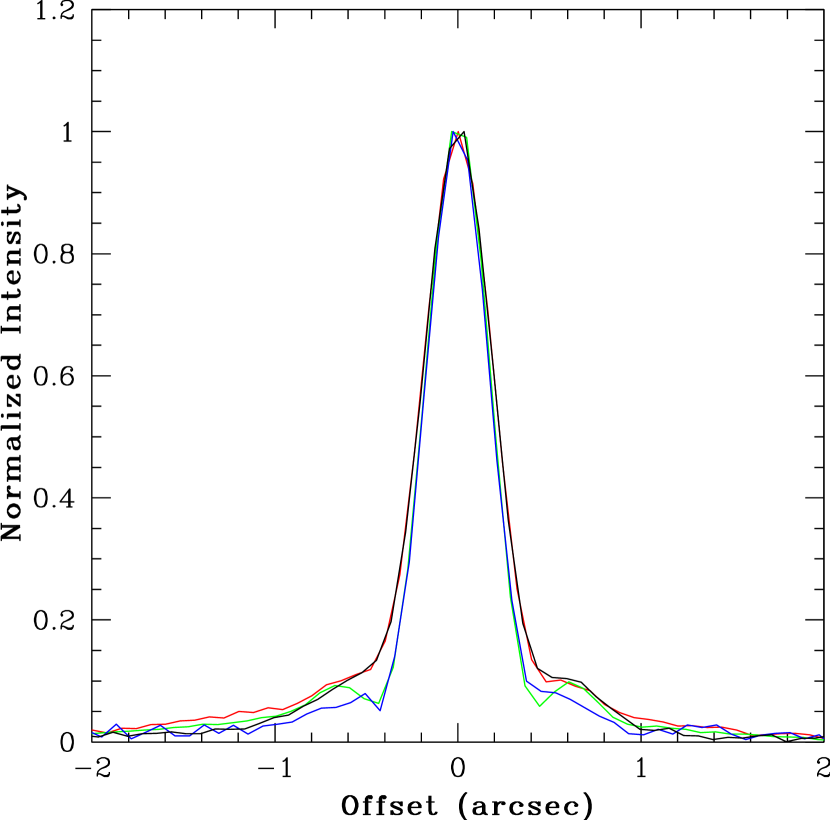
We generate images from our chop-nod sets by coadding chop pairs from both nod positions in each of our nod sets. The 18.7 m PSF contains a ghost and diffuse asymmetric scattering while the 11.7 m PSF is clean. Although the seeing was excellent, the PSFs varied somewhat during the night. We show line cuts through AB Aur and our 11.7 m standards in Figure 1a and through AB Aur and our 18.7 m standards perpendicular to and parallel to the scattered light in Figures 1b and 1c. The Airy rings can be seen in all of the 18.7 m line cuts and half of the 11.7 m line cuts. Since there is some variation in the PSF at 18.7 m, we compare our images of AB Aur to 3 PSF calibrators: Cet, observed 57 minutes earlier, MWC 480 (an unresolved Herbig Ae star), observed 11 minutes later, and And, observed 2 hours, 26 minutes earlier than AB Aur. We use MWC 480 as our primary PSF because it was observed closest in time to AB Aur. We also use And because it was observed with the worst seeing during the evening.
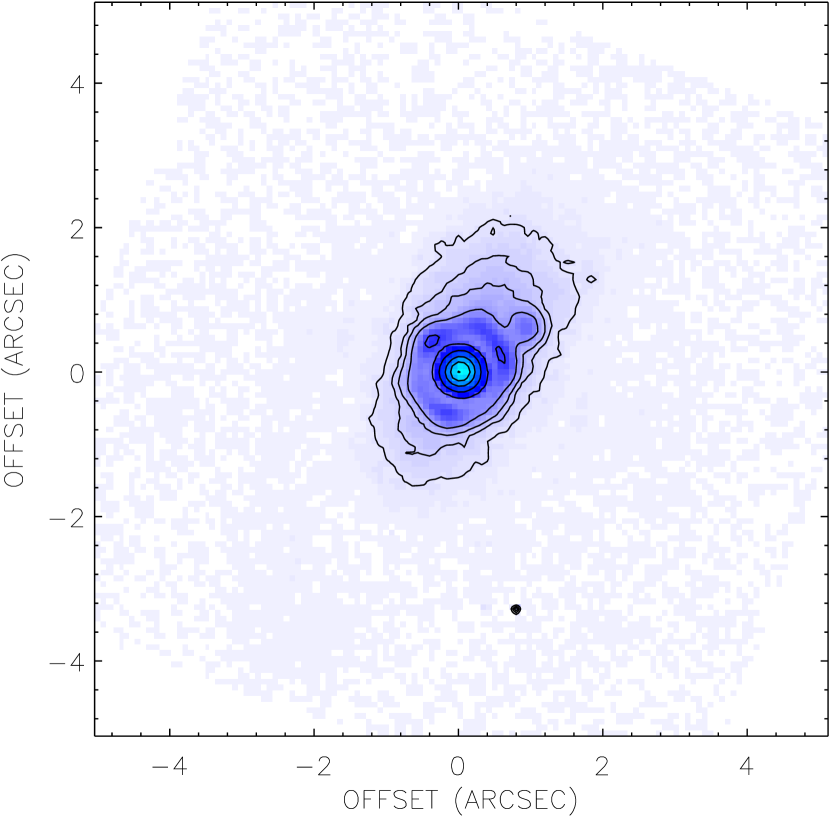
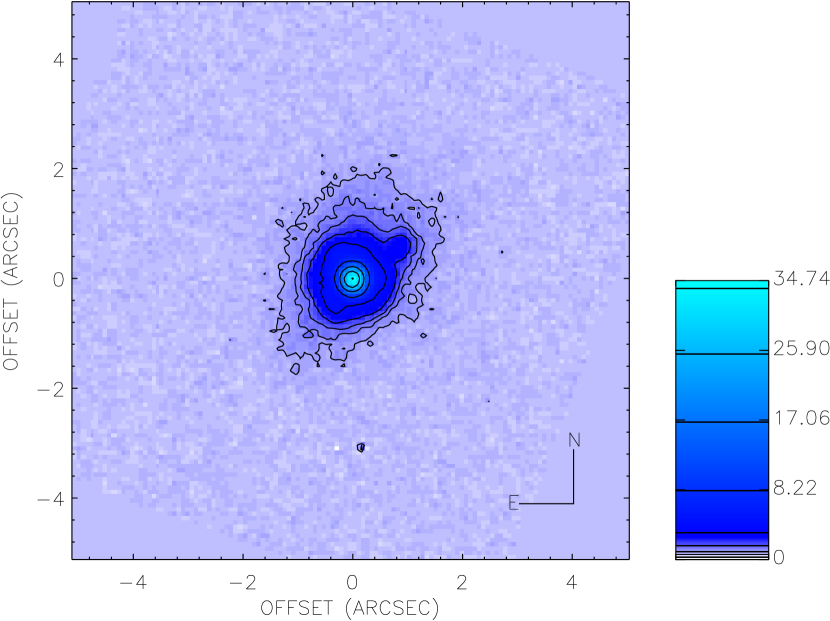
AB Aur is probably resolved at 18.7 m with an angular diameter of 1.2 at a surface brightness of 3.5 Jy arcsec-2 (10% of the maximum surface brightness). An image of our calibrator Cet at 18.7 m is shown in Figure 2 with contours showing 1%, 2%, 3%, 5%, 10%, 25%, 50%, and 99% of the maximum surface brightness. We display Cet instead of MWC 480 because it is a significantly bright object, making the ghost and diffuse scattered light significantly easier to see. An image of AB Aur at 18.7 m is shown in Figure 3 for comparison with the same contours as in the image of Cet. The diameter of AB Aur at 10% of the maximum surface brightness is 50% larger than the same contour in the image of Cet. In addition, the lowest surface brightness contours (1%, 2%, 3%, and 5%) are more symmetric in the image of AB Aur than in the image of Cet. Our image of AB Aur at 18.7 m does not exhibit the same asymmetry reported by Marsh et al. (1995) at 17.9 m. AB Aur appears unresolved at 11.7 m, with a Full Width at Half Maximum (FWHM) of 0.30, consistent with a point source.
3 THE CIRCUMSTELLAR DISK AND MORE?
The total mass of dust around AB Aur has been estimated from millimeter contiuum measurements in an elliptical beam with FWHM 3.5 5.6. At = 2.7 mm, Mannings & Sargent (1997) find that AB Aur appears unresolved and measured a flux, (2.7 mm) = 10.6 0.4 mJy which, in their models, corresponds to = 2.0 1029 g.
We can estimate the minimum mass of warm dust contributing to the 18.7 m flux. If the dust is optically thin and the population has a single temperature, then
| (1) |
(Jura et al. 1995) where is the dust absorption opacity and is the distance to the object. We estimate the temperature of the dust, , from the ratio of our 11.7 m and 18.7 m fluxes, assuming a single population of grains. If = 250 K, (18.7 m) = 17.2 Jy, and = 1000 cm2/g (Ossenkopf, Henning, & Mathis 1992), then = 1.2 1025 g, substantially less than that inferred from millimeter continuum measurements. Therefore, a large amount of cold dust must exist in the system, presumably in a disk.
4 COMPARISON WITH MODELS
We use our data to evaluate the following four detailed models for the dust around AB Aur: (1) An optically thick, geometrically thin disk surrounded by an optically thin, spherically symmetric envelope (Vinkovic et al. 2002). (2) Two spherically symmetric dust shells, whose grain properties (composition, size and spatial distribution) are inferred from ISO 2 - 200 m spectra (Bouwman et al. 2000). (3) A geometrically thin, flared disk in vertical hydrostatic equilibrium (D’Alessio et al. 1998). (4) A flared disk with an optically thin surface layer of small grains and an infrared emitting rim (Dullemond, Domink, & Natta 2001).
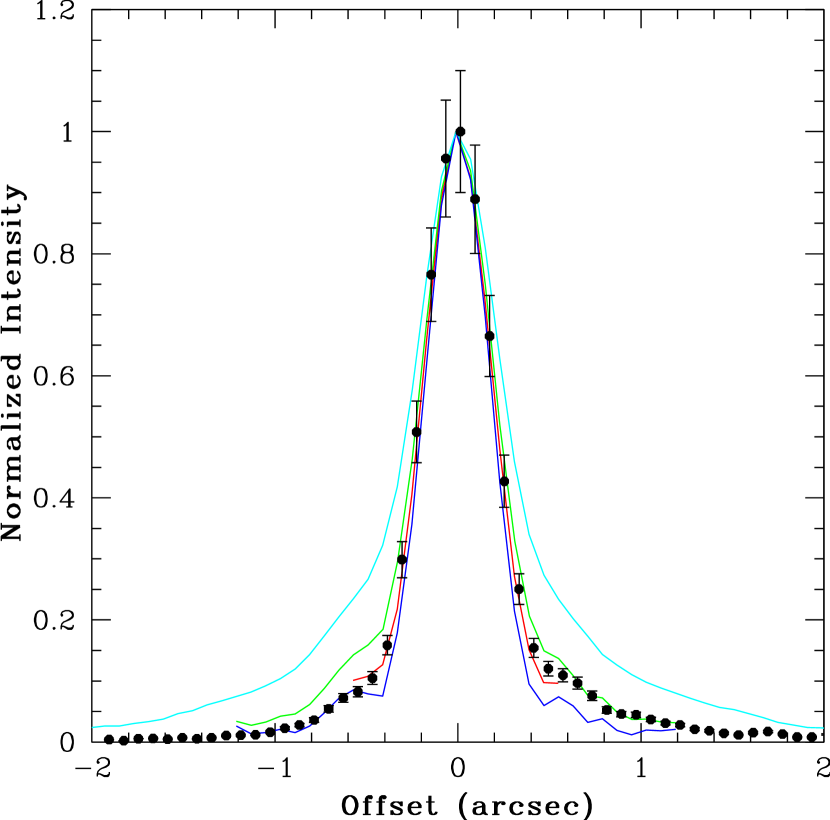
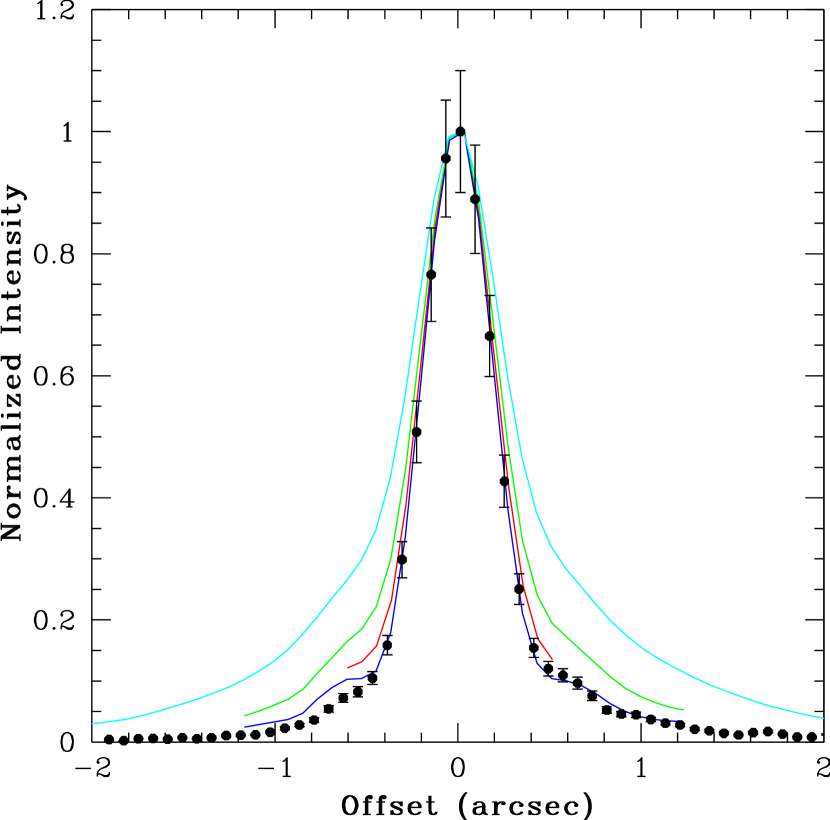
We convolve these models for the predicted surface brightness of AB Aur at 18.7 m with the PSF and compare them with our observations of AB Aur. Each model was interpolated to provide surface brightnesses on the same grid as the observations. Since line cuts through each of the models, convolved with a PSF, compared with the AB Aur data look similar independent of position angle, we only show line cuts along the North-South direction of each of the models, convolved with a PSF, compared with the AB Aur data. In Figure 4a, MWC 480, an unresolved Herbig Ae star observed closest in time to AB Aur, was used as the PSF. In Figure 4b, And, the most extended PSF observed during the night, was used. Line cuts through different position angles appear similar; thus, we show line cuts through only one orientation. In addition, we calculate the reduced for the inner 1.2 1.2 centered on AB Aur, using MWC 480 as the PSF. In both analyses, we scale the image of the model, convolved with the PSF, so that the maximum surface brightness is equal to the measured maximum surface brightness of AB Aur. Since AB Aur is located at a distance of 144 pc, the flux expected from the stellar photosphere at 18.7 m, = 0.032 Jy, is significantly less than the smallest measured excess flux, = 17.2 Jy, and can be neglected. We calculate the reduced for each model assuming that the uncertainty in the surface brightness is 10%, approximately the uncertainty in the 18.7 m photometry. Finally, we also compare the models to measured near infrared interferometric visibilities, infrared spectra, and millimeter continuum measurements.
4.1 A Spherically Symmetric Envelope?
Vinkovic et al. (2002) have modeled the SED of AB Aur with a system which consists of a star with radius, , and effective temperature, , surrounded by a geometrically thin and optically thick passive disk extending from to an outer radius = 240 AU. The optically thick disk is assumed to have an inclination, = 76, consistent with the CO observations of Mannings & Sargent (1997). They also incorporate a spherical dust envelope with an inner radius, = 99.3 and an outer radius, 1000 . At distances less than , grains in the envelope are sublimated. The mass density and grain size distributions are given by
| (2) |
| (3) |
where is the distance between the star and the circumstellar material and is the grain radius. The dust grains are assumed to be an interstellar mixture of 53% silicates and 47% graphite by number (Draine & Lee 1984) with a minimum grain radius, = 0.005 m, and a maximum grain radius = 0.250 m. They assume an optically thick, geometrically thin (flat) disk with an outer temperature of 25 K, a disk mass, = 8.6 1030 g, and an envelope mass, = 2.8 1027 g, corresponding to an optical depth, = 0.44, consistent with the value measured by van den Ancker et al. (2000) ( = 0.5). Their best fit model for the SED for AB Aur yields a total flux = 25 Jy with 12 Jy from the disk and 13 Jy from the envelope.
We compare the inner 1.2 1.2 of our 18.7 m map of AB Aur with the model (Vinkovic et al. 2002). When the intensity map for this model is convolved with the PSF and scaled so that the maximum surface brightness is equal to that measured for AB Aur, the reduced = 4.6. Their model agrees well with our data.
However, the Vinkovic et al. (2002) model does have some limitations. They do not provide a physical explanation for the stability of the envelope. In addition, their model does not attempt to reproduce the detailed infrared spectra; a standard interstellar grain mixture is assumed. While the near infrared fluxes are fit, the measured visibilities are not considered. Finally, the model assumes a dust disk mass which is more than an order of magnitude higher than is inferred from millimeter continuum measurements.
4.2 Modeling the Infrared Spectra
Bouwman et al. (2000) infer dust composition, spatial distribution, and grain sizes by fitting ISO 2 - 200 m spectra. For simplicity, they assume that the dust around AB Aur is optically thin and contained within spherically symmetric shells and neglect the presence of a circumstellar disk. They describe the density distribution, , and the grain size distribution, , with power laws.
| (4) |
| (5) |
where is the dust density at the inner edge of the dust shell, , and is the minimum dust grain size. They find that a combination of two populations of dust, a “hot” population at 1 - 11 AU, containing 5.2 1024 g (m = 2.8) and a “cold” population at 28 - 175 AU, containing 6.6 1028 g (m = 2.0), reproduces the observed 2-200 m ISO spectrum well. Their model fit parameters, including grain composition and the mass fraction of dust in each species, are reproduced in Table 4. Bouwman et al. (2000) assume that the iron oxide grains are small (2/ 1) and do not infer a size distribution for this species.
Since Bouwman et al. (2000) do not predict the surface brightness of their model, we estimate the surface brightness of optically thin, spherically symmetric dust shells as a function of angular offset on the sky, assuming the same “hot” and “cold” populations of dust with the same power law dependences for and and the same composition. The specific intensity at an offset, , from the star is calculated by integrating along the line of sight through the envelope, perpendicular to the sky.
| (6) |
where is the distance between the star and the dust grains whose radiation is summed in the integral. For the cold grains, = and = 0 for 28 AU and = for 28 AU. For the warm grains, = and = 0 for 1 AU and = for 1 AU. The grain temperature for each species, , is calculated numerically, at a distance from the star, assuming that the grains are in radiative equilibrium.
| (7) |
where and are the stellar radius and temperature, is the distance between the star and the dust grain. We calculate the absorption coeffecient for each species of dust, , and wavelengths less than 0.2 m following Bouwman et al. (2000). We calculate a total flux = 45 Jy, with 20 Jy produced by the hot population and 25 Jy produced by the cold population.
The Bouwman et al. (2000) model does not fit our data particularly well. After scaling the surface brightness to that of AB Aur, convolving a 1.2 1.2 model of the dust emission with the PSF (MWC 480) yields a reduced = 8.6.
Bouwman et al. (2000) use grain materials which reproduce the ISO 2 - 200 m emission features well. They have some difficulty reproducing the observed near infrared visibilities. Their best fit model includes iron grains with radii 0.01 - 0.1 m to produce the near infrared emission close to the star. Iron is chosen as a material because it is one of the few materials which is likely to survive at temperatures 1500 K and its emissivity is high at near infrared wavelengths and low at mid- and far infrared wavelengths; there is no direct evidence for the presence of metallic iron from emission line features. The Bouwman et al. (2000) model is inconsistent with the measured visibility curves. A single grain population of metallic iron grains with radius, = 0.32 m, and minimum distance, = 0.35 AU fits the visibilities the best and reproduces the measured near infrared size of AB Aur. Bouwman et al. (2000) neglect the presence of a circumstellar disk altogether.
4.3 A Flared Disk in Hydrostatic Equilibrium?
Another possibility is that the flat SED is produced by a flared disk. Flared disks intercept more stellar flux than geometrically flat disks, allowing surface grains to be warmed to higher temperatures. Flared disks have been observed around the young stellar objects HH 30 and HK Tau/c in scattered light using HST (Burrows et al. 1996; Stapelfeldt 1998). Simple semi-analytical models of flared disks with a layer of small (2/ 1), optically thin, surface grains can reproduce the SEDs of some T Tauri and Herbig Ae stars (Chiang & Goldreich 1997; Chiang et al. 2001). Detailed numerical modeling has shown that stellar radiation is capable of heating the outer regions of the disk so that they become optically thin and vertically isothermal (D’Alessio et al. 1998). D’Alessio, Calvet, & Hartmann (2001) successfully model the SEDs and images of edge-on disks like HH30 and HK Tau/c.
D’Alessio et al. (2002) model the intensity of the dust around AB Aur at 18.7 m assuming that the central star has mass, = 2.4 , radius, = 2.5 , and effective temperature = 9500 K and is surrounded by a disk with inner radius, = 3 and an outer radius, = 200 AU. They assume a disk inclination, = 75.5, and a disk dust mass, = 5.6 1029 g, with a gas:dust ratio of 100:1. They assume that the disk is composed of silicates, trolite, ice, and organics with mass fractional abundances (relative to the gas mass) of 0.0034, 0.000768, 0.0056, and 0.0041 respectively (D’Alessio et al. 2001). The grains are assumed to have a size distribution described by a power law,
| (8) |
with a minimum grain radius, = 0.005 m and a maximum grain radius, = 1 mm. The assumption of grain growth in this model changes the opacity of the dust grains at small and large wavelengths and therefore the temperature distribution of the disk. Larger grain sizes decrease the fraction of stellar radiation intercepted by the disk resulting in a colder disk. The model assumes an accretion rate, Ṁ = 1.0 10-8 /year, corresponding to a accretion luminosity of 2 .
The flared disk model does not fit our data particularly well. It predicts too little 18.7 m flux, 5 Jy, compared with all of the 20 m band flux measurements. This may partly be the result of the high assumed inclination, = 75.5. Recent near infrared interferometry (Millan-Gabet et al. 1999) and scattered light imaging (Grady et al. 1999) suggests that the inclination of the AB Aur disk is probably less than 45. Since the luminosity of the disk depends directly on the cosine of the inclination, the estimated flux of the D’Alessio disk might be as much as 2.8 times higher if it is calculated for an inclination of 45. When the maximum surface brightness is scaled to that of AB Aur, convolving a model of the inner 1.2 1.2, with the most likely PSF (MWC 480) yields a reduced = 9.2. However, convolving the model with the worst PSF ( And), yields a model which appears consistent with the observations.
The D’Alessio et al. (2002) model has some limitations. They assume a Pollack et al. (1994) grain mixture and ignore detailed grain composition information from infrared spectra. They do not fit the observed near infrared visibilities. However, their assumed circumstellar dust disk mass is an approximate agreement with that inferred from millimeter continuum measurements.
4.4 A Flared Disk with a Hot Inner Rim?
The simpled flared disk model with a surface layer of small, optically thin grains predicts too little disk emission for AB Aur at near infrared wavelengths. Dullemond et al. (2001) have refined the Chiang & Goldreich (1997) flared disk model to allow for direct stellar heating of dust grains at the inner disk radius. In their model, grains sublime when their temperatures reach (= = 1500 K). The direct stellar radiation on the inner rim surface warms the grains effectively, creating the observed near infrared excess, puffing up the inner disk, and casting a shadow on adjacent portions of the disk. Dullemond et al. (2001) model the AB Aur system with a star, with = 2.4 , = 2.5 , = 9520 K, ( = 47 ) surrounded by a disk with an inner rim = 0.52 AU away from the star and an outer radius = 400 AU. The vertical height of the inner rim is = 0.19 . In modeling the SED, the circumstellar disk is assumed to have an inclination, = 65, less than that inferred from the CO observations of Mannings & Sargent (1997), more consistent with the 45 inclination inferred from scattered light observations of Grady et al. (1999). However, the model of intensity as a function of position was calculated assuming that the AB Aur disk was face-on. Dullemond et al. (2001) assume a disk surface density
| (9) |
where = 104 g/cm2 with a total mass of 4.0 1029 g. The gas:dust ratio is assumed be 100:1. The dust grains are assumed to be a mixture of 95% astronomical silcate (Draine & Lee 1984) and 5% amorphous carbon (Ivezic et al. 1997). The rim and disk produce an 18.7 m flux, = 49 Jy.
The Dullemond et al. (2001) model does not agree with our mid-infrared observations. The reduced for the model convolved with the PSF (MWC 480), in the inner 1.2 1.2, is 84, when the convolved image is scaled to have the same maximum surface brightness as AB Aur. Since the rim produces an order of magnitude less emission than the disk at 18.7 m, the Dullemond et al. (2001) model is essentially a Chiang & Goldreich (1997) flared disk with an inner radius of 8 AU. If the disk were to extend to an inner radius of 0.5 AU, 8% more 18.7 m emission would be produced (Dullemond et al. 2001) in the central pixel, only slightly affecting our normalization. Thus, the Chiang & Goldreich (1997) model similarly does not agree with our mid-infrared observations.
Dullemond et al. (2001) do fit other observational data well. They reproduce the measured near infrared fluxes and visibilities by placing the hot inner rim at the grain sublimation distance. Their assumed disk mass agrees with the dust mass, inferred from millimeter continuum measurements. They use a silicate/carbon grain mixture and do not match the infrared spectrum.
5 DISCUSSION
Models for the dust around AB Aur must fit a suite of multi wavelength observations if they are to be successful. In Table 5, we summarize the current ability of models to fit various observational data sets. In Table 6, we compare the predicted 18.7 m fluxes, dust disk masses, and reduced s of each model to those inferred from observations. By examining the line cuts shown in Figures 4a and 4b, we see that the Dullemond et al. (2001) model for the dust intensity predicts too much flux at distances 0.24 (35 AU) from the star. If MWC 480 more accurately represents the PSF, then the Bouwman et al. (2000) model predicts too much emission and the D’Alessio (2002) model predicts too little emission at distances 0.40 (58 AU) from the star. In this case, the Vinkovic et al. (2002) model is favoured. Flared disk models are not able to reproduce both the compact size of AB Aur and the strong mid-infrared flux. However, there is some uncertainty in the seeing at the time that AB Aur was observed; thus, it is not possible to rule out the flared disk model. Limitations exist with all the models, as described above. Future models of AB Aur must consider the grain composition, if they are to accurately model the SED and dust emission.
6 CONCLUSIONS
We have obtained high resolution mid-infrared images of AB Aur at 11.7 m and 18.7 m using the LWS on the Keck I telescope.
1. AB Aur is probably resolved at 18.7 m, with an angular diameter of 1.2 at a surface brightness of 3.5 Jy arcsec-2, and unresolved at 11.7 m, with a FWHM = 0.30.
2. Only 1025 g of dust is required to produce the 18.7 m emission. Millimeter interferometry indicates the presence of 2 1029 g of dust. Thus, a large amount of cold dust must exist in the system, presumably in a disk.
3. The spatial distribution of the 18.7 m emission is most consistent with radiation from an optically thick, geometrically thin disk embedded in a spherically symmetric dust envelope (Vinkovic et al. 2002); however, the presence of a flared disk can not be excluded. None of the models yet reproduces all of the available observations.
References
- Beskrovnaya et al. (1995) Beskrovnaya, N. G., Pogodin, M. A., Najdenov, I. D., & Romanyuk, I. I. 1995, A&A, 298, 585
- Böhm & Catala (1993) Böhm, T., & Catala., C. 1993, A&AS, 101, 629
- Böhm & Catala (1995) Böhm, T., & Catala., C. 1995, A&A, 301, 155
- Bouwman et al. (2000) Bouwman, J., de Koter, A., van den Ancker, M. E., & Waters, L. B. F. M. 2000, A&A, 360, 213
- Burrows et al. (1996) Burrows, C. J., Stapelfeldt, K. R., Watson, A. M., Krist, J. E., Ballester, G. E., Clarke, J. T., Crisp, D., Gallagher, J. S. 1996, ApJ, 473, 437
- Chiang & Goldreich (1997) Chiang, E. I., & Goldreich, P. 1997, ApJ, 490, 368
- Chiang et al. (2001) Chiang, E. I., Joung, M. K., Creech-Eakman, M. J., Qi, C., Kessler, J. E., Blake, G. A., van Dishoeck, E. F. 2001, ApJ, 547, 1077
- D’Alessio et al. (1998) D’Alessio, P., Cantó, J., Calvet, N., & Lizano, S. 1998, ApJ, 500, 411
- D’Alessio, Calvet, & Hartmann (2001) D’Alessio, P., Calvet, N., & Hartmann, L. 2001, ApJ, 553, 321
- D’Alessio (2002) D’Alessio, P. 2002, personal communication
- D’Antona & Mazzitelli (1994) D’Antona, F., & Mazzitelli, I. 1994, ApJS, 90, 467
- Draine & Lee (1984) Draine, B., & Lee, H. M. 1984, ApJ, 285, 89
- Dullemond, Domink, & Natta (2001) Dullemond, C. P., Dominik, C., & Natta, A. 2001, ApJ, 560, 957
- Dullemond (2002) Dullemond, C. 2002, personal communication
- Gezari, Schmitz, & Mead (1987) Gezari, D., Schmitz, M., & Mead, J. M. 1987, Catalog of Infrared Observations Part II Appendixes (Greenbelt: NASA)
- Grady et al. (1999) Grady, C. A., Woodgate, B., Bruhweiler, F. C., Boggess, A., Plait, P., Lindler, D.J., Clampin, M., & Kalas, P. 1999, ApJ, 523, L151
- Hillenbrand et al. (1992) Hillenbrand, L. A., Strom, S. E., Vrba, F. J., & Keene, J. 1992, ApJ, 397, 613
- Ivezić et al. (1997) Ivezic, Z., Groenewegen, M. A. T., Menshchikov, A., & Szczerba, R. 1997, MNRAS, 291, 121
- Jura et al. (1995) Jura, M., Ghez, A., White, R. J., McCarthy, D. W., Smith, R. C., & Martin, P. G. 1995, 445, 451
- Mannings & Sargent (1997) Mannings, V., & Sargent A. I. 1997, ApJ, 490, 792
- Mannings & Sargent (2001) Mannings, V., & Sargent A. I. 2001, ApJ, 529, 391
- Marsh et al. (1995) Marsh, K. A., Van Cleve, J. E., Mahoney, M. J., Hayward, T. L., & Houck, J. R. 1995, ApJ, 451, 777
- Millan-Gabet et al. (1999) Millan-Gabet, R., Schloerb, F. P., Traub, W. A., Malbet, F., Berger, J. P., & Bregman, J. D. 1999, ApJ, 513, L131
- Millan-Gabet et al. (2001) Millan-Gabet, R., Schloerb, F. P., & Traub, W. A. 2001, ApJ, 546, 358
- Miroshnichenko et al. (1999) Miroshnichenko, A., Ivezíc, Z., Vinković, D., & Elitzur, M. 1999, ApJ, 520, L115
- Natta et al. (2001) Natta A., Prusti, T., Neri, R., Wooden, D., Grinin, V. P., & Mannings, V. 2001, A&A, 371, 186
- Ossenkopf, Henning, & Mathis (1992) Ossenkopf, V., Henning, T. & Mathis, J. S. 1992, A&A, 261, 567
- Palla & Stahler (1993) Palla, F., & Stahler, S. W. 1993, ApJ, 418, 414
- Prusti & Mitskevich (1994) Prusti, T., & Mitskevich, A. S. 1994, in The Nature and Evolutionary Status of Herbig Ae/Be Stars, eds. P. The, M. Perez, & P. van den Heuvel (San Francisco, Astronomical Society of the Pacific), 257
- Pollack et al. (1994) Pollack, J. B., Hollenbach, D., Beckwith, S., Simonelli, D. P., Roush, T., Fong, W. 1994, ApJ, 421, 615
- Richter et al. (2002) Richter, M. J., Jaffe, D. T., Blake, G. A., & Lacy, J. H. 2002, ApJ572, L161
- Stapelfeldt et al. (1998) Stapelfeldt, K. R., Krist, J. E., Menard, F., Bouvier, J., Padgett, D. L., Burrows, C. J. 1998, ApJ, 502, L65
- Thi et al. (2001) Thi, W. F., van Dishoeck, E. F., Blake, G. A., van Zadelhoff, G. J., Horn, J., Becklin, E. E., Mannings, V., Sargent, A. I., van den Ancker, M. E., Natta, A., & Kessler, J. 2001, ApJ, 561, 1074
- van den Ancker, de Winter, & Tjin A Djie (1998) van den Ancker, M. E., de Winter, D., & Tjin A Djie, H. R. E. 1998, A&A, 330, 145
- van den Ancker et al. (2000) van den Ancker, M. E., Bouwman, J., Wesselius, P. R., Waters, L. B. F. M., Dougherty, S. M., & van Dishoeck, E. F. 2000, A&A, 357, 325
- Vinkovic et al. (2002) Vinkovic, D. Ivezic, Z., Miroshnichenko, A.S. & Elitzur, M. 2002, in preparation
| Quantity | Adopted Value | Reference |
|---|---|---|
| Spectral Type | A0Ve+sh | 1 |
| Distance | 144 pc | 2 |
| Effective Temperature (Teff) | 9500-10210 K | 2, 5 |
| Stellar Radius (R∗) | 2.3-2.5 R☉ | 2, 5 |
| Stellar Luminosity (L∗) | 47-53.6 L☉ | 2, 5 |
| Stellar Mass (M∗) | 2.4-2.5 M☉ | 2, 5 |
| Rotational Velocity () | 80 km/sec | 3 |
| Fractional Dust Luminosity | 0.44 | 4 |
| () | ||
| Estimated Age | 2-5 Myr | 2, 5 |
References. — (1) Böhm & Catala (1993); (2) van den Ancker et al. (2000); (3) Böhm & Catala (1995); (4) Natta et al. (2001); (5) Mannings & Sargent (1997)
| Date | Wavelength | Flux | Reference |
|---|---|---|---|
| Observed | (m) | (Jy) | |
| 10.1 | 25.2 | Hillenbrand et al. (1992) | |
| 1993 Oct 23 | 11.7 | 20.60.6 | Marsh et al. (1995) |
| 1994 Nov 14 | 11.7 | 23.00.7 | Marsh et al. (1995) |
| 2000 Feb 20 | 11.7 | 252 | this paper |
| 2000 Aug 9 | 11.7 | 192 | this paper |
| 12 | 30.41.8 | Prusti & Mitskevich (1994) | |
| 12 | 23.81.4 | Prusti & Mitskevich (1994) | |
| 12 | 18.71.3 | Richter et al. (2002) |
| Date | Wavelength | Flux | Reference |
|---|---|---|---|
| Observed | (m) | (Jy) | |
| 17 | 24.4 | Thi et al. (2001) | |
| 17 | 22.72.3 | Richter et al. (2002) | |
| 1994 Nov 14 | 17.9 | 34.75.2 | Marsh et al. (1995) |
| 2000 Feb 20 | 18.7 | 313 | this paper |
| 2000 Aug 9 | 18.7 | 172 | this paper |
| 20.25 | 27.2 | Hillenbrand et al. (1992) | |
| 25 | 49.6 | Prusti & Mitskevich (1994) | |
| 25 | 42.5 | Prusti & Mitskevich (1994) |
| Vinkovic et al. (2002): | ||||
|---|---|---|---|---|
| (m) | ||||
| Astronomical Silicate | 0.63 | 0.005-0.250 | ||
| Carbon | 0.37 | 0.005-0.250 | ||
| Bouwman et al. (2000): | ||||
| Hot | Hot (m) | Cold | Cold (m) | |
| Olivine | 0.71 | 0.01-5.0 | 0.74 | 0.01-126 |
| Carbon | 0.16 | 0.01-2.0 | 0.11 | 0.01-32 |
| Water Ice | - | - | 0.15 | 0.1-40.0 |
| Iron | 0.06 | 0.01-1.0 | - | - |
| Iron Oxide | 0.07 | - | 910-4 | - |
| D’Alessio (2002): | ||||
| (m) | ||||
| Silicate | 0.25 | 0.005-1000 | ||
| Trolite | 0.05 | 0.005-1000 | ||
| Ice | 0.40 | 0.005-1000 | ||
| Organics | 0.30 | 0.005-1000 | ||
| Dullemond et al. (2001): | ||||
| (m) | ||||
| Astronomical Silicate | 0.95 | 0.005-0.250 | ||
| Amorphous Carbon | 0.05 | 0.16 |
| Infrared | 18.7 m | Near infrared | |
|---|---|---|---|
| Spectrum | Image | Visibilities | |
| Vinkovic et al. (2002) | Omitted | Yes | Omitted |
| Bouwman et al. (2000) | Yes | No | No |
| D’Alessio (2002) | Omitted | Possibly | Omitted |
| Dullemond et al. (2001) | Omitted | No | Yes |
| (18.7 m) | Dust Mass | Reduced | |
|---|---|---|---|
| (Jy) | (g) | ||
| Observed Quantities | 31, 17 | 2 1029 ††Disk mass estimated from 2.7 mm interferometry (Mannings & Sargent 1997) | |
| Predicted Quantities: | |||
| Vinkovic et al. (2002) | 25 | 8.6 1030 | 4.6 |
| Bouwman et al. (2000) | 45 | 6.6 1028 ‡‡Dust in the Bouwman et al. (2000) model is located in spherically symmetric dust shells and not in a circumstellar disk. | 8.6 |
| D’Alessio (2002) | 5 | 5.6 1029 | 9.2 |
| Dullemond et al. (2001) | 49 | 4.2 1029 | 84 |