Extended Emission from Cygnus X3 Detected with Chandra
Abstract
We have discovered extended X-ray emission from the microquasar Cyg X–3 in archival Chandra X-ray Observatory observations. A 5′′ wide structure lies approximately 16′′ to the NE from the core point source and may be extended in that direction. This angular scale corresponds to a physical extent of roughly 0.8 lyr, at a distance of 2.5 lyr from Cyg X–3 (assuming a 10 kpc distance). The flux varied by a factor of 2.5 during the four months separating two of the observations, indicating significant substructure. The peak 2–10 keV luminosity was . There may also be weaker, extended emission of similar scale oppositely directed from the core, suggesting a bipolar outflow. This structure is not part of the dust scattering halo, nor is it caused by the Chandra point spread function. In this Letter we describe the observations and discuss possible origins of the extension.
1 Introduction
Cyg X–3 is a bright high mass X-ray binary with a 4.8 hr orbital period lying at a distance of 10 kpc (Dickey, 1983). The exact nature (black hole or neutron star) of the compact object is still in question. The mass donating companion is most likely an early Wolf-Rayet star (Fender et al., 1999) with an intense stellar wind evidenced by both infrared (van Kerkwijk, 1993) and X-ray (Paerels et al., 2000) lines. The source is highly variable from radio to hard X-ray wavelengths. In the radio, several Jansky flares are associated with the ejection of relativistic radio jets (see e.g., Geldzahler et al., 1983; Mioduszewski et al., 2001). Depending on assumptions made for the jet geometry, intrinsic velocities between 0.3c – 0.8c have been inferred. Cyg X–3 is therefore one of about a dozen Galactic binaries considered to be “microquasars” (see Distefano et al., 2002, for a list). When observed at milliarcsecond scales, the radio jets appear to be one-sided, while on arcsecond scales they appear two-sided. In either case the jet axis is nearly north-south.
2 Observations and Analysis
Chandra has observed Cyg X–3 with the spectroscopy array of the Advanced CCD Imaging Spectrometer/High Energy Transmission Grating (ACIS-S/HETG) on four occasions for the purposes of studying the Wolf-Rayet wind (Paerels et al., 2000), measuring the source distance (Predehl et al., 2000), and searching for emission lines from the radio jets. The observations were made in 1999 October and December and in 2000 April (see Table 1). Figure 1 puts the Chandra observations in the context of the Rossi X-ray Timing Explorer All Sky Monitor (RXTE/ASM) Cyg X-3 light curve. The X-ray flux exhibits a strong bimodal behavior, alternating between extended periods below 10 and above 20 cps. Observations 101+1456a and 1456b occurred during a transition to and in a low state, respectively, while 425 and 426 were during the high state. Since the scattering halo is proportional to the recent point source flux, the high state observations have much brighter halo emission which is effectively a background for the detection of extended structure.
In our analysis of these observations, we used the CIAO tools version 2.2. The archival data were processed with ASCDS versions R4CU5UPD9 (101, 1456) and 6.3.1 (425, 426).
2.1 Image Analysis
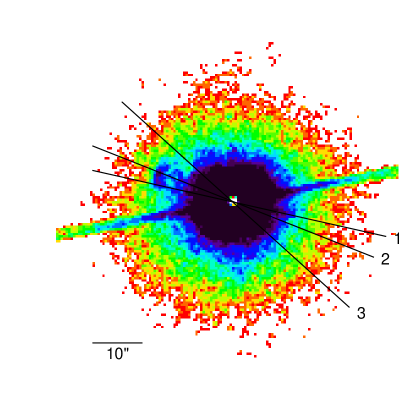
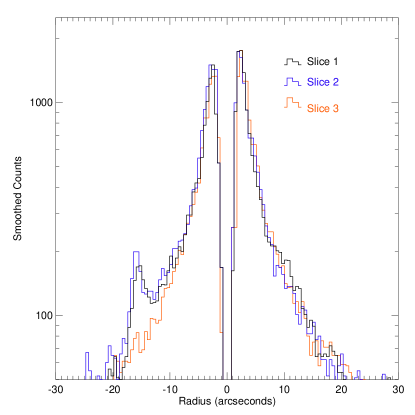
For each observation, we extracted the zeroth order image binned at the nominal ACIS-S resolution (0.49′′). Figure 2 shows the total image from all four observations. In each individual image, there is a bright, unresolved core surrounded by a strong scattering halo (Predehl et al., 2000) and the point spread function (PSF) wings. In each case, there is also significant (10) excess emission to the NE (position angle, PA75∘) of the point source. The farthest extent from the core is 18′′, corresponding to 2.7 lyr where is the distance in units of 10 kpc. It is also clearly extended, by about 5′′ (0.8 lyr), orthogonal to the core direction. As a fiducial location for the extension, its brightest point, near the center of the outermost arc, lies at RA=20h 32m 27s.1, Dec=40∘ 57′ 33′′.5 (J2000). We are confident the extension is real, as it appears at the same sky location in each observation, even though the observations were made at very different roll angles (see Table 1). This rules out instrumental artifacts, such as PSF asymmetries, which would move with the roll angle. Figure 2 also shows the profile of three slices through the point source. Although the point source is piled up, resulting in lost counts on axis, a clear extension is seen 16′′ off axis in two of the slices. The third, which avoids the extension, is shown for comparison. Furthermore, there is some evidence for a SW extension oppositely directed along slice 1. Neither feature is aligned with the ACIS readout streak or dispersed grating spectra in any of the observations.
It is not clear whether the NE extension is connected to the point source or not. Apparent in the image is a “bridge” of emission stretching from the NE extension toward the point source. The two slices suggest that this bridge could simply be the scattering halo, which shows modest azimuthal variations at most radii. However, if this bridge is associated with the extension, then there is evidence of substructure, since it appears brighter around the periphery with relatively weak emission in the center.
Finally, the milliarcsecond scale radio jets are almost north-south aligned, with PA=175∘ (Mioduszewski et al., 2001), nearly, but not quite, perpendicular to the X-ray extension.
2.2 Spectra
In order to search for any connection between the point source emission and that of the NE extension, we extracted grating spectra of the point source and CCD spectra of the extension from all four observations. This allowed us to look for correlated time variability and spectral similarities. For the extended emission, we used segments of annuli taken at the same radial distance from the point source for source and background regions. Table 2 lists rates, fluxes, and spectral parameters from fits to absorbed black body and power law models. For the point source, which has strong, variable lines from the stellar wind (Paerels et al., 2000), we included the six or seven most prominent lines as required for each observation in order to achieve an acceptable chi-squared. Good fits were achieved with both models. The resulting values gave no preference between the two, except for the core source in observations 425 and 426 where a black body was somewhat preferred.
Within each observation, the extension flux was consistent with a constant. The flux was also unchanged between observations 425 and 426, which were separated by two days. We therefore have no evidence of variability on less than day times. However, the point source and scattering halo did brighten by a factor of seven between observations 1456b and 425 (separated by four months), while the extension count rate only increased by about a factor of 2.5. This implies that the emission is not simply reprocessed/scattered point source flux (see §3). In any event, given the apparent size (0.8 lyr) of the extended region, it is somewhat surprising to observe such strong variability in just four months. This hints that there may be significant underlying substructure. Unfortunately, because of limited statistics, we cannot determine if the extension spectrum changed, although the 1999 spectra are marginally harder than those in 2000.
3 Discussion
Any model of the extended emission must explain the observed morphology, time variability, luminosity, and spectrum. We consider several possible origins: scattering in a non-axisymmetric dust halo, a coincidental alignment of an unrelated source, reflection from the companion’s stellar wind, bremsstrahlung from the disk wind, and collision of historical jets with the ISM.
One possibility is that a non-uniform distribution of dust around the line of sight could result in enhanced, asymmetric halo emission. In this case, the spectrum and flux should follow closely the point source spectrum with only a short (days) delay. However, the extension flux varied only by a factor of 2.5 over the observations, while the point source and the bulk of the halo varied by a factor of seven. Also, the black body temperature of the point source and extension in ObsID 425 (when Cyg X–3 had been bright for weeks) are significantly different (see Table 2). These facts argue that scattering halo asymmetries are not the cause of the extension.
We also considered the possibility that the source is unrelated to Cyg X–3. However, the fact that it is both extended and variable on month timescales rules out any extra-galactic object. The only remaining possibilities are supernova remnants, pulsar wind nebulae, and microquasar jets. Supernova remnants are ruled out by the time variability. The lack of a radio counterpart and the low number density of pulsar nebulae (only about 25 are known; Helfand, 1998) make this possibility unlikely, P. Finally any microquasar jets would certainly be associated with Cyg X–3. We therefore think it very unlikely that this is a coincidental alignment.
The emission may be flux from the point source scattered by the integrated Wolf-Rayet wind well outside the binary system. However, if the wind is persistent, then the outer regions of the disk wind should be shielded by the denser inner regions. This would result in a morphology dominated by flux close to the system, very different from what we observe.
However, the Wolf-Rayet wind may still cause the extension via Bremsstrahlung at its interface with the ISM. Ogley et al. (2001) used Infrared Space Observatory observations to infer a mass loss rate, which for disk-like wind geometries subtending 1.2 sr, could be as high as . Such a disk wind in the plane of the binary orbit was suggested by Fender et al. (1999) to explain variations in the infrared spectrum and orbital modulation of V(iolet)/R(ed). Furthermore, Martí et al. (2001) hypothesize that a disk wind inclined to the radio jet axis could obscure one side of the base of a double jet. This could cause the jet to appear one-sided on milliarcsecond scales and two-sided on larger scales, as is observed. With a terminal velocity of 1500 km s-1 (van Kerkwijk, 1993), such a wind would require about 500 years to reach the observed 18′′ extent of the X-ray emission. This would effectively be a minimum age for the observed extension. A Bremsstrahlung fit to the ObsID 425 spectrum gives an electron temperature of keV. The other observations were poorly constrained, but consistent with ObsID 425. With this temperature, and assuming a volume corresponding to a 5′′ diameter sphere, the data imply an electron density of a few hundred per cubic centimeter. While this is much higher than even the densest disk winds at a radius of 2.5 lyr, if the wind is plowing into the ISM and stopping, then the pertinent quantity is the time integrated wind density. Taking the above disk wind parameters and assuming the wind is fully ionized, it would require only about 2,000 years to build up the necessary electron density. Time variability would result from (historical) changes in the wind intensity that would heat the accumulated material to a greater or lesser degree. This picture is our most consistent explanation for the observations.
The emission might also be the result of material from an earlier jet ejection colliding with the ISM. In this case the X-rays would most likely be from synchrotron emission, as appears to be the case for the X-ray jets in XTE J1550-564 (Tomsick et al., 2003). This picture would account for the possible limb brightening of the extension, as the bulk of the emission would be expected at the jet/ISM interface. However, this scenario would require that the jet direction has precessed through a very large angle, since the observed radio jets are aligned close to the north-south direction. Furthermore, the transverse extent of the X-ray structure requires that the jet was either poorly collimated or exhibited significant change in direction during the emission period. This is significantly different from XTE J1550-564 where the jets are collimated to 2∘(Corbel et al., 2002). We note that the morphology expected from jet emission, a conical feature emanating from the core, should be easily distinguished from the elliptical shape expected from the disk wind model. We have recently made a Chandra High Resolution Camera observation to try to distinguish these possibilities.
Finally, we note that the microquasars SS433, LS I 61∘303, and possibly Cyg X-1 have extended radio emission around their cores perpendicular to their jet axes (Paragi et al., 1999; Massi et al., 2001; Stirling et al., 1998; Spencer et al., 2001). While these features are on much smaller (AU) scales, it is suggested that they are related to disk-like winds in the binary orbital plane. This suggests that the extended X-ray regions may be visible as radio sources, and deep searches should be carried out.
References
- Corbel et al. (2002) Corbel, S., Fender, R. P., Tzioumis, A. K., Tomsick, J. A., Orosz, J. A., Miller, J. M., Wijnands, R., and Kaaret, P.: 2002, Science 298, 196
- Dickey (1983) Dickey, J. M.: 1983, ApJ 273, 71
- Distefano et al. (2002) Distefano, C., Guetta, D., Waxman, E., and Levinson, A.: 2002, ApJ 575, 378
- Fender et al. (1999) Fender, R. P., Hanson, M. M., and Pooley, G. G.: 1999, MNRAS 308, 473
- Geldzahler et al. (1983) Geldzahler, B. J., Johnston, K. J., Spencer, J. H., Klepczynski, W. J., Josties, F. J., Angerhofer, P. E., Florkowski, D. R., McCarthy, D. D., Matsakis, D. N., and Hjellming, R. M.: 1983, ApJ 273, L65
- Helfand (1998) Helfand, D. J.: 1998, Memorie della Societa Astronomica Italiana 69, 791
- Martí et al. (2001) Martí, J., Paredes, J. M., and Peracaula, M.: 2001, A&A 375, 476
- Massi et al. (2001) Massi, M., Ribó, M., Paredes, J. M., Peracaula, M., and Estalella, R.: 2001, A&A 376, 217
- Mioduszewski et al. (2001) Mioduszewski, A. J., Rupen, M. P., Hjellming, R. M., Pooley, G. G., and Waltman, E. B.: 2001, ApJ 553, 766
- Ogley et al. (2001) Ogley, R. N., Bell Burnell, S. J., and Fender, R. P.: 2001, MNRAS 322, 177
- Paerels et al. (2000) Paerels, F., Cottam, J., Sako, M., Liedahl, D. A., Brinkman, A. C., van der Meer, R. L. J., Kaastra, J. S., and Predehl, P.: 2000, ApJ 533, L135
- Paragi et al. (1999) Paragi, Z., Vermeulen, R. C., Fejes, I., Schilizzi, R. T., Spencer, R. E., and Stirling, A. M.: 1999, A&A 348, 910
- Predehl et al. (2000) Predehl, P., Burwitz, V., Paerels, F., and Trümper, J.: 2000, A&A 357, L25
- Spencer et al. (2001) Spencer, R., de La Force, C., Stirling, A., Garrett, M., Fender, R., and Ogley, R.: 2001, Astrophysics and Space Science Supplement 276, 255
- Stirling et al. (1998) Stirling, A., Spencer, R., and Garrett, M.: 1998, New Astronomy Review 42, 657
- Tomsick et al. (2003) Tomsick, J. A., Corbel, S., Fender, R., Miller, J. M., Orosz, J. A., Tzioumis, T., Wijnands, R., and Kaaret, P.: 2003, ApJ 582, 933
- van Kerkwijk (1993) van Kerkwijk, M. H.: 1993, A&A 276, L9
| Exposure | Roll Angle | ASM Rate000RXTE/ASM average rate (2–10 keV) on the date of observation. | ||
| ObsID000Observation Identification | Date 000UT at mid-point of observation. | (ks) | (deg) | (cps) |
| 1011456a000ObsID 1456 was split in two “observation intervals” with different roll angles which we designate 1456a and 1456b separated by two months. ObsID 101 was contiguous with 1456a and we analyzed their spectra jointly. | 1999 Oct 20.1 | 212 | 269 | 9.1 |
| 1456b | 1999 Dec 19.3 | 8.4 | 322 | 6.9 |
| 425 | 2000 Apr 4.7 | 16 | 78 | 23 |
| 426 | 2000 Apr 6.9 | 14 | 81 | 18 |
| ObsID | NE Extension | Core | |||
|---|---|---|---|---|---|
| Black Body | Power Law | Black Body | Power Law | ||
| 1011456a | |||||
| Rate000NE extension: HETG order 0. Point source: HEG+1. counts/s | |||||
| NH | |||||
| kT (keV)/ | |||||
| Flux 000unabsorbed, , 2–10 keV | |||||
| /dof | 0.71/64 | 0.70/64 | 0.84/2042 | 0.85/2042 | |
| 1456b | |||||
| Rate | |||||
| NH | |||||
| kT (keV)/ | |||||
| Flux | |||||
| /dof | 0.96/25 | 0.95/25 | 0.89/1013 | 0.91/1013 | |
| 425 | |||||
| Rate | |||||
| NH | |||||
| kT (keV)/ | |||||
| Flux | |||||
| /dof | 1.24/23 | 1.3/23 | 1.33/3828 | 1.67/3828 | |
| 426 | |||||
| Rate | |||||
| NH | |||||
| kT (keV)/ | |||||
| Flux | |||||
| /dof | 1.27/16 | 1.28/16 | 1.12/3068 | 1.34/3068 | |