Slow temperature equilibration behind the shock front of SN 1006
Abstract
We report on the observation of O VII Doppler line broadening in a compact knot at the edge of SN 1006 detected with the Reflective Grating Spectrometer on board XMM-Newton. The observed line width of eV at a line energy of 574 eV indicates an oxygen temperature of keV. Combined with the observed electron temperature of keV the observed broadening is direct evidence for temperature non-equilibration in high Mach number shocks, and slow subsequent equilibration. The O VII line emission allows an accurate determination of the ionization state of the plasma, which is characterized by a relatively high forbidden line contribution, indicating .
1 Introduction
It has been suspected for many years that the high Mach number, collisionless shocks of young supernova remnants (SNRs) do not produce electron-ion temperature equilibration. The Rankine-Hugoniot relations require that for very high Mach numbers the temperature for each particle species :
| (1) |
with the particle mass, the shock velocity, and the ratio of specific heats, usually taken to be (e.g. McKee & Hollenbach, 1980). The heating process in collisionless shocks is not well understood, but the Coulomb collision times are too long to provide the required heating. So other, collective, processes should be responsible for the heating. This raises the question whether the heating process leads to temperature equilibration or not, i.e. is the electron temperature very low compared to the proton temperature, which, according to (1), should be lower than the oxygen or iron temperature? If temperatures are not equilibrated at the shock front, and subsequent equilibration proceeds through Coulomb interactions, full equilibration takes s (see Itoh, 1984).
A clear hint for non-equilibration is the low electron temperature in young SNRs, which in no object seem to exceed 5 keV, whereas a typical shock velocity of km/s should give rise to a mean plasma temperature of 19 keV (e.g. McKee & Hollenbach, 1980; Hughes et al., 2000). X-ray observations usually allow only the electron temperature to be determined from the continuum shape and line ratios. The ion temperature is difficult to measure, as it does not alter the continuum shape, and hardly influences the ionization and excitation balance.
Some measurements of temperature non-equilibration based on optical and UV spectroscopy have been reported. The shock velocity and amount of electron-proton equilibration can be determined from the line widths and ratio of H and H emission from non-radiative shocks. For the northwestern shock front in SN 1006, which is also the subject of this letter, Ghavamian et al. (2002) measured a shock velocity from the H width of km/s and inferred an electron to proton temperature ratio . Together with the measured proper motion Winkler et al. (2003) were able to determine a distance to SN 1006 of kpc. UV spectra obtained with the Hopkins Ultraviolet Telescope showed broad C IV, N V and O VI lines, indicating temperature non-equilibration of these elements (Raymond et al., 1995), and a comparison of these line intensities with He II allowed a measurement of (Laming et al., 1996). X-ray observations of SN 1006 indicate a low value of typically (Vink et al., 2000; Dyer et al., 2001), implying that if the equilibration is governed by Coulomb interactions, the plasma did not have sufficient time to equilibrate.
Here we report on a direct X-ray measurement of the O VII temperature in the northwest of SN 1006. It confirms with a high statistical confidence the slow equilibration of electron and ion temperature, but for a position further downstream from the shock than for the optical and UV measurements.
2 Observations and methods
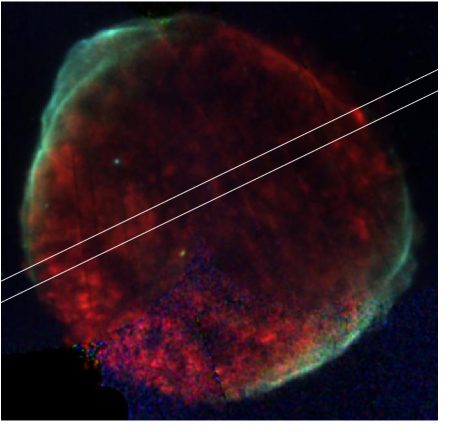
We observed SN 1006 (G327.6+14.6) with the XMM-Newton X-ray observatory (Jansen et al., 2001) with the goal of measuring the ionization and equilibration in SN 1006. The two observations are part of the guest observer program and were made on August 10 and 11, 2001. One observation pointed on the bright knot in the northwest, the main topic of this letter, the other on the narrow filaments in the east of SN 1006. The exposure times varied per instrument, but were close to 60 ks for both observations. In order to produce Fig. 1 we also used additional archival XMM-Newton and Chandra data.
Our main result is obtained with the Reflective Grating Spectrometer (RGS, den Herder et al., 2001). The two RGS instruments, RGS1 and RGS2 cover the wavelength range of Å, with a first order resolution of at 20 Å. Emissions from different orders are separated using the intrinsic energy resolution of the CCDs. Unfortunately one CCD chip on the RGS1 and one on the RGS2 no longer function. As a result the RGS1 spectrum does not cover the wavelength range encompassing Ne line emission, and the RGS2 does not cover the wavelength range around 22 Å, which contains the O VII He line emission. We limited the extraction region to an 1′ wide strip across the bright northwestern knot.
![[Uncaptioned image]](/html/astro-ph/0303051/assets/x3.png)
EPIC-CCD spectra of the bright knot in the northwest of SN 1006. The solid line is the best fit single NEI model (see Table 1). The top spectrum is the EPIC-PN (x5), the bottom spectrum is the combined EPIC-MOS spectrum.
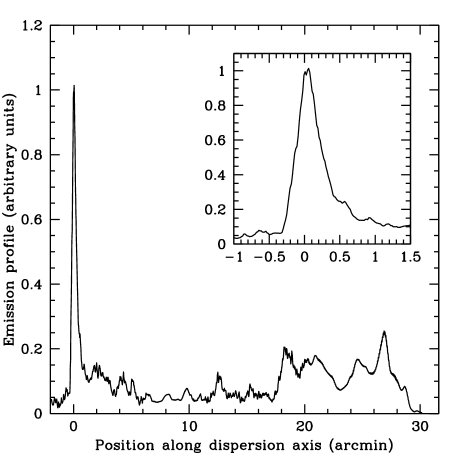
The extended emission from SN 1006 means that the standard response matrices had to be convolved with the spatial emission profile displayed in Fig. 1, with an attenuation due to off-axis telescope vignetting. The bright knot has a spatial width of 0.4′ (FWHM), which gives an apparent spectral broadening of (FWHM), or at 21.6 Å. The intrinsic resolution of the RGS is Å(den Herder et al., 2001). As the knot is compact and close to the edge of SN 1006 it is unlikely that any measurable broadening is due to bulk motions along the line of sight.
XMM-Newton also has CCD cameras behind each of its three mirrors, called the European Photon Imaging Camera (EPIC). We use the spectra extracted from the EPIC data to measure the electron temperature and abundances. All standard data reductions and response matrix calculations were done with SAS 5.3.3. Background spectra for the EPIC data were taken from a region outside SN 1006, but close to the center of the field. As RGS background spectra we used archival data of targets with no apparent line emission, such as gamma ray bursts.
3 The electron and ion temperatures in the northwest of SN 1006
The measurement of the non-equilibration of the electron and ion temperatures requires the measurement of both the ion temperature, here oxygen temperature, and the electron temperature.
The electron temperature is in this case most accurately measured from the spectral continuum shaped observed with the EPIC CCD spectra, as the low ionization time scales in SN 1006 make the available line ratios only weakly temperature dependent. The EPIC spectra from the northwestern knot were fitted with the SPEX non-equilibration ionization (NEI) code (Kaastra et al., 1996). As the knot is relatively compact, temperature and ionization gradients are probably of minor importance. The plasma parameters obtained by fitting the spectra indicate , and keV, higher than the 0.7 keV reported by Long et al. (2003) based on Chandra data. Note, however, that the Chandra spectra have a lower spectral resolution, and have currently more calibration problems. Moreover, as there are two different kind of EPIC instruments, we were able to verify the consistency of the results (Fig. 2). Nevertheless, the measured is substantially lower than the keV expected for a fully equilibrated plasma, but still higher than that expected from Coulomb equilibration alone behind a 3000 km/s shock. Fig. 3 shows the predicted against for current observations of the SN 1006 knot, as well as the various ion temperatures. Our fitted corresponds to plasma shocked 200-300 years ago, which is predicted to have eV. Hence we infer a small degree of collisionless electron heating (around 5% of the shock energy, i.e. , see Ghavamian et al. (2001)) consistent with optical and UV observations (Ghavamian et al., 2002; Laming et al., 1996) of SN 1006 and with observations of high Mach number shocks in other supernova remnants such as Tycho (Ghavamian et al., 2001) and SN 1987A (Michael et al., 2002).
![[Uncaptioned image]](/html/astro-ph/0303051/assets/x4.png)
The spectra are dominated by line emission from O VII, the other line complexes are, however, not from helium-like stages of Ne, Mg and Si, as identified by Long et al. (2003), but from lower ionization stages. For instance the EPIC spectra show consistently that the Mg line centroid is keV, whereas the Mg XI line centroid is keV. The Si line centroid is keV, which differs significantly from the Si XIII centroid of 1.85 keV. Instead these centroids indicate ionization stages around Mg IX and Si IX. The Ne centroid, as determined from the RGS2 spectrum, indicates keV, consistent with Ne VII. These centroids provide clear evidence for extreme NEI conditions for the northwestern knot and corroborate the measured value.
![[Uncaptioned image]](/html/astro-ph/0303051/assets/x5.png)
In agreement with Long et al. (2003) we find that the knot emission indicates an overabundance of Si, but contrary to the Chandra data we do find O, Ne and Mg to be somewhat underabundant (Table 1). This may indicate that instead of shocked ISM the knot is actually ejecta or ISM mixed with ejecta. This does not diminish the evidence for temperature non-equilibration, but it makes it harder to combine the results reported here with the H shock velocity measurements.


The RGS1 spectrum (Fig. 2) shows that the emission around 0.66 keV is dominated by O VII He emission (O VIII Ly O VII He). Ne is detected in the RGS2 spectrum, but Mg and Si are too weak for the RGS instruments. No evidence for Fe XVII line emission is seen at 15.01 Å, 16.78 Å, 17.0 Å, or 17.10 Å, presumably because Fe has not yet reached the Fe XVII charge state. The O VII emission is well described by , line ratios that scale with the ratios of the oscillator strengths, as is expected for keV.
In order to measure the ion temperature through the thermal Doppler broadening we fitted the RGS1 spectrum in the range from Å, dominated by oxygen line emission, with six absorbed gaussians and a bremsstrahlung continuum with keV fixed to the continuum outside the fitted range ( cm-2, Dubner et al., 2002). The six gaussian components had centroids fixed at the energies of the bright O V, O VI, and O VII lines. The ratios of those lines were fixed according to calculations with the FAC atomic code (Gu, 2002), for keV and a grid of values between . The line broadening was taken to be proportional to the line energies. Spectral fitting was done with spectral fitting package xspec (Arnaud, 1996). This allowed us to use the C-statistic, which is the maximum likelihood statistic appropriate for Poisson noise (Cash, 1979).
The best fits corresponded to with a maximum likelihood statistic of for 104 data bins, with a possible range of . This is somewhat lower, but arguably more accurate, than the value derived from the CCD spectra. It is also consistent with the measured oxygen Ly to He ratio with the RGS. For higher value of the emission would be much more dominated by the O VII resonance line at 21.6 Å, whereas the RGS1 spectrum indicates a substantial contribution of forbidden line emission at 22.1 Å due to O VI inner shell ionization and excitation.
The line broadening needed to obtain an acceptable fit is eV (68% confidence), if fitted within the wavelength range 21.4-22.6 Å. As Fig. 2 shows the broadening underpredicts the wing of the resonance line between 21.0-21.4 Å, which is a possible indication that the oxygen ions may not be completely thermalized (i.e. are not fully described by a Maxwellian distribution). The statistical confidence of the detection of line broadening is at the level (). The 99.73% (3) confidence range is eV. Even if we do not fix the line ratios and optimize each individual line, we obtain eV with a statistical confidence still at the level. During our analysis we have compared different methods of analyzing the data, with various wavelength fitting ranges. This has given us some feeling of the systematic uncertainties involved. We estimate that the systematic error on is about 0.7 eV.
4 Discussion
Our analysis of CCD and grating data of a bright knot in SN 1006 obtained by XMM-Newton shows that keV and The Doppler broadening at 574 eV is eV, which corresponds to an oxygen temperature of keV (e.g. eq. 10.69 Rybicki & Lightman, 1979). This indicates a shock velocity of km/s, if no significant temperature equilibration has taken place, but allowing for the possibility of some adiabatic cooling (eq. 1). The implied shock velocity is higher than the km/s indicated by recent H measurements (Ghavamian et al., 2002), but given the systematic errors both measurements agree.
The excess emission in the wings of the O VII line emission, although possibly due to calibration uncertainties concerning the wings of the intrinsic RGS line profiles, may also be real and caused by a lack of complete oxygen thermalization. This is not unexpected as the oxygen self equilibration time at high temperatures is comparable to the oxygen-proton equilibration time.
To conclude, the measured high oxygen ion temperature is a clear indication that the shock heating processes resulted in only a small degree (5%) of electron-ion equilibration at the shock front, and that the subsequent equilibration process is slow. This also has some bearing on the acceleration of cosmic rays in high Mach number shocks, which are thought to be injected into the shock acceleration process from the pool of the thermal gas behind the shock front. A low electron-ion equilibration will make it relatively more difficult for electrons than for ions to be accelerated. However, the southwestern and northeastern limbs of SN 1006 are a prime examples of efficient electron acceleration as the X-ray emission from these parts is dominated by synchrotron emission (Koyama et al., 1995). Although we could not directly measure the electron temperature at those sites, the electron temperature close to the northwestern limb seems to be similar to that of northeastern knot. However, the notion of a thermal pool from which particles are accelerated is likely to be too simple, as recent simulations seem to indicate (Schmitz et al., 2002).
References
- Anders & Grevesse (1989) Anders, E. & Grevesse, N. 1989, Geochim. Cosmochim. Acta, 53, 197
- Arnaud (1996) Arnaud, K. A. 1996, in ASP Conf. Ser. 101: Astronomical Data Analysis Software and Systems V, Vol. 5, 17
- Cash (1979) Cash, W. 1979, ApJ, 228, 939
- den Herder et al. (2001) den Herder, J. W. et al. 2001, A&A, 365, L7
- Dubner et al. (2002) Dubner, G. M., Giacani, E. B., Goss, W. M., Green, A. J., & Nyman, L.-Å. 2002, A&A, 387, 1047
- Dyer et al. (2001) Dyer, K. K., Reynolds, S. P., Borkowski, K. J., Allen, G. E., & Petre, R. 2001, ApJ, 551, 439
- Ghavamian et al. (2001) Ghavamian, P., Raymond, J., Smith, R. C., & Hartigan, P. 2001, ApJ, 547, 995
- Ghavamian et al. (2002) Ghavamian, P., Winkler, P. F., Raymond, J. C., & Long, K. S. 2002, ApJ, 572, 888
- Gu (2002) Gu, M. F. 2002, ApJ, 579, L103
- Hughes et al. (2000) Hughes, J. P., Rakowski, C. E., & Decourchelle, A. 2000, ApJ, 543, L61
- Itoh (1984) Itoh, H. 1984, ApJ, 285, 601
- Jansen et al. (2001) Jansen, F. et al. 2001, A&A, 365, L1
- Kaastra et al. (1996) Kaastra, J. S., Mewe, R., & Nieuwenhuijzen, H. 1996, in Proc. of the 11th Coll. on UV and X-ray, UV and X-ray Spectroscopy of Astrophysical and Laboratory Plasmas, ed. K. Yamashita & T. Watanabe (Tokyo:Universal Academy Press), 411
- Koyama et al. (1995) Koyama, K., Petre, R., Gotthelf, E. V., Hwang, U., Matsuura, M., Ozaki, M., & Holt, S. S. 1995, Nature, 378, 255
- Laming (2001) Laming, J. M. 2001, ApJ, 563, 828
- Laming et al. (1996) Laming, J. M., Raymond, J. C., McLaughlin, B. M., & Blair, W. P. 1996, ApJ, 472, 267
- Long et al. (2003) Long, K. S., Reynolds, S. P., Raymond, J. C., Winkler, P. F., Dyer, K. K., & Petre, R. 2003, ApJ, in press
- McKee & Hollenbach (1980) McKee, C. F. & Hollenbach, D. J. 1980, ARA&A, 18, 219
- Michael et al. (2002) Michael, E., Zhekov, S., McCray, R., Hwang, U., Burrows, D. N., Park, S., Garmire, G. P., Holt, S. S., & Hasinger, G. 2002, ApJ, 574, 166
- Raymond et al. (1995) Raymond, J. C., Blair, W. P., & Long, K. S. 1995, ApJ, 454, L31
- Rybicki & Lightman (1979) Rybicki, G. B. & Lightman, A. P. 1979, Radiative processes in astrophysics (New York, Wiley-Interscience, 1979. 393 p.)
- Schmitz et al. (2002) Schmitz, H., Chapman, S. C., & Dendy, R. O. 2002, ApJ, 570, 637
- Truelove & McKee (1999) Truelove, J. K. & McKee, C. F. 1999, ApJS, 120, 299
- Vink et al. (2000) Vink, J., Kaastra, J. S., Bleeker, J. A. M., & Preite-Martinez, A. 2000, A&A, 354, 931
- Winkler et al. (2003) Winkler, P. F., Gupta, G., & Long, K. S. 2003, ApJ, submitted, (astroph/0208415)