11email: vladilo@ts.astro.it
Ar i as a tracer of ionization evolution††thanks: Based on observations made with the ESO 8.2 m Kueyen telescope operated on Paranal Observatory, (Chile). ESO programmes 65.O-0299, 66.A-0594(A), and 69.A-0299
We present a study of Ar abundances in 15 damped Ly systems (DLAs) in the redshift interval . The sample includes 4 UVES/VLT measurements of Ar i column densities presented here for the first time, together with 6 measurements and 5 upper/lower limits collected from the literature (UVES/VLT and HIRES/Keck observations). The majority of DLAs show significant underabundances of Ar relative to other -capture elements with common nucleosynthetic origin. We show that neither dust depletion nor intervening H ii regions inside DLAs offer a viable justification to these underabundances. A natural explanation is found in the framework of photoionization models of H i regions embedded in an ionizing continuum with varying spectral distribution. At the observed Ar deficiencies are large, [Ar/] dex, suggestive of a hard, QSO-dominated spectrum. At the deficiencies are instead small, suggestive of a soft, stellar-type spectrum, though more data are needed to generalize this high- result. Should the change of Ar abundances with redshift be governed by the evolution of the UV stellar emission internal to DLAs, a synchronization of the star formation in DLAs would be required, with a strong stellar emission at , but weak at . This variation seems inconsistent with the weak signal of evolution indicated by abundance studies of DLAs. More likely, the change of Ar abundances is induced by the evolution of the UV metagalactic continuum, in which case the UV emission internal to DLAs must be small (i.e. DLAs should have modest star formation rates) and the external background must become softer at . The former requirement is consistent with the modest evolution of DLAs abundances and the lack of Ly and H emissions associated with DLAs. The latter requirement is consistent with the observed evolution of Si iv/C iv ratios in the IGM, the claims of high escape fraction of UV photons from Ly-break galaxies at , and the recent finding that the He ii re-ionization seems to occur between and . Comparison with results from local interstellar studies indicates that Ar abundances can be used to trace the evolution of the ionization history of the universe down to , where [Ar/] dex. We predict a rise of Ar abundances in the redshift range from to , at the epoch at which the metagalactic field of galaxies overcomes that of quasars.
Key Words.:
Diffuse radiation – Intergalactic medium – Ultraviolet: galaxies – Cosmology: observations – Quasars: absorption lines – Quasars: individual (PKS 0528–250, Q0841+129, Q2343+1232)| QSO | log (H i) | log (Ar i) | [Ar/O] | [Ar/S] | [Ar/Si] | References | ||
| 0528-2505 | 2.812 | 21.110.04 | 14.250.01 | 0.550.02 | 0.630.04 | This work; Péroux et al. (2003) | ||
| 0841+129 | 2.375 | 21.000.10 | 13.460.10 | 0.700.10 | 0.740.10 | This work; Centurión et al.(2003) | ||
| 0841+129 | 2.476 | 20.790.10 | 13.340.12 | 0.570.12 | 0.550.14 | This work; Centurión et al.(2003) | ||
| 2343+1232 | 2.431 | 20.180.05c | 13.220.05c | 0.780.05c | 0.840.05c | — | This work; D’Odorico et al.(2002) | |
| 0000-263 | 3.390 | 21.410.08 | 14.020.03 | 0.030.03 | +0.000.04 | +0.000.04 | Molaro et al.(2000,2001) | |
| 0201+365 | 2.462 | 20.380.05 | 14.080.03 | 0.530.03 | 0.420.03 | Prochaska et al.(2002a) | ||
| 0347-383 | 3.025 | 20.630.01 | 13.990.02 | 0.430.02 | 0.210.02 | Levshakov et al.(2002) | ||
| 0741+4741 | 3.017 | 20.480.10 | 13.130.02 | 0.180.02 | — | Prochaska et al.(2002a) | ||
| 1759+7539 | 2.626 | 20.610.01c | 13.680.03c | 0.710.13c | 0.680.04c | — | Prochaska et al.(2002b) | |
| 22436031 | 2.330 | 20.240.02c | 13.350.05c | 0.590.04c | 0.540.04c | López et al.(2002) | ||
| 0001 | 3.000 | 20.700.05 | 13.38 | 0.16 | 0.03 | Prochaska et al.(2002a) | ||
| 0336-0142 | 3.062 | 21.200.10 | 13.94 | 0.37 | Prochaska et al.(2002a) | |||
| 0930+2858 | 3.235 | 20.300.10 | 12.96 | +0.11 | Prochaska et al.(2002a) | |||
| 1426+6039 | 2.827 | 20.300.04 | 13.43 | 0.36 | Prochaska et al.(2002a) | |||
| 2344+12 | 2.538 | 20.360.10 | 13.26 | +0.12 | Prochaska et al.(2002a) |
a Column densities are expressed in atoms cm-2.
b Additive dust correction term for [Ar/Si] estimated using the set of
parameters S11(Vladilo 2002) and assuming zero dust depletion for Ar.
c
Sum of velocity components observed in Ar i;
the fraction of (Si ii) measured in such components
over total (Si ii) has been used to scale down
the total ;
components 6 and 7 in Prochaska et al. (2002b) have been considered
for the DLA in Q1759+7539;
components 3, 4 and 11 in López et al. (2002)
for the DLA in Q22436031.
1 Introduction
The abundance of argon in diffuse gas can be measured from absorption line spectroscopy of the Ar i 104.8 and 106.6 nm resonance transitions. Early Copernicus observations indicated that argon is moderately depleted in the local interstellar gas (Meyer 1989 and refs. therein), a result confirmed by recent IMAPS (Sofia & Jenkins 1998; hereafter SJ98) and FUSE (Jenkins et al. 2000; Lehner et al. 2002) observations. Interstellar depletions are generally attributed to the incorporation of atoms into dust grains and tend to be correlated with the gas column density (Jenkins 1987; Savage & Sembach 1996). It is hard to establish whether such a correlation, suggestive of dust, exists or not for Ar because Ar i lines saturate when atoms cm-2 at the solar metallicity characteristic of the local interstellar gas. In fact, SJ98 provided theoretical arguments to show that Ar depletion is unlikely due to dust since Ar atoms have a low probability of being incorporated into dust grains. The Ar deficiency is most likely due to ionization effects since the ratio between photoionization and recombination rates is typically one order of magnitude larger for Ar i than for H i (Fig. 3 in SJ98). Owing to this property, Lyman continuum photons with eV, the Ar i ionization threshold, will be extremely efficient in ionizing Ar i but not H i, if they are able to leak through a H i layer. This characteristic of Ar can be used to probe ionization conditions not only in local interstellar clouds, but also in clouds of external galaxies. In particular, with high resolution spectroscopy of QSO sources we can study clouds in intervening galaxies detected as absorption line systems. Damped Ly systems (DLAs), are thought to arise in these intervening galaxies (Wolfe et al. 1995) and offer the possibility to probe ionization conditions at high redshift from the study of Ar abundances. At the Ar i lines can in fact be detected in the optical range, where the collecting power of 10-m class telescopes can be exploited to obtain high quality QSO spectra. Thanks to the low metallicity typical of DLAs (Pettini et al. 1999), the Ar resonance lines can be unsaturated even at the high column densities, cm-2, typical of these systems. Therefore, DLAs can yield information complementary to that obtained from studies of local ISM, where the Ar i lines become readily saturated. Most important, if Ar abundances in DLAs are indicative of ionization conditions, as they are in the local ISM, their study may yield important constraints on the nature and relative importance of ionizing sources at high redshift, a topic of particular interest in cosmology for its effects on the physical state of the intergalactic medium and for its link to the star formation history of the universe.
The first detection of Ar i in a DLA system was obtained for the absorber towards QSO 0000-26 observed with UVES/VLT (Molaro et al. 2001). The Ar abundance was found to match that of other -capture elements measured in the same system, suggesting a low degree of ionization of the gas. Recently a few other Ar i detections in DLAs have been obtained with UVES/VLT (Levshakov et al. 2002, López et al. 2002) and HIRES/Keck observations (Prochaska et al. 2002a,b). From these works there was no evidence for a general underabundance of Ar in DLAs, with the notable exception of the system towards QSO 1759+75, an absorber characterized by complex ionization conditions (Prochaska et al. 2002a).
From the theoretical point of view, the Ar ionization fractions in DLA systems have been estimated by several authors, assuming different models of radiation field and ionization structure of the absorbers (Izotov et al. 2001, Vladilo et al. 2001, Prochaska et al. 2002a). At variance with other metal species observed in DLAs, the fraction of Ar i is quite sensitive to the adopted model. This makes Ar i an important discriminant of ionization conditions in DLAs. Motivated by this possibility, we have actively searched for new Ar i detections in DLAs. In this paper we present and discuss the results of this search. The new measurements are described in Section 2, while in Section 3 we review the general properties of Ar abundances in DLAs combining these new data with previous measurements. We show that a significant underabundance of Ar is common among DLAs, contrary to previous belief, and we discuss this result in the framework of photoionization equilibrium models. In Section 4 we present evidence for redshift evolution of the Ar abundances in DLAs and we briefly summarize Ar interstellar abundances at . Finally, in Section 5 we discuss these findings in the framework of current evolution scenarios for DLAs and for the metagalactic radiation field. The results are summarized in Section 6.
2 The data
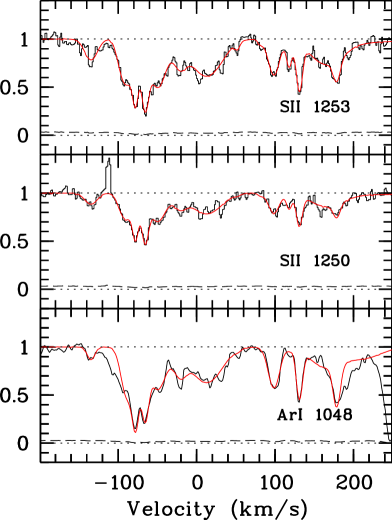
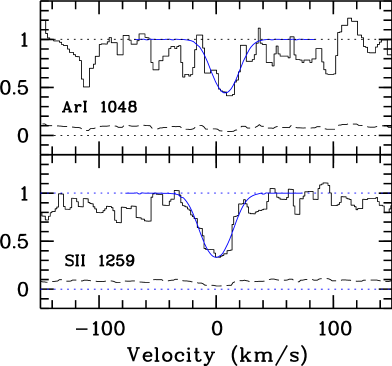
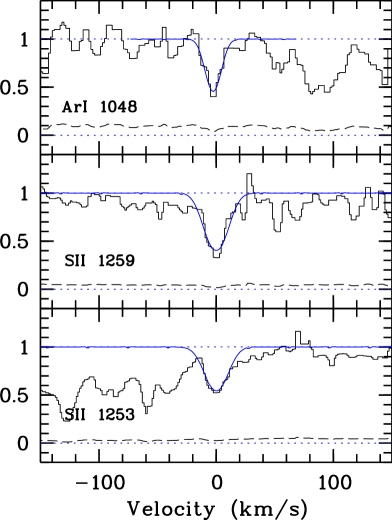
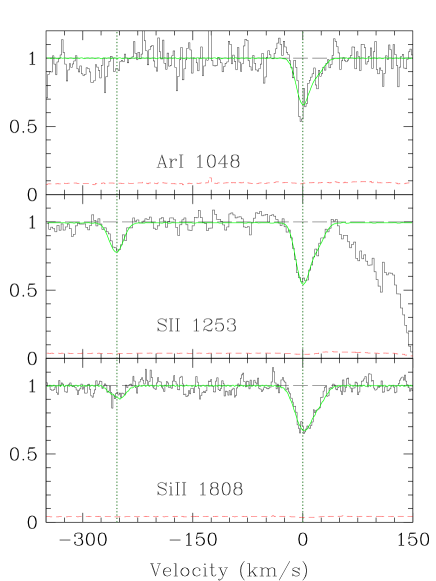
The observations were obtained with the Ultraviolet Visual Echelle Spectrograph (UVES) fed by the Kueyen telescope (unit 2 of the ESO VLT). This spectrograph is particularly well suited for observing the spectral region in the proximity of the ultraviolet atmospheric cutoff (Dekker et al. 2000) allowing the Ar i lines to be observed at redshifts . The slit widths were set to 1 arcsec, yielding a mean resolving power . The targets, the basic data for the DLAs investigated, and the new measurements of Ar i column densities, , are listed in the first 4 rows of Table 1. A full presentation of the data reduction is given in a parallel paper focussed on a study of nitrogen abundances in DLAs (Centurión et al. 2003). More details on UVES studies of the systems at in QSO 05282505 and in QSO 2343+1232 can be found in Péroux et al. (2003) and D’Odorico et al. (2002), respectively. The column densities have been derived with the Voigt-profile fitting routines FITLYMAN (Fontana & Ballester 1995) implemented in the MIDAS software package. The oscillator strength for the transition Ar i 104.8nm, , was taken from Federman et al. (1992), the same adopted for the local ISM by SJ98 and in previous work on DLAs by Molaro et al. (2001) and Levshakov et al. (2002). Oscillator strengths for other -capture elements were taken from Morton (1991), except for: Si ii 1304, 1526 (Spitzer & Fitzpatrick 1993) and Si ii 1808 (Bergeson & Lawler 1993).
The absorption profiles of Ar i lines are shown in Figs. 1, 2, 3, and 4. Care has been taken in assessing possible contamination of the Ar i profiles due to Ly interlopers, which would tend to increase (Ar i). Comparison with the radial velocity profiles of low-ionization species falling inside and outside the Ly forest has not revealed evidence of contamination. In the figures we show examples of the profiles of the S ii and/or Si ii lines used in the present analysis. The agreement with the radial velocity profiles of Ar i lines is generally excellent. A slight misalignment between the Ar i and S ii lines is only observed in the system in Q 0841+129. We have carefully checked that this is not due to an error in the wavelength calibration. Some weak contamination could be responsible for this shift, in which case the derived Ar column density could be slightly overestimated, probably within the large error bar of this measurement. This would not affect the conclusion that Ar is significantly underabundant in this system. Care has been taken in assessing systematic errors due to the uncertainty of the continuum, which are largest for the two DLAs in Q 0841+129 (Figs. 2 and 3). Even in these two cases the (Ar i) error bars are sufficiently large to encompass the continuum errors.
The 4 new measurements presented here represent a significant increase over the 6 (Ar i) measurements in DLAs previously obtained with UVES/VLT or HIRES/Keck observations, also shown in Table 1. When also upper and lower limits of are considered (last 5 rows of Table 1), the combined sample sums up to a total of 15 DLAs. Care has been taken in comparing the abundances derived by different authors. The value of the Ar i 104.8 nm line adopted by us is 2% smaller than the updated Morton (1991) value adopted by Jenkins et al. (2000) and Lehner et al. (2002) for ISM studies and by Prochaska et al. (2002a,b) for DLAs studies. The value is 5% larger than the old Morton (1991) value adopted by López et al. (2002). We did not attempt to correct for these differences, given the presence of some saturation in the lines. The differences are in all cases well within the measurement errors quoted by the authors.
For the sake of comparison with previous work, in Fig. 5 we plot the [Ar/Fe] versus [Fe/H] abundance ratios for the combined sample of DLA systems111 We follow the usual definition , where and indicate the dominant ionization state in H i regions for the elements X and Y, respectively. In this paper we adopt the meteoritic solar abundances of Grevesse & Sauval (1998), with the exception of O and Ar, taken from Holweger (2001) and SJ98, respectively. . The Ar/Fe ratio is likely to be affected by nucleosynthesis evolution, dust depletion and ionization effects. Disentangling these effects is extremely difficult, making the interpretation of the data shown in Fig. 5 quite uncertain. As we explain below, the ratio of Ar relative to -capture elements is best suited for casting light on ionization effects alone.

3 The Ar/ ratio in Damped Ly systems
In columns 5, 6, and 7 of Table 1 we give the Ar abundances normalized to those of O, S, and Si, representative of -capture elements measured in DLAs. Most of the systems have [Ar/O,Si,S] ratios below the solar value, with underabundances of about dex in several cases. Only the z=3.39 DLA towards Q0000-26 shows solar ratios. The [Ar/O,Si,S] ratios show therefore a significant scatter, with differences as high as 0.8 dex. All upper and lower limits are consistent with this range of values.
Because O, Si, S, and Ar are all -capture elements, the [Ar/O], [Ar/Si], and [Ar/S] ratios are expected to be only weakly dependent on the detailed chemical history undergone by each system. In fact, when at least two measurements of [Ar/O,Si,S] are available for a given absorber, one can see in Table 1 that the ratios are in good agreement between them. The only exception is the system in Q0347, for which O and Si abundances show a difference of 0.2 dex. However, we do not believe that nucleosynthesis is a likely source for explaining the significant underabundances found in the [Ar/O,Si,S] ratios. We now consider both dust and ionization effects as possible sources of these underabundances.
3.1 Dust depletion
The evidence that Ar is unlikely to be incorporated in dust is mostly based on theoretical arguments (SJ98). In fact, local interstellar measurements of are feasible only in low-column density lines of sight (), which are not expected to have a significant dust content. The Ar measurements in DLAs provide the possibility to test the existence of Ar dust depletion in high redshift galaxies, in a regime of higher H i column densities. We can estimate the dust content of individual DLAs making use of the [Zn/Fe] ratio, given the large differential depletion between Zn and Fe, well known from local ISM studies (Savage & Sembach 1996) and also supported from studies of DLAs (Pettini et al. 1994; Vladilo 1998; Prochaska & Wolfe 2002)222 This is true even if the nucleosynthesis of Zn is not well understood (see Prochaska & Wolfe 2002).. In Fig. 6 we plot [Ar/S] versus [Zn/Fe] for the subsample of Table 1 with available Fe and Zn data. Should Ar be incorporated into dust, we would expect the [Ar/S] ratio to become more and more underabundant with increasing [Zn/Fe], because S is known to be undepleted in the interstellar gas (Savage & Sembach 1996). However, this type of trend is not seen in Fig. 6. On the contrary, severe underabundances of Ar are present even when [Zn/Fe] is relatively small, i.e. when the amount of dust is negligible. This empirical test indicates that a mechanism different from dust depletion is responsible for the Ar underabundances in DLAs, lending support to the theoretical arguments given by SJ98.
Among the abundances reported in Table 1 only the [Ar/Si] ratio is possibly affected by dust depletion, given the fact that O and S are known to be undepleted from local ISM studies. In the penultimate column of Table 1 we give the amount of Si/Ar differential depletion expected for DLAs with available Zn data, estimated following the procedure of Vladilo (2002).


3.2 Ionization effects
Abundance measurements in DLAs are performed using dominant ionization states of metals in H i regions, which can be neutral (e.g. N i, O i, and Ar i) or singly ionized (e.g. Si ii, S ii, Fe ii, and Zn ii), depending on the ionization potential of each element. The predominance of such species in H i regions is well known from local ISM studies and can be easily explained in terms of photoionization equilibrium models of DLAs (Howk & Sembach 1999; Vladilo et al. 2001, hereafter V&01; Prochaska et al. 2002b). Ionization corrections for the abundances can be estimated, in the framework of these models, as a function of the intensity and spectrum of the adopted ionizing continuum. Unfortunately, singly ionized species can also arise in intervening H ii regions, if they happen to lie inside the Damped systems. We discuss models with and without an intervening H ii region.
3.2.1 Intervening H ii regions
The presence of intervening H ii gas in DLAs would yield an excess of ionized species, but not of neutrals. As a consequence, they would create an (apparent) underabundance of the Ar/Si and Ar/S ratios, derived by comparing Ar i with Si ii or S ii. On the other hand, the Ar/O ratios, derived from neutral species, are not expected to be altered by this effect. Therefore, if intervening H ii gas exists, we should find [Ar/Si,S] [Ar/O]. The only two [Ar/O] ratios in our sample do not support this possibility (see Table 1). Since this sample is too small — and does not include cases with significant Ar underabundances — we have also investigated the behaviour of the O i/Si ii ratio, for which 9 DLAs measurements exist, 2 of them shown in Table 1 and the others found in the literature (Prochaska & Wolfe 1999, Dessauges-Zavadsky et al. 2001, Pettini et al. 2002, Prochaska et al. 2002a). The resulting [O/Si] ratios are shown in Fig. 7. The mean value of this sample is dex. A few O i measurements are derived from partially saturated 130.2 nm lines, and in these cases the real [O/Si] ratio could be even higher. A little excess of [O/Si] may be expected due to differential dust depletion between the two elements (Savage & Sembach 1996). Only one system shows a modest underabundance which can be explained in the framework of the ionization balance of H i regions discussed below. The general lack of O/Si underabundance indicates that intervening H ii gas is uncommon in DLAs. On the basis of this result, DLA ionization models which consider intervening H ii regions as inherent to DLAs ionization structure, such as the models discussed by Izotov et al. (2001), are not considered hereafter.


3.2.2 Ionization balance of the H i region
Photoionization models can be constrained when two or more ionization states of the same element coexist and can be detected in H i regions. This is the case of Al ii and Al iii, the only species of intermediate ionization which can be easily measured in DLAs. In fact, Al iii shares a common velocity distribution — and, hence, a common location in the DLAs — with species of lower ionization (Wolfe & Prochaska 2000). General models of DLAs ionization should be able to explain the abundances of Al iii relative to Al ii and other ions. In a previous work, a trend of decreasing Al iii/Al ii ratio with increasing (H i) was found and used to constrain photoionization models (V&01). Two types of ionizing continuum were considered: (1) a hard, QSO-dominated radiation field (Haardt & Madau 1996; see also Howk & Sembach 1999) and (2) a soft, stellar type radiation field ( K; Kurucz 1991). In the first case (H1 model) the Al iii is produced by the hard photons, which are able to penetrate H i layer in depth. In the second case (S2 model) the Al iii originates in a partially ionized interface created by the soft radiation field, which is not able to penetrate the neutral gas in depth. Both types of models are able to reproduce the observed trend Al iii/Al ii versus (H i) with a proper choice of the ionization parameter, . For model H1, the requirement to fit the observed Al iii/Al ii versus (H i) trend implies that the ionization parameter must vary as . However, the model H1 cannot be computed at arbitrarily high values of (H i), owing to uncertainty in the thermal solution of the photoionization computations. For model S2 the trend Al iii/Al ii versus (H i) can be reproduced with a constant ionization parameter. We refer to V&01 for more details. After constraining the ionization parameter in such a way to match the Al iii/Al ii trend, the H1 and S2 models can be used to predict the behaviour of Ar/ ionic ratios as a function of (H i). In Figs. 8 and 9 we show the predictions for the Ar i/S ii and Ar i/Si ii ratios, respectively, derived with model H1 (dashed line) and S2 (dotted line), for a gas with solar abundance ratios. Both models predict that deviations from the solar value induced by ionization become less important with increasing (H i). The comparison of observations with model predictions in Figs. 8 and 9 yields the following results.
1. The [Ar/S] and [Ar/Si] ratios, when available for a given DLA, give consistent indications on the ionization conditions333 The individual DLAs in the figures can be recognized by means of their H i column density, given in Table 1. . For instance, both ratios of the system in QSO 0000-26 are in agreement with model S2. For the system in QSO 0201+365 the ratios yield consistent results, slightly above the H1 line, when the Ar/Si dust correction term is taken into account (Table 1; dust corrections are negligible in the other cases). The concordant indications obtained from different ratios, each one measured and modelled independently, indicates that the results are, at least, self consistent.
2. Only a few [Ar/S,Si] ratios lie in the proximity of the S2 curve, suggestive of a soft ionizing continuum. Most of the data lie instead below the S2 model, with several cases close to the H1 curve, suggestive of a hard continuum.
3. Even if the DLA with highest (H i) in our sample (the system in QSO 0000-26) does show negligible ionization effects, there is no evidence for the systematic decrease of ionization effects with increasing (H i) predicted by the models. The trend could be smeared out because different DLAs are embedded in different types of ionizing continuum, with one possible case of extremely intense continuum, as we mention in the next point.
4. The system in QSO 0528-25 is peculiar since its redshift is larger than the emission redshift of the QSO, . Most likely the system has a large, positive radial velocity and is very close to the QSO. In this case, the large [Ar/] underabundance at high observed in this system (open symbol in Figs. 8 and 9) could be due to the effect of a strong, QSO-type radiation field enhanced relative to the diffuse background. A detailed analysis of this DLA will be presented in a separate paper (Péroux et al. 2003).

4 Redshift evolution of Ar abundances
We now present evidence for redshift evolution of Ar abundances, based on measurements in DLAs in the range and on local ISM measurements, representative of the conditions at .
4.1 Ar abundances in DLAs
In Fig. 10 we show all [Ar/] measurements and limits given in Table 1 plotted versus . For the limits, we adopt the most stringent limit on [Ar/] available. For the measurements, we define [Ar/] as the mean value of available [Ar/O], [Ar/S], and [Ar/Si] data, with error bars obtained from error propagation of individual data. Only for the absorber in QSO 0347-38 the individual error bars are smaller than the difference between the [Ar/O] and [Ar/Si] measurements. In this case we adopt an error bar sufficiently large to encompass both measurements.
The [Ar/] ratios in Fig. 10 increase with redshift, from dex at to dex at . The trend is supported by all the 10 measurements and the 5 limits, four of which happen to be stringent. A linear regression of [Ar/] versus for the 10 measurements yields a slope at 99.92% confidence level (cl). If the system in Q 0528 is excluded, the linear regression yields at 99.94% cl. The trend versus is particularly remarkable given the lack of any trend versus as discussed above. This result strongly suggests that Ar abundances are subject to evolution, even if the sample is still small at to allow firm conclusions to be drawn. In favour of the existence of the trend, we note that the linear regression analysis still yields consistent results, i.e. at 98.91% cl, after excluding the data point at (8 measurements; system also excluded).
To our knowledge, the Ar/ ratio shows the strongest redshift variation of relative abundances found so far in DLAs. Ionic ratios predicted to be less affected by the ionization field do not show such variations. For instance, the Si/Fe ratio shows a nearly constant value, although with significant scatter, over the large redshift interval (Fig. 26 in Prochaska & Wolfe 2002). Once corrected for dust effects, the Si/Fe ratio does show some increase with redshift (Fig. 3 in Vladilo 2002) which, however, can be explained in term of chemical evolution (Fig. 5 in Calura, Matteucci & Vladilo 2003). As mentioned before, we do not expect significant chemical evolution for the Ar/ ratio. The interpretation of the observed evolution of Ar/ versus redshift is discussed in Section 5.
4.2 Interstellar Ar abundances at
Interstellar lines of sight with through the Milky Way or nearby galaxies are representative of the behaviour of DLAs at . Most interstellar Ar abundances have been obtained for the Milky Way. Unfortunately, at the solar metallicity typical of the Milky Way, Ar i interstellar absorptions are saturated when and reliable measurements can be obtained only in lines of sight with column densities somewhat lower than in DLAs. This difference is taken into account in the discussion below (Section 5).
Milky-Way measurements of [Ar/] are available in 4 lines of sight, yielding [Ar/O] dex (Jenkins et al. 2000; Lehner et al. 2000). Since the local ISM has solar metallicity, the Ar underabundance can also be estimated from the [Ar/H] ratios, which are available for 3 other lines of sight, yielding [Ar/H] = , , and dex (SJ98). Limits obtained from saturated Ar i lines are consistent with these values. The median value of all available measurements is dex, significantly larger than the typical [Ar/] ratio in DLAs at .
The largest Ar deficiencies are found in the Galactic plane. Only one, observed towards Cen ([Ar/H] dex), is comparable to those measured in DLAs at . According to SJ98, this large deficiency requires the cloud to be located close to an ionizing star or to be embedded in soft X-ray radiation produced by local hot gas. The existence of soft X-ray emitting gas in hot cavities of the local H i distribution is well known and the line of sight to Cen intersects the Local Bubble (Kuntz & Snowden 2000; Sfeir et al. 1999) and, probably, a further hot cavity associated with Loop I (Iwan 1980; Centurión & Vladilo 1991). Therefore, the severe Ar deficiency measured towards Cen may well represent a particular, rather than general, interstellar condition.
Among the local ISM measurements, those taken at high Galactic latitude have better chance to reflect the influence of radiation fields external to the Milky Way. Only three lines of sight have been investigated at , yielding [Ar/O] = , , and dex (Jenkins et al. 2000; Lehner et al. 2000), consistent with the median value of the full sample of Milky-Way measurements, dex.
To our knowledge, the only Ar i interstellar absorption detected in a nearby galaxy is the one obtained by Vidal-Madjar et al. (2000) from a FUSE spectrum of IZw18 taken with a large entrance aperture covering the whole galaxy. Analysis of the absorption spectrum yields [Ar/Si] dex (Izotov et al. 2001), even though a value somewhat closer to solar can be derived by taking into account the effects of large-scale velocity fields integrated in the field of view (Levshakov et al. 2001).
In summary, with the available data set it seems reasonable to take [Ar/] dex as a representative interstellar value of the local universe. The comparison with the low values observed in DLAs at indicates that the Ar abundance must significantly increase from to .
5 Discussion
The present study indicates that the full range of [Ar/] values observed in DLAs can be reproduced in the framework of photoionization models of H i regions by properly tuning the spectrum of the ionizing continuum. Even if the models considered are quite idealized, it is clear that the magnitude of the underabundance is related to the shape of the ionizing spectrum, [Ar/] dex being suggestive of a hard, QSO-type continuum, while [Ar/] closer to solar value being suggestive of a soft, stellar-type continuum444Strictly speaking, the latter indication must be taken with caution at high column densities since we are not able to compute the ionization balance for model H1 when (see 3.2.2).. The unique capability of Ar i to discriminate between different sources of ionization at work in DLAs offers the opportunity to cast light on the origin of the ionizing continuum in the associated galaxies, which in principle will include both internal contributions, due to stellar emission, and external ones, due to integrated metagalactic radiation. The origin of the integrated UV background has been the object of intensive investigation, with QSOs and star-forming galaxies being considered as important contributors to the UV background at various redshifts (Haardt & Madau, 1996; Songaila 1998; Steidel et al. 2001; Bianchi et al. 2001; Haehnelt et al. 2001). From these studies a picture is emerging in which the intensity and spectral shape of the UV background evolves with redshift. These studies are necessarily linked to those of the global star formation rate in the universe, which also shows evidence for evolution (Madau, Pozzetti, & Dickinson 1998; Lanzetta et al. 2002). Both types of change (UV background and star formation rate) are expected to affect the ionization state and the Ar abundances in DLAs. The trend of Fig. 10 suggests that the ionizing continuum in DLAs becomes gradually harder from up to . The interstellar Ar abundances in the local universe suggest that the continuum should become softer from to . We discuss the possible implications of such evolutionary trends.
5.1 Ionization properties between and
The general underabundance of Ar at is quite clearly established with the present data set. This result suggests that the spectrum of the continuum is relatively hard, a conclusion which in turn supports an external origin of DLAs ionization, with dominant contribution from QSOs around redshift . This interpretation is consistent with the high space density of quasars observed in the redshift interval (Shaver et al. 1996).
The interpretation of the modest or negligible underabundances seen at , suggestive of a softer ionizing spectrum, is less straightforward. The decline of space density of quasars for (Shaver et al. 1996) may lead to a softening of the UV continuum if quasars are gradually replaced by stars as dominant sources of ionization. However, we do not know whether the bulk of the soft photons required is internal (e.g. stars inside the DLAs) or external (e.g. Lyman-break galaxies). We briefly discuss these two possible scenarios, taking also into account the possibility that the softening of the ionizing continuum at may reflect an evolution of the optical depth of the IGM.
UV continuum at dominated by internal stars. An internal origin of the flux requires a strong synchronization of stellar emissivity among DLAs, in such a way that internal stellar photons dominate at and become negligible at in most cases. This requirement is rather stringent since it would imply a strong decrease of the star formation rate in DLAs at , not easy to understand given the weak evidence for redshift evolution of metallicities (Pettini et al. 1999, Prochaska & Wolfe 2000, Vladilo et al. 2000) and relative abundances (Vladilo 2002) in DLAs. In addition, high redshift DLAs are likely to have low dust content and this makes more critical the requirement that the UV continuum is dominated by internal starlight. In fact, we know from Milky Way studies that the main contribution to the diffuse interstellar radiation is given by photons scattered by dust (see Bowyer 2001). If the dust content is low, the UV photons would tend to escape from the system rather than ionize the H i region(s) inside the system.
UV continuum at dominated by external galaxies. In this scenario the external continuum dominates the internal one in the whole redshift interval explored, with a spectral distribution gradually changing from hard, QSO-type at to soft, stellar-type at . This requires (i) the internal emissivity from stars to be generally modest, (ii) the UV background must become softer at . These requirements seem easy to accommodate within our current views of DLAs, LBGs and studies of metagalactic UV radiation. In fact, the modest stellar emissivity of DLAs is consistent with an origin in galaxies characterized by modest star formation rates, as suggested by studies of chemical evolution of DLAs (Calura et al. 2003). A low stellar emissivity is also suggested by searches for Ly emissions (see Fynbo et al. 1999; Fynbo et al. 2000) and H emissions from DLAs (Teplitz, Malkan & McLean 1998; Bunker et al. 1999; Bouché et al. 2001) which have led, in general, to negative or modest detections. A softening of the spectrum of the metagalactic UV continuum above is supported by studies of Si iv/C iv ratios in metal absorption systems (Savaglio et al. 1997; Songaila 1998; see however Kim, Cristiani & D’Odorico 2002; Levshakov et al. 2002b). If the escape fraction of UV photons from Lyman-break galaxies (LBGs) at is high, as suggested by Steidel et al. (2001), then the change of the spectrum could be due to the rise of the contribution from LBGs parallel to the decline of the space density of quasars. Perhaps more interesting is the possibility that the softening of the continuum is related to a change of the optical depth of the IGM, such as the one expected during the He ii reionization epoch. After this reionization, photons with eV are free to propagate through the IGM and can easily affect the relative abundance of Ar i. In fact, the ratio of the ionization over recombination rates is one order of magnitude higher for Ar i than for H i at eV (Fig. 3 in SJ98). Evidence for the detection of the He ii reionization has been recently reported by Bernardi et al. (2002) and Theuns et al. (2002). The coincidence between the redshift interval in which the Ar abundances change (Fig. 10) and the interval indicated by Theuns et al. (2002) for the He ii reionization to occur () is indeed quite remarkable. In any case it is clear that, from a purely observational point of view, the cumulative evidence for a change of the physical conditions of the IGM around starts to be compelling.
5.1.1 Optical depth of the C iv/Si iv layers in DLAs
The hypothesis that Ar abundances are governed by radiation fields external to DLAs implies that the H i regions must be directly exposed to such radiation. This bears implication on the optical depth of the C iv/Si iv layers in DLAs, which are kinematically disconnected from the layers of low ionization (Wolfe & Prochaska 2000) and probably envelope the low ionization gas, in a way similar to what observed in the Milky Way, where C iv and Si iv layers are stratified at large distances from the Galactic disk. In fact, in order to prevent absorption from external radiation, the high-ionization layers in DLAs should have a negligible Lyman discontinuity. This in turn implies that the neutral hydrogen column density associated with the highly ionized gas should be atoms cm-2.
5.1.2 Soft-X origin of Ar underabundances in DLAs
The local ISM studies suggest that strong Ar deficiencies might be expected in DLAs if regions of hot, soft X-ray emitting gas exist in proximity of the H i region sampled by the line of sight. In principle, this possibility could be used to interpret the trend seen in Fig. 10 as entirely due to internal sources dominating at all redshifts (stars at and soft-X bubbles at ). However, in addition to the drawbacks of the “internal scenario” mentioned in Section 5.1, this would also require a very large filling factor of hot gas in DLAs at . Since in the Milky Way we have detected only one strong Ar deficiency of internal origin out of seven measurements, such cases do not need to be frequent in DLAs.
5.2 Ionization properties between and
The local ISM ionization, representative of the conditions at , is governed by the total contribution of ionizing sources internal and external to the Milky Way. The origin of the external background in the far UV band is not well understood, even though it is clear that (i) some external contribution does exist at high Galactic latitude, (ii) sources with soft continuum, such as Galactic starlight scattered by dust and integrated light from galaxies, do give some contribution; (iii) sources with hard continuum, such as integrated QSOs emission and He ii Ly emission from the IGM, are not dominant (Paresce & Jakobsen 1980; Bowyer 2001; Henry 2002). At low Galactic latitude most of the internal background is due to starlight scattered by dust. Therefore the ionizing continuum in the ISM at either low and high latitudes is expected to be soft and, as a consequence, the local Ar deficiencies to be small. The modest underabundances of Ar found in the local ISM, with median value dex, are consistent with this expectation. The fact that local Ar abundances are measured in lines of sight with H i column density lower than in DLAs does not affect this result. In fact, these lines of sight are less self-shielded and should be more affected by ionization. A hard continuum would create in any case severe Ar underabundances, which are instead uncommon.
If we take the Ar measurements in the local ISM as representative of the universe at , the present results indicate that the Ar abundances in DLAs must increase from dex at to dex at . This predicted increase is consistent with the evolution of the relative contribution of QSOs and galaxies to the UV background in the same redshift interval, derived from number density studies of the Lyman forest. According to these studies the contribution of galaxies overcomes that of QSOs after (Bianchi et al. 2001). If this is true, we predict to detect a rise of Ar abundances at similar, intermediate redshifts.
6 Conclusions
From the analysis of the combined sample of Ar abundance, obtained from Ar i absorptions in DLAs (10 measurements and 5 limits), we have derived the following results.
Most DLAs show significant Ar underabundances relative to other elements (O, Si, and S), with deficiencies as low as dex in some cases.
Departures from cosmic abundances of this magnitude are not expected for elements that share a common nucleosynthetic history. We have considered dust and ionization effects as possible explanations of the observed underabundances.
From a study of [Ar/] versus [Zn/Fe] ratios in DLAs we have shown that dust depletion does not give a viable explanation. This result is consistent with the lack of dust depletion expected for Ar from theoretical studies of the local interstellar medium.
As far as ionization is concerned, we have first considered the possible effects of intervening H ii regions inside the DLAs and, on the basis of a study of O i/Si ii ratios, we have concluded that such H ii regions must be uncommon and cannot explain the observed underabundances.
The full range of the observed Ar abundances can instead be reproduced by photoionization models of H i regions embedded in an ionizing continuum with variable spectral distribution. By using models tuned to match the Al iii/Al ii ratios measured in DLAs we find that the largest deficiencies of Ar can be explained by a hard, QSO-dominated continuum, while the modest deficiencies by a soft, stellar-type continuum.
We have found evidence for a redshift dependence of the Ar abundances in DLAs. At , where most of the measurements are concentrated, the deficiencies are strong ( dex). At the deficiencies are smaller ( dex), with the Ar abundance becoming solar at . More measurements at are required to understand how general this latter result is.
The strong Ar deficiencies at indicate that the ionization is dominated by a QSO-type spectrum, which we associate with a QSO-dominated metagalactic background. The modest deficiencies measured at higher redshifts suggest a predominance of a soft, stellar-type spectrum at . We have considered an origin of this soft spectrum in both starlight internal to DLAs and galactic emission external to DLAs. In both cases, the gradual change of the ionizing continuum from to poses strong requirements on the nature of DLAs and/or the origin of the metagalactic background.
If the redshift variation of Ar abundances is due to the evolution of internal, stellar emission, it requires a synchronization of evolution of DLAs, with most systems having strong star formation rates at and weak at . This seems to be at odd with the lack of clear signal of evolution of DLAs abundances. Also the need for dust at very high redshift, required to maintain an internal, diffuse source of UV radiation, seems to be difficult to reconcile with the low dust content expected in the early evolutionary stages of DLAs.
If the trend is induced by the evolution of the metagalactic ionizing background, it requires (i) the H i regions in DLAs to be directly exposed to the external background, (ii) the contribution from internal emission to be modest, and (iii) the external background to become softer at . The first requirement would imply that the Si iv/C iv layers associated to DLAs should be optically thin to ionizing radiation. The second requirement is consistent with previous claims of low star-formation rates based on abundance studies and searches for Ly and H emission in DLAs. The third requirement is consistent with the evolution of the metagalactic spectrum inferred from Si iv/C iv measurements in the IGM, with claims that LBGs at may have a high escape fraction of ionizing photons, and with the recent finding that the He ii reionization does occur between and .
We have summarized the results of studies of Ar abundances in the local ISM taken as representative of a DLA system at . The typical underabundance of Ar is dex, consistent with the expectation that the ionization in the local universe is dominated by sources with soft continuum. Only in one case a relatively strong underabundance of Ar is found, which may originate in gas embedded in hot, soft-X ray emitting gas known to exist in the local ISM. Taken together, the measurements of Ar abundances in DLAs and in the local universe appear to offer a new tool for probing the redshift evolution of the ionization conditions in the universe. Present observational limitations prevent us to use this tool to probe intermediate redshifts for determining the epoch at which QSOs stop being dominant contributors to the metagalactic UV background. This epoch is estimated to be at from recent studies of the Ly forest. An independent assessment based on Ar abundances will be possible from observations with UV spectrographs fed by space-born telescopes with large collecting areas filling the gap of Ar i measurements between and .
Acknowledgements.
We have benefitted from useful discussions with P. Molaro. We thank the referee for suggestions that have improved the presentation of this work. CP is supported by a Marie Curie fellowship.References
- (1) Bergeson, S.D. & Lawler, J.E. 1993, ApJ, 414, L137
- (2) Bernardi, M., Sheth, R.K., Subbarao, M., et al. 2002, AJ, in press (astro-ph/0206293)
- (3) Bianchi, S., Cristiani, S., Kim, T.-S. 2001, A&A376, 1
- (4) Bouché, N., Lowenthal, J. D., Charlton, J. C., Bershady, M. A., Churchill, C. W., & Steidel, C. C. 2001, ApJ550, 585
- (5) Bowyer, S. 2001, in The Extragalactic Infrared Background and its Cosmological Implications, ed. M. Harwit & M.G. Hauser, IAU Symp. 204, 123
- (6) Bunker, A. J., Warren, S. J., Clements, D. L., Williger, G. M., & Hewett, P. C. 1999, MNRAS309, 875
- (7) Calura, F., Matteucci, F., & Vladilo, G. 2003, MNRAS, in press (astro-ph/0211153)
- (8) Centurión, M., Molaro, P., Vladilo, G., Péroux, C., Levshakov, S.A., & D’Odorico, V. 2003, A&A, in press (astro-ph/0302032)
- (9) Centurión, M., & Vladilo, G. 1991, ApJ, 372, 494
- (10) Dekker, H., D’Odorico, S., Kaufer, A., Delabre, B., & Kotzlowski, H. 2000, SPIE, 4008, 534
- (11) Dessauges-Zavadsky, M., D’Odorico, S., McMahon, R.G., et al. 2001, A&A, 370, 426
- (12) D’Odorico, V., Petitjean, P., and Cristiani, S. 2002, A&A, 390, 13
- F& (92) Federman, S.R., Beideck, D.J., Schectman, R.M., & York, D.G. 1992, ApJ, 401, 367
- (14) Fontana, A., & Ballester, P. 1995, The Messenger, 80, 37
- (15) Fynbo, J. U., Burud, I., & Möller, P. 2000, A&A, 358, 88
- (16) Fynbo, J. U., Möller, P., & Warren, S. J., 1999, MNRAS, 305, 849
- (17) Grevesse, N., & Sauval, A.J. 1998, Space Sci. Rev., 85, 161
- (18) Haardt, F., Madau, P. 1996, ApJ, 461, 20
- (19) Haehnelt, M.G., Madau, P., Kudritzki, R., Haardt, F. 2001, ApJ, 549, L151
- (20) Henry, R.C. 2002, ApJ, 570, 697
- (21) Holweger, H. 2001, in Solar and Galactic Composition, ed. R.F. Wimmer-Schweingruber, AIP Conf. Proc., 598, 23
- (22) Howk, J.C., & Sembach, K.R. 1999, ApJ, 523, L141
- (23) Iwan, D. 1980, ApJ, 239, 316
- (24) Izotov, Y.I., Schaerer, D., & Charbonnel, C. 2001, ApJ, 549, 878
- (25) Jenkins, E.B. 1987, in Interstellar Processes, ed. D.J. Hollenbach & H.A. Thronson, Jr., ASSL, 134, 533
- (26) Jenkins, E.B., Oegerle, W.R., Gry, C. et al. 2000, ApJ538, L81
- (27) Kim, T.-S., Cristiani, S., & D’Odorico, S. 2002, A&A, 383, 747
- (28) Kuntz, K.D., & Snowden, S.L. 2000, ApJ, 543, 195
- (29) Kurucz, R.L. 1991, in Precision Photometry: Astrophysics of the Galaxy, ed. A.C.D. Philip, A.R. Upgren, & K.A. James (Schenectady: Davis), 27
- (30) Lanzetta, K.M., Yahata, N., Pascarelle, S., Chen, H.-W., & Fernández-Soto, A. 2002, ApJ, 570, 492
- (31) Lehner, N., Gry, C., Dembach, K.R. et al. 2001, ApJS, 140, 81
- (32) Levshakov, S., Agafonova, I.I., Centurión, M., & Molaro, P. 2002, A&A, in press, (astro-ph/0210619)
- (33) Levshakov, S.A., Kegel, W.H., & Agafonova, I.I. 2001, A&A, 373, 836
- (34) Levshakov, S., Dessauges-Zavadsky, M., D’Odorico, S., & Molaro, P. 2002, ApJ, 565, 696
- (35) López, S., Reimers, D., D’Odorico, S., & Prochaska, J.X. 2002, A&A, 385, 778
- (36) Madau, P., Pozzetti, L., & Dickinson, M. 1998, ApJ, 498, 106
- (37) Mannucci, F., Thompson, D., Beckwith, S. V. W., & Williger, G. M. 1998, ApJ, 501, L11
- (38) Meyer, J.-P. 1989, in Cosmic Abundances of Matter, ed. C.J. Waddington (New York: AIP), 245
- (39) Molaro, P., Bonifacio, P., Centurión, et al. 2000, ApJ, 541, 54
- (40) Molaro, P., Levshakov, S. A., D’Odorico, S., Bonifacio, P., & Centurión, M. 2001, ApJ, 549, 90
- (41) Morton, D.C. 1991, ApJS, 77, 119
- (42) Paresce, F., & Jacobsen, P. 1980, Nature, 288, 119
- (43) Péroux, C., et al. 2003, in preparation
- (44) Pettini, M., Ellison, S.L., Bergeron, J., & Petitjean, P. 2002, A&A, 391, 21
- (45) Pettini, M., Ellison, S.L., Steidel, C.C., & Bowen, D.V. 1999, ApJ, 510, 576
- (46) Pettini, M., Smith, L.J., Hunstead, R.W., & King, D.L. 1994, ApJ, 426, 79
- (47) Prochaska, J.X., Henry, R.B.C., O’Meara, et al. 2002a, PASP, 114, 933
- (48) Prochaska, J.X., Howk, J.C., O’Meara, et al. 2002b, ApJ, 571, 693
- (49) Prochaska, J.X., & Wolfe, A.M. 1999, ApJS, 121, 369
- (50) Prochaska, J.X., & Wolfe, A.M. 2000, ApJ, 533, L5
- (51) Prochaska, J.X., & Wolfe, A.M. 2002, ApJ, 566, 68
- (52) Savage, B.D., & Sembach, K.R. 1996, ARA&A, 34, 279
- (53) Savaglio, S., Cristiani, S., D’Odorico, S. et al. 1997, A&A, 318, 347
- (54) Sfeir, D.M., Lallement, R., Crifo, F., & Welsh, B.Y. 1999, 346, 785
- (55) Shaver, P.A., Wall, J.V., Kellermann, K.I., Jackson, C.A., & Hawkins, M.R.S. 1996, Nature, 384, 439
- (56) Sofia, U.J., & Jenkins, E.B. 1998, ApJ, 499, 951
- (57) Songaila, A. 1998, AJ, 115, 2184
- (58) Spitzer, L., Jr., & Fitzpatrick, E.L. 1993, ApJ, 409, 299
- (59) Steidel, C.C., Pettini, M., & Adelberger, K.L. 2001, ApJ, 546, 665
- (60) Teplitz, H. I., Malkan, M., & McLean, I. S. 1998, ApJ, 506, 519
- (61) Theuns, T., Bernardi, M., Frieman, J., et al. 2002, ApJ, 574, L11
- (62) Vidal-Madjar, A., Kunth, D., Lecavelier Des Etangs, A., et al. 2000, ApJ, 538, L77
- (63) Vladilo, G. 1998, ApJ, 493, 583
- (64) Vladilo, G. 2002, A&A, 391, 407
- (65) Vladilo, G., Bonifacio, P., Centurión, M., & Molaro, P. 2000, ApJ, 543, 24
- (66) Vladilo, G., Centurión, M., Bonifacio, P., & Howk, J.C. 2001, ApJ, 557, 1007
- (67) Wolfe, A.M., Lanzetta, K.M., Foltz, C.B., & Chaffee, F.H. 1995, ApJ, 454, 698
- (68) Wolfe, A.M., & Prochaska, J.X. 2000, ApJ, 545, 591