Detection of strongly processed ice in the central starburst of NGC 4945 ††thanks: Based on observations collected at the European Southern Observatory, Chile in programs 63.N–0387, 65.N–0535 & 67.B–0096
The composition of ice grains provides an important tool for the study of the molecular environment of star forming regions. Using ISAAC at the VLT to obtain spectra around 4.65 m we have detected for the first time ‘XCN’ and CO ice in an extragalactic environment: the nuclear region of the nearby dusty starburst/AGN galaxy NGC 4945. The profile of the solid CO band reveals the importance of thermal processing of the ice while the prominence of the XCN band attests to the importance of energetic processing of the ice by FUV radiation and/or energetic particles. In analogy to the processing of ices by embedded protostars in our Galaxy, we attribute the processing of the ices in the center of NGC 4945 to ongoing massive star formation. Our M-band spectrum also shows strong HI Pf and H2 0–0 S(9) line emission and gas phase CO absorption lines. The HI, H2, PAH, gas phase CO and the ices seem to be embedded in a rotating molecular disk which is undergoing vigorous star formation. Recently, strong OCN- absorption has been detected in the spectrum of the Galactic center star GC:IRS 19. The most likely environment for the OCN- absorption is the strongly UV-exposed GC molecular ring. The presence of processed ice in the center of NGC 4945 and our Galactic center leads us to believe that processed ice may be a common characteristic of dense molecular material in star forming galactic nuclei.
Key Words.:
Galaxies: individual: NGC4945 — Galaxies: ISM — Galaxies: nuclei — Galaxies: starburst — Infrared: galaxies1 Introduction
It has long been recognized that dust is an important component of the ISM in star forming regions in our galaxy and nearby galaxies. Optical studies of high redshift galaxies as well as deep mid-infrared and submm surveys have recently stressed the importance of dust in galaxies up to high redshifts. Understanding the composition, origin and evolution of dust – particularly in star forming regions – is therefore a key question of astrophysics. Of special importance are interstellar ices, which are only present in molecular cloud environments. Mid-infrared spectra taken with the spectrometers aboard the Infrared Space Observatory (ISO) have shown ices to exist in a variety of extragalactic sources, from nearby starburst nuclei up to distant dust-enshrouded ultra-luminous infrared galaxies (ULIRGs). Weak H2O ice absorptions were first detected in the nuclear spectra of the nearby galaxies M 82 and NGC 253 (Sturm et al. Sturm00 (2000)). Strong ice absorptions of H2O, CO2 and the XCN/CO blend were first seen in the nucleus of NGC 4945 (Spoon et al. Spoon00 (2000)). This was followed by the discovery of H2O, ‘HAC’ and CH4 ice in the nuclear spectrum of NGC 4418 (Spoon et al. Spoon01 (2001)). So far ices have been found in some twenty galaxies (Spoon et al. Spoon02 (2002)), the most distant of which is IRAS 00183–7111, a ULIRG at z=0.33 (Tran et al. Tran00 (2001)).
Interstellar ices are ideal probes for the conditions in the coldest and best shielded galaxy components – their molecular clouds. Embedded protostars can process interstellar ice in their environment thermally as well as through FUV photolysis. Solid CO and ‘XCN’ provide prime probes for this processing. The fundamental vibrational modes of these species correspond to wavelengths around 4.65 m in the M-band atmospheric window. CO ice is highly sensitive to thermal processing of its environment. In quiescent molecular clouds, as probed by e.g. the field star Elias 16, the CO ice feature is dominated by the feature characteristic for an apolar ice mixture. When heated to temperatures above 20 K, this ice mixture sublimates and the only CO ice mixture surviving is a mixture dominated by H2O ice. This mixture has a distinctly different profile and sublimates at temperatures of 90 K. The spectrum of the deeply embedded massive protostar W 33A is dominated by this type of CO profile (Chiar et al. Chiar98 (1998)). The presence of ‘XCN’, or OCN- ice, after its most popular identification (Demyk et al. Demyk98 (1998)), is indicative of strong processing of icy grains by UV light, energetic particles or heating (Lacy et al. Lacy84 (1984); Grim et al. Grim89 (1989); Palumbo et al. Palumbo00 (2000); F. van Broekhuizen, priv. comm.). In our Galaxy, OCN- ice is strongest in the embedded massive protostar W 33A (e.g. Pendleton et al. Pendleton99 (1999)). The feature is generally weak (compared to CO ice) in other protostars (e.g. Pendleton et al. Pendleton99 (1999)) and absent in quiescent molecular clouds, such as probed by the line of sight towards the field star Elias 16 (Chiar et al. Chiar95 (1995)).
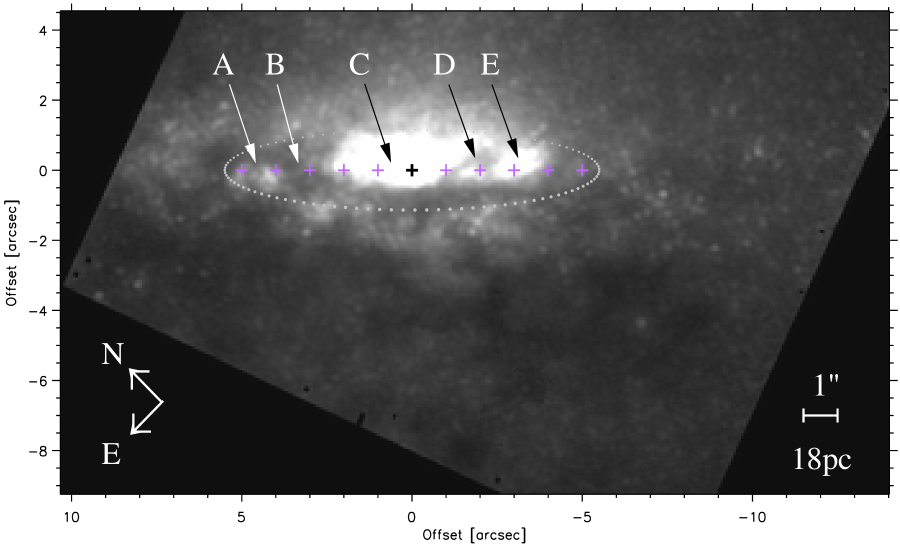
Here we report on our VLT/ISAAC L and M-band follow-up spectroscopy of the rich ice absorption spectrum of the nucleus of NGC 4945 (Spoon et al. Spoon00 (2000)), a nearby (3.9 Mpc; 1=18 pc; Bergman et al. Bergman92 (1992)) luminous (LIR=31010 L⊙) infrared galaxy, seen nearly edge-on (i78; Ables et al. Ables87 (1987)). The central region of this galaxy is dominated by a visually obscured starburst (Moorwood et al. Moorwood96 (1996); Marconi et al. Marconi00 (2000)) and a heavily enshrouded AGN, only seen in hard X-rays (Iwasawa et al. Iwasawa93 (1993); Guainazzi et al. Guainazzi00 (2000)). Pa (1.88 m) and K-band (2.2 m) images obtained with HST/NICMOS (Marconi et al. Marconi00 (2000)) reveal a complicated nuclear morphology, resulting from a nuclear starburst partially obscured by a strongly absorbing circumnuclear star forming ring, seen nearly edge-on. Fig. 1 shows the HST/NICMOS K-band image (Marconi et al. Marconi00 (2000)), rotated such that the galaxy major axis lies horizontally. A possible geometry for the circumnuclear starburst ring, seen under an inclination of 78, is indicated by a dotted circle with radius 5.5 (100 pc). The apparent asymmetric distribution of the nuclear emission interior to this ring (strong emission at position E, no emission at position B) has been attributed to patchy absorption within the ring (Marconi et al. Marconi00 (2000)). Note that the emission at position A on the galaxy major axis appears to arise in the circumnuclear ring, not in the nuclear starburst. The dark structures seen at position D in Fig. 1 are likely gas filaments rising above the star forming ring and appearing in absorption against the bright nuclear continuum. The Pa image (Marconi et al. Marconi00 (2000)) shows more of these dark filamentary structures, one of which passes in front of the K-band nucleus. The AGN, the second brightest Seyfert 2 nucleus in the sky at hard X-rays (Done et al. Done96 (1996)), does not appear in any of the HST/NICMOS images. Groundbased 10 m ESO/TIMMI images (1 seeing) reveal no sign of the central monster either (Marconi et al. Marconi00 (2000)). Also mid-infrared spectroscopic AGN tracers, like 7.65 m and 14.3 & 24.3 m , resulted in strong upper limits (Spoon et al. Spoon00 (2000)). It is hence likely that the AGN is strongly obscured in all directions by material which is most probably close to the black hole for the obscuration to be effective. The conical cavity, protruding from the nucleus along the minor axis and seen in the near-infrared (Moorwood et al. Moorwood96 (1996)) and in soft X-rays (Schurch et al. Schurch02 (2002)), is therefore not a Seyfert ionization cone, but a cavity cleared by a supernova-driven starburst ’superwind’ (Moorwood et al. Moorwood96 (1996)).
Here we present infrared L and M-band spectra of all nuclear components discussed above obtained using VLT/ISAAC with its slit aligned with the galaxy major axis (Fig. 1).
2 Observations
The 3–5 m spectra of the NGC 4945 nucleus were obtained using the Infrared Spectrometer And Array Camera (ISAAC) mounted on the VLT (UT1-Antu) at the ESO Paranal Observatory. The observations were performed on the night of June 15, 2000 for the L-band spectrum and on the nights of June 15–16, 2000 and July 1–3, 2001 for the M-band spectrum. The low resolution grating and the 1 slit were used for the L-band spectrum with a corresponding resolving power of R=360. The M-band spectrum was obtained using the medium resolution grating and the 1 slit, resulting in a spectral resolving power of R=3000 (v=100 km/s FWHM). In both cases, a single setting was done covering the entire L-band and the region from 4.56 to 4.80 m in the M-band. The spectra have a total integration time of 240 s and 5123 s for the L and the M-band, respectively. The telescope was operated in the standard chop-nod mode with a chop throw of 20. The telluric standard BS 5571 (B2III) was observed just before or after each observation of NGC 4945 with a maximal airmass difference of 0.15.
The data were reduced using our own IDL routines. The individual frames were corrected for the non-linearity of the Aladdin detector, distortion corrected using a star trace map and bad pixels and cosmic ray hits were removed before co-adding. For the M-band this procedure resulted in six co-added source frames and six co-added standard star frames. Standard star spectra were obtained by extracting the positive spectral trace from each of the six standard star frames. The six source frames were then divided by their associated standard star spectra, taking into account an optimal small shift between the source frame and standard spectrum by requiring that the pixel-to-pixel noise on the continuum of the final source frame be minimized. No correction for airmass differences was attempted due to insufficient signal-to-noise ratio of the source frames. No hydrogen recombination lines were detected in the standard spectrum and thus no attempts were made to correct the standard for photospheric lines. Next, each source frame was flux calibrated relative to the standard and wavelength calibrated using the telluric absorption lines in the standard star spectrum. The final source frame was then produced by stacking the six source frames, taking into account small dispersion shifts among the frames.
The flux calibration is estimated to be better than 15% and the wavelength calibration is accurate to 150 km/s and 15 km/s for the L and M-band spectra, respectively.
3 Results
3.1 The 3 m water ice band
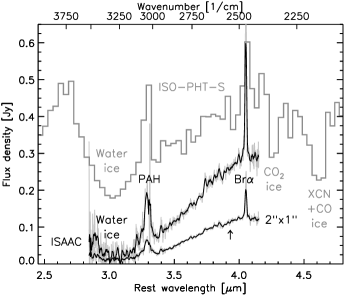
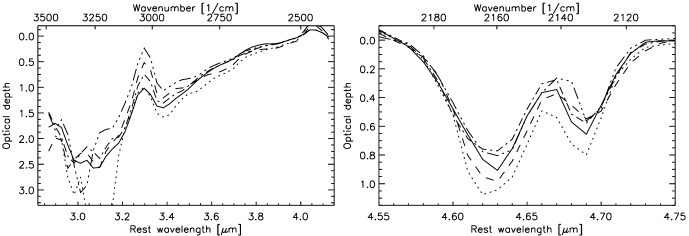
The ISAAC L-band spectrum of the central region of NGC 4945 (Fig. 2) is dominated by a broad (2.7–4.0 m) absorption band attributed mainly to water ice (e.g. Smith et al. Smith89 (1989); Chiar et al. Chiar00 (2000)). The width of the feature is best appreciated in the low resolution 2424 ISO-PHT-S spectrum, which is shown for comparison. Superimposed on the absorbed L-band continuum are the PAH emission bands at 3.3 & 3.4 m as well as the H Br line at 4.05 m. The ISAAC spectra of the central 21 and 11.51 agree well with the larger beam ISO-PHT-S spectrum, assuming the water ice feature in the latter spectrum to be diluted by a non-absorbed stellar and dust continuum. Adopting a flat continuum (fixed at 4.0–4.1 m) and depending on whether we fit the bottom or the blue wing of the feature, we find a water ice column of 41–47 1017 cm-2 (assuming a band strength of 2.0 1016 cm/molecule; Gerakines et al. Gerakines95 (1995)). Note the absence of 3.94 m line emission from the ISAAC L-band spectrum. This line arises in soft X-ray photoionized gas and is comparable to or brighter than the H Br line in many Seyfert galaxies (Oliva et al. Oliva94 (1994); Lutz et al. Lutz02 (2002)). The absence (/H Br0.10) may be taken as evidence for the extremely high obscuration of the AGN in NGC 4945 in the L-band.
3.2 Processed CO and OCN- ice
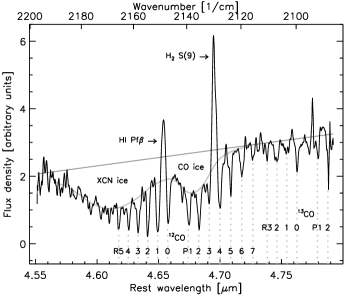
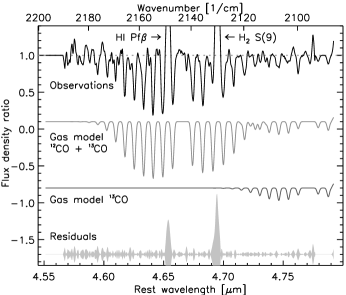
The M-band spectrum of the central 21 of the nuclear region of NGC 4945 (Fig. 3) contains strong and relatively broad absorption features at 4.62 and 4.67 m as well as gas lines due to H, H2 and CO. The line centers of the gas phase lines shift as a function of position along the slit.
In order to investigate the various M-band absorption features, we fitted a linear continuum to the two pivot ranges 4.54–4.55 m and 4.78–4.79 m. The resulting optical depth spectrum is shown in Fig. 4a. In Fig. 4b, 4c and 4d we show spectra of three comparison objects: the embedded massive protostar W 33A with the strongest known XCN feature; the Galactic Center (Moneti et al. Moneti01 (2001)) showing XCN absorption towards its massive star forming region which is obscured in what is effectively an ‘edge-on’ view towards the center of our own galaxy; and, finally, the unprocessed line of sight to the field star Elias 16 located behind the Taurus molecular cloud (Chiar et al. Chiar95 (1995)). The similarity of NGC 4945 to W 33A is particularly striking and will be discussed later.
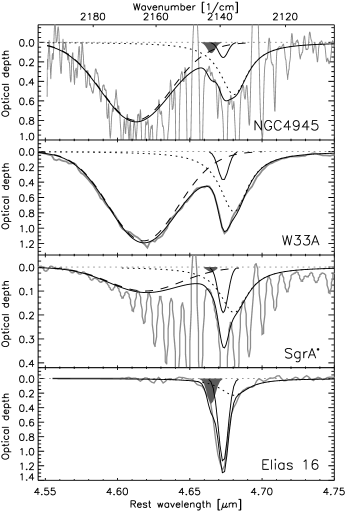
Following Galactic ice studies (Tielens et al. Tielens91 (1991); Schutte & Greenberg Schutte97 (1997); Chiar et al. Chiar98 (1998); Demyk et al. Demyk98 (1998); Pendleton et al. Pendleton99 (1999)) we identify the prominent absorption feature centered at 2168.0 cm-1 (FWHM=24.0 cm-1) with solid state ‘XCN’, or OCN- after its most likely identification (Demyk et al. Demyk98 (1998)). In order to measure the shape and depth of the feature, we adopt the ice feature shown in Fig. 3. This continuum has been corrected for the presence of gas phase 12CO and 13CO absorption lines, discussed later in this Section. The OCN- feature appears slightly blueshifted and narrower than in W 33A (=2165.5 cm-1; FWHM=26.7 cm-1). The differences are similar to those found between the embedded protostars AFGL 961 and W 33A (Pendleton et al. Pendleton99 (1999)) and may be attributed to differences in ice composition (Grim & Greenberg Grim87 (1987)). The column density of OCN- is listed in Table 1 and were computed assuming an OCN- bandstrength of 1.310-16 (F. van Broekhuizen, priv. comm.).
Detailed studies of the observed profiles of the solid CO ice band in Galactic sources have shown that they can all be fitted by varying contributions of the same three components (Boogert et al. 2002a , 2002b ; Pontoppidan et al. Pontoppidan03 (2003)). These three components are thought to represent “pure” solid CO (Gaussian centered at =2139.9 cm-1 with FWHM=3.5 cm-1), traces of CO trapped in H2O ice (“polar CO”; Lorentzian centered at =2136.5 cm-1 with FWHM=10.6 cm-1) and CO in solid CO2 ice (“apolar CO”; Gaussian centered at =2143.7 cm-1 with FWHM=3.0 cm-1) (Boogert et al. 2002a ; Pontoppidan et al. Pontoppidan03 (2003)). Here we note that the spectrum of NGC 4945 is dominated by traces of CO trapped in H2O ice with little or no evidence for the other two components (Fig. 4a). In contrast, the spectrum of W 33A (Fig. 4b) has a noticable contribution of the “pure” solid CO component (Tielens et al. Tielens91 (1991)). Table 1 lists the column densities of the various CO ice components, which were computed assuming a CO bandstrength of 1.1 1017 cm/molecule (Gerakines et al. Gerakines95 (1995)).
The nuclear spectrum of NGC 4945 also reveals CO in the gas phase. In Fig. 3 we identify a total of 13 fundamental ro-vibrational absorption lines of 12CO and several of 13CO. This is a sufficient number of lines to attempt a single component model fit to determine the temperature, intrinsic line width and 12CO and 13CO gas column densities. For this purpose we use the isothermal plane-parallel LTE CO gas models of Cami et al. (Cami02 (2002)), folded with the appropriate VLT/ISAAC spectral resolution (R=3000; v=100 km/s FWHM). In the fitting procedure both the observed spectrum and the model spectra are normalized, through division by a strongly smoothed version of the respective spectra. A four-parameter least-squares minimalization procedure then picks the best fitting model. Fig. 5 shows the result for the nuclear spectrum of NGC 4945. The CO gas appears moderately warm at 35 K, with an intrinsic line width (FWHM) of 505 km/s and column densities log N(12CO)=18.30.1 cm-2 and log N(13CO)=17.2 cm-2, assuming a covering factor 1 for the absorber. The uncertainties listed above do not take into account the systematic errors resulting from the data reduction, which may be appreciable. The very low 12CO/13CO ratio of 13 indicates that some 12CO lines are likely to be optically thick. In addition, the absorbing material may not be in a uniform screen ’covering factor 1’ configuration (Fig. 1). This will particularly affect the derived column for 12CO. A more realistic, yet more uncertain, value for the 12CO gas column may be derived from the 13CO column. Assuming a 12CO/13CO ratio of 80, we find log N(12CO)=19.1 cm-2. Note that the (high resolution) spectrum of the physically closest resembling object, the protostar W 33A, also contains CO gas phase lines (Mitchell et al. Mitchell88 (1988)). At the resolution of the ISO–SWS spectrum (R750; Gibb et al. Gibb00 (2000)) these are however not detectable.
3.3 The spatial distribution of the ice
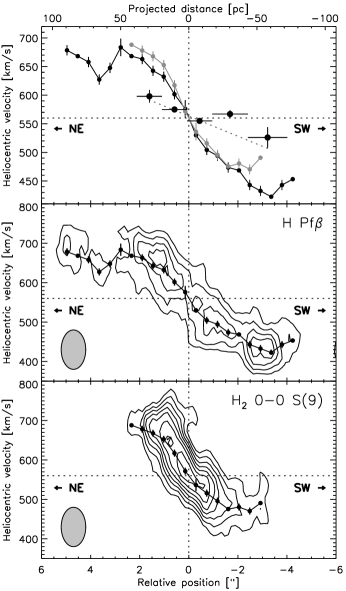
The analysis presented above focusses on the nuclear spectrum of NGC 4945, which comprises the central 21. The nuclear continuum emission extends however from 4.5 SW to 2 NE of the nucleus, measured in a 1 wide slit along the SW-NE oriented (PA=43) galaxy major axis (see Fig. 1). Line emission (Fig. 7) can be traced as far out as 4.5 SW (position E) and 5.5 NE (position A) of the nucleus. Both the continuum and line emission appear clearly weakened in a 1 long strip located 1.7 SW (position D) of the nucleus. This strip coincides with a dark filamentary structure in the HST/NICMOS K-band image (Fig. 1) of Marconi et al. (Marconi00 (2000)). The same image further shows strong extinction from what might be a circumnuclear ring to be responsible for limiting the observable part of the major axis continuum to the range found (see Sect. 1). Our analysis further shows that the ice and gas absorption features are detected wherever there is background continuum to absorb. The depth of the ice features appears to be quite constant (Fig. 6), except for position D, where the solid state absorptions may be significantly stronger. Again interestingly, this position coincides with the dark filamentary structure seen in the HST/NICMOS K-band image (Fig. 1).
The lower panels of Fig. 7 show position-velocity diagrams for the HI Pf and H2 0–0 S(9) emission lines. The distributions are remarkably similar over the central 2, both indicating rotation about the nucleus. The only significant deviation occurs at a position 0.7 NE of the nucleus (position C), where the H2 0–0 S(9) emission extends 40 km/s beyond the highest velocity traced by HI Pf. We speculate that this position may coincide with the start of the N–S oriented molecular ridge, traced in H2 1–0 S(1) by Moorwood et al. (Moorwood96 (1996)) and Marconi et al. (Marconi00 (2000)), bordering the conical cavity cleared by a starburst superwind (Moorwood et al. Moorwood96 (1996)). Another deviation occurs 3– 4 NE of the nucleus (position B), where a dark cloud in the circumnuclear ring weakens the line emission from the nuclear starburst it eclipses. Given the high inclination of the circumnuclear ring, the dark cloud may actually be in an orbit in the outer part of the circumnuclear ring, with an appreciable tangential orbital velocity component. This would explain why the HI Pf emission from that cloud is 50 km/s lower than that of the bright patch 1 NE of it (position A). The top panel of Fig. 7 shows the velocity curves derived from fitting single Gaussians to the line emission in each of the observed HI Pf and H2 0–0 S(9) position-velocity distributions. The velocity curves obtained for both emission lines are consistent and yield the same velocity gradient of 60 km/s/arcsec across the nuclear region. The heliocentric systemic velocity of 5614 km/s (Dahlem et al. Dahlem93 (1993)) occurs at the brightest M-band cross dispersion pixel. Away from the nucleus the velocity curves flatten off to rotational velocities 12010 km/s above and below systemic. This value agrees well with the results for H Br and H2 1–0 S(1) obtained by Moorwood & Oliva (Moorwood94 (1994)). Note that Ott et al. (Ott01 (2001)) find rotational velocities up to 160 km/s for HI (21cm). Assuming that the measured velocities trace the potential, the mass within the nuclear region amounts to 1 108 M☉ at 50 pc and 3 108 M☉ at 100 pc. Also shown in the upper panel of Fig. 7 is the velocity curve for gas phase CO. The CO absorption line velocities were derived by cross-correlating the CO absorption line spectra with the best fitting CO gas model. In order to acquire sufficient signal-to-noise in the lines, the spatial information has been combined into 5 bins of 1.0–1.5 along the major axis. The resulting velocity curve for the CO absorption lines (excluding the point at 1.7 SW; position D; see below) clearly samples a different velocity field than the emission lines do. Based on the four CO points, we measure a velocity gradient for the CO gas of 17 km/s/arcsec across the nucleus. The velocity measured for the 1.7 SW point (position D) clearly does not fit in with the velocity gradient seen for the other four CO points. Interestingly, the HST/NICMOS K-band image (Fig. 1) shows at this position a dark filamentary structure against the bright K-band continuum. Possibly, the CO gas radial velocity measured at 1.7 SW is related to this foreground (circumnuclear ring?) structure instead of to the rotating inner ring/disk.
| N4945 | W33A | Sgr A∗ | Elias16 | |
| N(polar CO ice) | 9.4 | 11.4 | 2.8e | 2.9 |
| N(pure CO ice) | 0.19 | 1.4 | 4.3 | |
| N(apolar CO ice) | 0.16 | 0.0 | 1.0 | |
| N(total CO ice) | 9.7 | 12.7 | 3.5e | 8.2 |
| N(XCN ice) | 1.6 | 2.6 | 0.2e | 0.13b |
| N(cold CO gas) a | – | 130c | 66d | 18h |
| N(warm CO gas) a | 130 | 140c | 1d | – |
| N(CO gas) | 130 | 270c | 67d | 18h |
| N(H2O ice) | 41–47 | 110b | 12f | 25g |
| N(CO2 ice) | 2.0i | 14j | 1.7j | 5j |
| N(polar CO)/N(CO) | 0.97 | 0.89 | 0.8 | 0.35 |
| N(XCN)/N(CO) | 0.17 | 0.20 | 0.07 | 0.02 |
| N(CO)/N(H2O) | 0.21–0.24 | 0.12 | 0.3 | 0.33 |
| N(XCN)/N(H2O) | 0.034–0.039 | 0.024 | 0.02 | 0.005 |
| N(CO ice)/N(CO gas) | 0.08 | 0.047 | 0.05 | 0.5 |
a) We define CO gas as cold if T30 K and as warm if T30 K; b) Gibb et al. (Gibb00 (2000)); c) Mitchell et al. (Mitchell88 (1988)); d) Moneti et al. (Moneti01 (2001)); e) Based on the Sgr A∗ spectrum of Moneti et al. (Moneti01 (2001)); f) Chiar et al. (Chiar00 (2000)); g) Chiar et al. (Chiar95 (1995)); h) Whittet et al. (Whittet89 (1989)); i) Spoon et al. (Spoon00 (2000)) obtained in a 2424 aperture; j) Gerakines et al. (Gerakines99 (1999))
4 Discussion
The wealth of ISM features detected in the VLT/ISAAC L & M-band spectra of NGC 4945 allows us for the first time to study simultaneously the conditions of ionized hydrogen gas, molecular hydrogen, PAHs, icy grains and cold CO gas in the central region of another galaxy. Combined with the spatial information obtained in a 1 wide slit oriented along the galaxy major axis, our observations give insight in the kinematics and spatial location of the different ISM components probed.
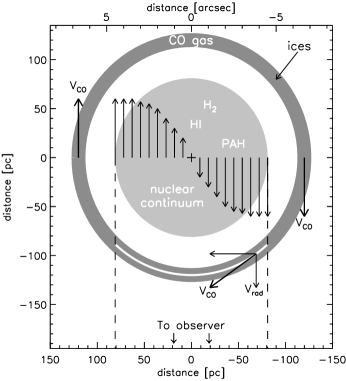
The picture that emerges is of an extended, fragmented and vigorously star forming rotating molecular ring/disk, surrounding the deeply buried, and hence passified, AGN. The H, H2 and PAHs trace the interaction of the massive stars – interspersed within the ring, as indicated by the velocity behavior of the H and H2 lines – creating HII regions and PDRs. The extended continuum emission source created this way, forms the background against which we see the various absorption features. The contribution of the AGN to this continuum is insignificant, as may be concluded from the absence of a pointlike source in both the HST K-band image (Marconi et al. Marconi00 (2000)) and our ISAAC spectra. Hard X-ray observations have shown that the direct view of the AGN is blocked by a hydrogen column density of 1024.7 cm-2 (Iwasawa et al. Iwasawa93 (1993); A2500). The absence of the 3.94 m coronal line and other NLR fine structure lines (Fig. 2; Spoon et al. Spoon00 (2000)) from this region indicates that the ionizing radiation does not escape in other directions either. The shallow velocity curve of the cold CO gas is consistent with the CO being distributed in the outskirts of the nearly edge-on, rotating molecular ring/disk, of which the CO gas velocities are sampled only in front of the bright nuclear continuum, where the line of sight velocity component increases only slowly with projected distance (see Fig. 8). An indication of its scale can be obtained in the simplified assumption of absorption in a single ring rotating at 120 km/s. To reproduce the observed velocity gradient of CO absorption, the radius of this ring would be 7 (120 pc). Other distributions of absorbing material on similar scales, and in particular similar to the dust ring seen in the data of Marconi et al. (Marconi00 (2000)), will reproduce the data as well. The material seen in HI absorption by Ott et al. (Ott01 (2001)) and the rotating central (20) mm-wave CO emission likely belong to the same structure. Although there is no velocity information, we are tempted to co-locate the H2O, CO and OCN- ice with the CO gas. First, the solid H2O, CO and OCN- can be traced as far out as the gas phase CO (Fig. 6). Second, the optical depth of the solid state features is constant over the spatial range probed (except for the 1.7 SW point in Fig. 6), implying co-location of the ices in a foreground position. Third, the filamentary structure seen at 1.7 SW (position D) shows both deeper solid state features (Fig. 6) and a deviant CO gas velocity, suggesting co-location of the ices with the CO gas. Fourth, the absence of the pure CO ice component indicates grains which have been thermally processed to above 20 K. Hence, unlike for dark cloud lines of sight in our galaxy (such as Elias 16 in the Taurus molecular cloud), these ice grains are not located in some random, foreground, dark cloud along the line of sight, but instead close to a source of thermal heating. Fifth, the deep OCN- ice band shows that the ice is heavily processed. That again locates the ices within regions of massive star formation or close to the AGN rather than some foreground material. From the spatial extent and uniformity of the OCN- ice absorption (Fig. 6), a location close to the AGN can, however, be excluded. The only likely location therefore remain within or close to regions of massive star formation in the circumnuclear starburst. Indeed, within our own galaxy, the massive protostar W 33A is an extreme example of processed ices (Chiar et al. Chiar98 (1998); Gibb et al. Gibb00 (2000)). Dark cloud material in general does not show any evidence for the OCN- absorption band (Fig. 4d; Whittet et al. Whittet01 (2001)). In fact, no other Galactic, luminous protostar shows such a strong OCN- band.
The presence of OCN- in ice grain mantles is often taken as a sign of energetic processing by particles or UV photons. Recent experiments suggest however that also thermal processing may result in the formation of OCN- (F. van Broekhuizen, priv. comm.). A fouth possibity presents itself in the vicinity of an AGN: processing by AGN X-ray photons. The AGN in NGC 4945 is, however, strongly obscured and only hard X-ray photons manage to escape. Assuming similar obscuration towards the r100 pc ice region in NGC 4945 as towards our line of sight, we estimate a hard X-ray (20–100 keV) flux of 0.5 erg/cm2/s from the observations of Guainazzi et al. (Guainazzi00 (2000)). This is two orders of magnitude less than the UV flux in a photon-dominated region next to massive stars (e.g. Tielens & Hollenbach Tielens85 (1985)). The available very hard (unabsorbed) AGN X-rays are hence energetically insignificant compared to the starburst UV photons. In addition, such hard X-rays may not couple efficiently into individual ice grains. Further laboratory studies are required to settle these issues.
The starburst in NGC 4945 is similar in luminosity to the prototypical starbursts M 82 and NGC 253 which are also located in the nuclear regions of almost edge-on galaxies. Comparing ISO spectra of NGC 4945 (Spoon et al. Spoon00 (2000)) to ISO data for M 82 and NGC 253 (Sturm et al. Sturm00 (2000); Förster Schreiber et al. Foerster03 (2003)), the obscuration of NGC 4945 is clearly higher towards the ionized medium (as derived from the 18.71/33.48 m ratio in the low density limit), towards the PAH emitting medium (8.6 m and 11.3 m PAH emission features strongly suppressed by 9.7 m silicate absorption), and in 3 m water ice absorption (2.5). It remains unclear, however, whether this is just an on average higher absolute absorbing column towards the nuclear region of NGC 4945, as perhaps not implausible given also the slightly smaller physical size of its starburst, or whether there are differences in the properties of the absorbing medium. Higher quality M band spectra of M 82 and NGC 253 are needed to test whether those starbursts also host processed ices as NGC 4945, but with columns corresponding to their lower obscuration.
The spectrum of the nearest edge-on galactic nucleus, our Galactic center, also shows absorption features due to CO and OCN- ice. The spectrum of GC:IRS 19 (Chiar et al. Chiar02 (2002)) shows the features at similar relative strengths as in W 33A and NGC 4945. The star itself (M star) is most likely not the source of the energetic processing. A chance projection with the processed surroundings of a young foreground star is possible, but also unlikely. The projected distance of GC:IRS 19 to the GC molecular ring is, however, small. The material in this ring is exposed to high UV fluxes from the central cluster, crudely comparable to the radiation field within the molecular ring in NGC 4945. It is hence plausible that energetic processing has created similar ice properties in both NGC 4945 and in the GC molecular ring. The ‘pencil beam’ line of sight to GC:IRS 19 may pass through this processed ring material, explaining the presence of strong OCN- absorption in the spectrum of GC:IRS 19. The larger beam 1420 ISO–SWS spectrum of Sgr A∗ also shows CO and OCN- ice (Fig. 4; Moneti et al. Moneti01 (2001)). The OCN- column is, however, nearly an order of magnitude smaller than in the pencil beam towards GC:IRS 19. This difference is likely due to the large number of background stars within the ISO–SWS beam, whose combined line of sight results in the observed low OCN- optical depth. While some of these pencil beams pass through the processed GC molecular ring, other pencil beams only sample unprocessed foreground material. If the latter line of sight dominates within the 1420 ISO–SWS beam, this would be a natural explanation for the low OCN- optical depth in the Sgr A∗ spectrum of Moneti et al. (Moneti01 (2001)).
The presence of processed ice in the centers of NGC 4945 and the Galaxy leads us to believe that processed ices are one characteristic of dense molecular material in star forming nuclear regions of galaxies, and can be detected in favorable orientations. The amount of processing may then be a measure of the nuclear star formation activity and/or geometry.
5 Conclusions
Using ISAAC at the VLT to obtain spectra at 2.85–4.10 m and 4.55–4.80 m, we have detected for the first time ‘XCN’ and CO ice in an extragalactic environment: the central region of the nearby dusty starburst/AGN galaxy NGC 4945.
The profile of the solid CO band reveals the importance of thermal processing of the ice while the prominence of the XCN band attests to the importance of energetic processing of the ice by FUV radiation, energetic particles and/or heating. In analogy to the processing of ices by embedded protostars in our Galaxy, we attribute the processing of the ices in the center of NGC 4945 to ongoing massive star formation.
Our M-band spectrum also shows strong HI Pf and H2 0–0 S(9) line emission and gas phase CO absorption lines. The HI, H2, gas phase CO and the ices seem to be embedded in a rotating molecular disk which is undergoing vigorous star formation.
The non-detection of the 3.94 m coronal line in our VLT/ISAAC L-band spectrum is in full agreement with the very high obscuration towards the AGN derived from mid-infrared coronal line observations and from the absence of a point-like source in K-band and N-band images. With the source of the obscuration probably close to the AGN for the obscuration to be effective, the radiation from the AGN cannot be responsible for processing the ices.
The obscuration towards the starburst in NGC 4945 is far higher than towards similar starbursts in M 82 and NGC 253, also seen nearly edge-on. It is unclear whether this is just an on average higher absolute absorbing column towards the nuclear region of NGC 4945, or whether there are differences in the properties of the absorbing medium. Higher quality M-band observations of M 82 and NGC 253 are required.
Recently, strong OCN- absorption has been detected in the spectrum of the Galactic center star GC:IRS 19. The most likely environment for the OCN- absorption is the strongly UV-exposed GC molecular ring. The presence of processed ice in the center of NGC 4945 and our Galactic center leads us to believe that processed ice may be a common characteristic of dense molecular material in star forming galactic nuclei.
Acknowledgements.
The authors wish to thank Jean Chiar, Andrea Moneti and Alessandro Marconi for sharing data with us, Fernando Comeron for help in optimising our observing proposal and Adwin Boogert, Jean Chiar and Jacqueline Keane for discussions. The VLT-ISAAC data were obtained as part of an ESO Service Mode run.References
- (1) Ables J.G., Forster J.R., Manchester R.N., et al., 1987, MNRAS 226, 157
- (2) Bergman P., Aalto S., Black J.H., Rydbeck G., 1992, A&A 265, 403
- (3) Boogert A.C.A., Hogerheijde M.R., Blake G.A., 2002, ApJ 568, 761
- (4) Boogert A.C.A., Blake G.A., Tielens A.G.G.M., 2002, ApJ 577, 271
- (5) Cami J., 2002, PhD thesis, Groningen Univ.
- (6) Chiar J.E., Adamson A.J., Kerr T.H., Whittet D.C.B., 1995, ApJ 455, 234
- (7) Chiar J.E., Gerakines P.A., Whittet D.C.B., et al., 1998, ApJ 498, 716
- (8) Chiar J.E., Tielens A.G.G.M., Whittet D.B.C., et al., 2000, ApJ 537, 749
- (9) Chiar J.E., Adamson A.J., Pendleton Y.J., et al., 2002, ApJ 570, 198
- (10) Dahlem M., Golla G., Whiteoak J.B., et al., 1993, A&A 270, 29
- (11) Demyk K., Dartois E., d’Hendecourt L., et al., A&A 339, 553
- (12) Done C., Madejski G.M., Smith D.A., 1996, ApJ 463, L63
- (13) Förster Schreiber N.M., Sauvage M., Charmandaris V., et al., 2003, A&A in press (astro-ph/0212109)
- (14) Gerakines P.A., Schutte W.A., Greenberg J.M., Dishoeck E.F., 1995, A&A 296, 810
- (15) Gerakines P.A., Whittet D.C.B., Ehrenfreund P., et al., 1999, ApJ 522, 357
- (16) Gibb E.L., Whittet D.C.B., Schutte W.A., et al., 2000, ApJ 536, 347
- (17) Grim R.J.A., Greenberg J.M., 1987, ApJ 321, L96
- (18) Grim R.J.A., Greenberg J.M., de Groot M.S., et al., 1989, A&AS 78, 161
- (19) Guainazzi M., Matt G., Brandt W.N., et al., 2000, A&A 356, 463
- (20) Iwasawa K., Koyama K., Awaki H., et al., 1993, ApJ 409, 155
- (21) Lacy J.H., Baas F., Allamandola L.J., et al., 1984, ApJ 276, 533
- (22) Lutz D., Maiolino R., Moorwood A.F.M., et al., 2002, A&A 396, 439
- (23) Marconi A., Oliva E., van der Werf P.P., et al., 2000, A&A 357, 24
- (24) Mitchell G.F, Allen M., Maillard J.-P., 1988, ApJ 333, L55
- (25) Moneti A., Cernicharo J., Pardo J.R., 2001, ApJ 549, L203
- (26) Moorwood A.F.M., Oliva E., 1994, ApJ 429, 602
- (27) Moorwood A.F.M., van der Werf P.P., Kotilainen J.K., et al., 1996, A&A 308, L1
- (28) Oliva E., Salvati M., Moorwood A.F.M., Marconi A., 1994, A&A 288, 457
- (29) Ott M., Whiteoak J.B., Henkel C., Wielebinski, R., 2001, A&A 372, 463
- (30) Palumbo M.E., Pendleton Y.J., Strazzula G., 2000, ApJ 542, 890
- (31) Pendleton Y.J., Tielens A.G.G.M., Tokunaga A.T., Bernstein M.P., 1999, ApJ 513, 294
- (32) Pontoppidan K.M., Fraser H., Dartois E., et al., 2003, A&A submitted
- (33) Schurch N.J., Roberts T.P., Warwick R.S., 2002, MNRAS 335, 241
- (34) Smith R.G., Sellgren K., Tokunaga A.T., 1989, ApJ 344, 413
- (35) Spoon H.W.W., Koornneef J., Moorwood A.F.M., et al., 2000, A&A 357, 898
- (36) Spoon H.W.W., Keane J.V., Tielens A.G.G.M., et al., 2001, A&A 365, L353
- (37) Spoon H.W.W., Keane J.V., Tielens A.G.G.M., et al., 2002, A&A 385, 1022
- (38) Schutte W.A., Greenberg J.M., 1997, 317, L43
- (39) Sturm E., Lutz D., Tran D., et al., 2000, A&A 358, 481
- (40) Tielens A.G.G.M., Hollenbach D., 1985, ApJ 291, 722
- (41) Tielens A.G.G.M., Tokunaga A.T., Geballe T.R., Baas F., 1991, ApJ 381, 181
- (42) Tran Q.D., Lutz D., Genzel R., et al., 2001, ApJ 552, 527
- (43) Whittet D.C.B., Adamson A.J., Duley W.W., et al., MNRAS 241, 707
- (44) Whittet D.C.B., Pendleton Y.J., Gibb E.L., et al., 2001, ApJ 550, 793