Dust Formation In Early Galaxies
Abstract
We investigate the sources and amount of dust in early galaxies. We discuss dust nucleation in stellar atmospheres using published extended atmosphere models, stellar evolution tracks and nucleation conditions. The Thermally Pulsating Asymptotic Giant Branch (TPAGB) phase of intermediate mass stars is likely to be the most promising site for dust formation in stellar winds. We present an elementary model including dust formation timescales in which the amount of dust in the Interstellar Medium is governed by chemical evolution. The implications of the model for high redshift galaxies are investigated and we show there is no difficulty in producing dusty galaxies at redshifts above 5 if supernovae are a dominant source of interstellar dust. If dust does not condense efficiently in SNe then significant dust masses can only be generated at by galaxies with a high star formation efficiency. This is consistent with the high SFR’s implied by sub-millimetre sources found in deep SCUBA surveys. We find the visual optical depth for individual star forming clouds can reach values greater than 1 at very low metallicity (1/100 solar) provided that the mass-radius exponent of molecular clouds is less than two. Most of the radiation from star formation will emerge at IR wavelengths in the early universe provided that dust is present. The (patchy) visual optical depth through a typical early galaxy will however, remain less than 1 on average until a metallicity of 1/10 solar is reached.
keywords:
ISM:abundances–dust,extinction–galaxies:high–redshift1 Introduction
The role of dust in galaxies at present and at earlier epochs is still highly controversial. Recent dust models have attempted to understand the evolutionary cycle of dust (Edmunds 2001 (hereafter E01); Dwek 1998 (hereafter Dwek98); Tielens 1998) but there can be no real advancement whilst there still exists inherent uncertainties over dust sources, composition, destruction and the dependence of dust production on metallicity evolution. It is well known that dust production in the Interstellar Medium (ISM) is too slow (timescales for dust growth are smaller than destructive timescales (Tielens 1998)) so formation sites during stellar evolution are required to explain the vast amounts of dust we observe in the universe.
It is generally accepted that dust is formed in the atmospheres of
evolved stars and ejected via stellar winds with mass loss rates of up
to (Gehrz 1989; Whittet 1992) and contribute
up to of dust to the ISM in our Galaxy per year (Bode
1988). Others
however, propose that supernovae explosions must be an important
contributor to dust formation (Dwek & Scalo 1980, Todini & Ferrara 2001
(hereafter TF01)) to account for
the dust observed at high redshifts (as seen in Damped Lyman
Alpha systems and in SCUBA data (Frayer & Scoville 1999)). The lack of
significant XMM detection of SCUBA sources in a deep field
(Waskett et al, 2003) imply these sources are probably not AGN and
even if they were, then they are likely to be heavily obscured and at
high redshifts (). Almaini et al (1999) also show no significant
Chandra detections of other sub-mm fields. If not AGN then they
are probably extremely dusty starburst galaxies, implying that dust is
already present in the high redshift universe.
It is difficult for the dust to have originated from low-mass evolved
stars at redshifts as their
evolutionary timescales ( - yrs) are
comparable to the age of the Universe at that time. So it is argued then that if dust is present in the
early universe, then Type II SNe are responsible. However, some
estimates of the contribution of SNe dust mass to the current ISM show an
injection of only per year (Bode 1988; Gehrz 1989),
and a recent study of the InfraRed emission from three supernova
remnants (SNR) has shown no evidence of dust formation in SN ejecta -
in fact, it was found the emission was probably circumstellar in
origin (Douvion et al 2001a).
Even dust production in stars has its
own complications. Depending on the star’s composition (whether it is carbon
rich (C stars) or oxygen rich (M stars) and what fraction of a stellar
population is in these stars, there will be a difference in the
returned fraction of carbon and silicate type grains to the ISM. The
problem compounds when O rich stars may become C rich as they
ascend the Asymptotic Giant Branch (AGB) whilst undergoing
pulsations (Marigo et al 1996). IRAS observations (Molster et al 2001) and
observations of AGB stars in the Large Magellanic Cloud (Trams et al
1999) show a high degree of
silicate dust in C stars and it is yet unclear whether this is
due to silicate formation in a previously O rich star or due to an O rich
binary companion (Molster et al 2001).
The questions posed and discussed here are then: when are the
conditions for dust formation reached in stars? What is the source of
dust at high redshift and is dust production dependent on metallicity?
How much dust is present in these early galaxies and how will this
affect observations? The aim of this paper is to ask whether or not
we can build up a significant amount of dust in high redshift galaxies
using the available literature and models.
In Section 2 we use published stellar atmosphere and evolution models to determine when dust may form in stars. We then estimate the efficiency of dust formation in stellar winds and supernovae. Section 3 presents the well established chemical evolution equations and their applications for following dust evolution in a galaxy. In Section 4 we attempt to understand the source of dust in early galaxies, using the modified elementary model from E01. We incorporate the finite lifetime of stars into the dust model and compare this with evolutionary timescales to determine the maximum redshift after which dust can be observed in the Universe for different star formation rates and cosmological parameters. Finally, Section 6 gives the conclusions obtained in this report and an outline of future work.
2 Dust Production in Stars and SNe
The majority of work has assumed that the formation of solids from a gas in stars can be described using classical nucleation theory. Condensation of a species X occurs when its partial pressure in the gas exceeds its vapour pressure in condensed phase (Whittet 1992), with subsequent particle growth by random encounters leading to cluster formation. Chemical reactions will further assist cluster production (Salpeter 1974). The rate of grain growth will therefore depend on the temperature, and pressure, of the gas and the condensation temperature of a species, . The optimum conditions for nucleation are thought to occur in the range and (Salpeter 1974; Yorke 1988). This gives very strict restrictions on where nucleation can occur and this is thought to be satisfied in giant atmospheres at certain stages of evolution.
The type of dust formed will depend on the relative abundance of carbon or oxygen with carbon dust able to form in temperatures . For silicates to form via condensation we require temperatures below (Bode 1987; Whittet 1992; Salpeter 1974). These conditions represent the boundary ’nucleation’ in Figures 1(a) and (b).
2.1 Nucleation in Stellar Atmospheres
Unfortunately there is not yet nearly enough hard observational evidence to follow through the whole process of dust formation in stars so, in an attempt to investigate when nucleation conditions are reached in stars, we examine extended atmosphere models for K and M giants (Plez et al 1992a & 1992b; Hauschildt et al 1999b; Brown et al 1993). We use these models to estimate the temperature and pressure in the gas out to a stellar radius where the continuum optical depth at 500nm has fallen to . The atmospheric conditions depend on the mass of the star, , its surface gravity (), and its effective temperature at the surface, . The published models assume spherical geometry with homogeneous stationary layers in local thermodynamic equilibrium (LTE) and use numerical codes to simulate the gas properties in stellar atmospheres (e.g. PHOENIX (Hauschildt et al 1999a) with these models available from the website: http://phoenix.physast.uga.edu/NG-giant). Although this is probably not a realistic description of conditions in stellar atmospheres where pulsations, mass loss and inhomogeneities will surely exist, they will serve to make an estimate of the mean condition for the processes occuring.


Model atmospheres for C stars were obtained from Jörgensen et al (1992) and an observational model (Harper et al 2001) of the red giant AlphaOri is included for comparison (with , , ). The model - curves are shown in Figure 1(b) for , and Figure 1(a) for . They clearly show the models do not extend to the low gas temperatures observed in AlphaOri, and we will assume the boundaries do in fact extend downwards in a similar manner. It is also clear that as increases, the likelihood of the gas temperatures reaching the nucleation boundary decreases. The figures in Hauschildt et al (1999b) show for various values of , that only those atmospheres with will reach gas temperatures below 2000K and hence attain C nucleation conditions. In order to reach the silicate nucleation boundary, we require (Fig 1(c)).
To determine to which stars these model atmospheres apply, the luminosity was calculated using Equation 1 and simply placed on a Herstzprung-Russell diagram using their respective values (Fig 2).
| (1) |
The stars do indeed correspond to the evolved stages expected, but for dust nucleation properties to be reached we require the stars to lie on or just beyond a late AGB phase (evolutionary tracks of solar metallicity, , from Schaller et al (1992)). It appears then that the stars seen to produce dust using the arguments given here, only satisfy the conditions at the very latest stages of their evolution which is only a very small fraction of their life (years). This phase is the TPAGB (Thermally Pulsating Asymptotic Giant Branch) as described further in Section 2.2. The stellar evolution models from the the Padova group (http://pleiadi.pd.astro.it) also give the same conclusion. The stellar tracks can reach lower effective temperatures (Pols et al 1995) depending on the opacitites, overshooting and mixing parameters used although a recent study of these models suggest there is still more to be done in this area (Young et al 2001). We await further progress on new tracks given by this group using their new stellar evolution code, TYCHO.

In further sections we assume that only those stars with and which lie on this evolutionary branch are significant producers of dust (although this is actually a maximum limit since these are the conditions for carbon nucleation and we would expect to require much lower temperatures for the formation of silicate dust).
It is important to note that because of this reasoning we have ignored dust production in the atmospheres of stars with . Observationally however, dust shells are seen around a class of massive stars which suffer large mass loss () in the late stages of their evolution. These are the Wolf-Rayet stars, which have three phases characterised by the dominant species of O, C and N in their spectra. Dust shells are only seen around the very cool, carbon rich WR (Dwek98), and will therefore contribute to the production of carbon dust in the ISM. Could this be a significant dust formation site? Recent observations of a WR binary system have shown that the formation of dust in these stars may be increased via wind-wind interactions with at least 20 per cent escaping and thus enriching the ISM (Marchenko et al 2002). Their results find a total dust mass of which coupled with the mass loss rate gives an estimate of the condensation efficiency of dust in WR of per cent. But WR stars are also very rare in galaxies as compared to low-intermediate mass stars, with the fraction of stars in a given population with implying that the yield of dust from such a process will not be significant.
2.2 Mass Loss and the TPAGB Phase
The dominant processes in stellar mass loss are pulsational and line driven winds with mass loss rates 222Dust driven winds only become important at high metallicities where there is sufficient dust production to drive the gas outwards (Willson 2000). of and . The important question to ask is how much of these outflows are in the form of condensed material? Whether or not dust is formed from the gas will depend on the temperature and the density inside the wind (Section 2.1). A rough estimate of the dust production in these winds can be made by investigating condensation conditions in stellar atmosphere models which in turn are tied to stellar evolutionary models which predict and throughout the stars evolution.
The mass lost throughout the star’s lifetime must satisfy the initial-final mass relationship shown in Weidermann (1987) and Marigo (2000). Thus for low-intermediate mass stars , the mass lost in stellar winds and novae is the difference between the initial mass, and the final remnant mass, . For high mass stars () the mass is lost via both winds and SNe. Stars with mass beyond may become a black hole and swallow up the elements produced (Maeder 1992) so they are ignored here.
We have followed the evolutionary model grids in Schaller et al (1992)333as distributed by the astronomical data center at NASA Goddard Space Flight Center, up to the end of central C burning for high mass stars, the early AGB phase for intermediate stars and up to the He flash for low mass stars. Some of the mass lost during a stars lifetime must occur during a very late AGB phase or after (the mass lost from the published models does not explain the difference between the initial mass and remnant mass444the points of greatest mass loss up until the end of the evolutionary grids was multiplied by the duration, , to give the total mass lost. In the TPAGB & stellar wind phases, & were taken from Blöcker (1995a) and Marigo (1996), but how and where does this occur? As a star ascends the AGB its thought that (depending on the previous mass loss history), it may undergo some He flashes and will pulsate periodically. This is the TPAGB phase and will create a dredge up of material within the star to its surface. There will be not only a change in the composition in the atmosphere but also the composition of the dust (Garcia-Lario & Pera Calderon 2001; Herwig et al 1999). The TPAGB phase has mass loss rates comparable to the AGB phase and lasts for approximately years depending on the initial stellar mass (7-3 respectively) and the number of thermal pulses in the phase (Blöcker 1995a). So there is an opportunity here to create and inject dust into the ISM, but are the conditions right? The conditions for dust formation do appear to be satisfied in the TPAGB phase as shown in Figure 3 where the evolutionary tracks of stars undergoing thermal pulses from Marigo (1996) are added to those in Schaller et al (1992) for low-intermediate mass stars. It may be seen that the TPAGB tracks pass through the area where dust forming atmopsheres exist on Figure 2. The pulses may allow for periodic dust formation by increasing the density around the condensation point (Blöcker 1995b) and carbon stars evolving on these tracks can reach (Marigo 1996), increasing the likelihood of nucleation.

The future evolution of the star may depend on where the thermal pulses occur as they ascend the AGB. If the TP occurs just before the AGB ends, the star will experience dredge up and may become C rich. A superwind is then thought to occur with (Schonberner & Steffan 2001; Blöcker 1995b). If the TP occurs after the AGB ends (characterised by an increase in and a decrease in (Fujii et al 2001)), then it will evolve on a constant luminosity track for years to a Planetary Nebula stage (PN) - and the star is now PAGB (Post AGB). This is characterised by an increasing and a decreased mass loss with temperatures reaching above 30,000K. The central star begins to ionize the surrounding material to create a PPN (Proto-Planetary Nebula). This phase does not seem suitable for dust formation. It does not satisfy the low temperatures or the high mass loss rates needed, so we can ignore this as a significant phase of dust production (although circumstellar dust shells are seen around PAGB stars, they are thought to have survived from their previous AGB phase (Lorenz-Martins et al 2001). If the TP occurs when He burning has ceased then the star will evolve on a white dwarf cooling track and will again not be suitable for dust conditions.
So in these later evolutionary stages we have a clear candidate for a dust formation site - stars in the TPAGB and the superwind phases. Those stars which have had their composition changed from O rich to C rich are now more likely to form C rich dust. It is interesting to note that from Section 2.1, not only is it difficult to reach the low temperatures in stars for silicates to form but we are now faced with the problem that those O rich stars are likely to become C rich in the most significant dust formation stages! This would infer that silicate dust may not be the dominant component of returned dust from stars as previously thought (Bode 1988), but instead SNe may be responsible for most of the silicate dust we see in the ISM. Dust formation in the TPAGB phase will also be highly dependant on metallicity as dredge ups are more efficient at low Z, hence the TPAGB is reached earlier on in the stars’ lifetime and more C stars are formed (Dwek98; Groenewegen 1999; Marigo 1998; Marigo et al 1999). The enhanced conversion of O stars to C stars at low Z may then imply a large abundance of carbon dust in the early universe (although at Z=0.001 we need at least yrs for to reach the TPAGB phase).
It is worth mentioning that if it is mainly carbon dust forming in stars during the TPAGB phase then it may be formed from freshly synthesised elements in the star and may be considered differently to dust formed from pre-existing heavy elements in stellar atmospheres. This may have consequences in models which separate the formation of dust into two different modes. From E01, we can define a dust formation efficiency (i.e. how much of the available heavy elements will be incorporated into dust) depending on whether those heavy elements are from freshly synthesised (e.g. in SNe) or pre-exisitng material (e.g. in stellar winds). We label these dust condensation efficiencies and respectively. The TPAGB phase may thus be considered as a source instead of a as although the dust is being formed in a stellar wind, its source of heavy elements is dredged up from freshly synthesised carbon from the core. Although the ejecta is likely to be mixed, the carbon dredged up during the TP-AGB phase is a way of producing fresh elements at low metallicity, i.e. the production of both silicate and carbon dust may depend on metallicity. The implications of this is investigated in Section 3.
2.3 Estimating the Condensation Efficiency in Winds
| a | b | Total | Implied | ||||||
|---|---|---|---|---|---|---|---|---|---|
| 0.5 | 2.4E-5 | 2.4E-5 | 8.0E-6 | 5.2E-6 | 1.3E-5 | 0.55 | |||
| 2.4 | 2.4 | 3.5E-2 | 3.0E-2 | 6.0E-4 | 1.9E-2 | 2.0E-2 | 0.65 | ||
| 3.3 | 3.3 | 1.5E-2 | 2.0E-2 | 2.3E-4 | 1.5E-2 | 1.5E-2 | 0.76 | ||
| 4.2 | 4.2 | 5.0E-3 | 1.2E-2 | 1.7E-4 | 9.0E-3 | 9.2E-3 | 0.76 | ||
| 7.8 | 2.8 | 2.7E-2 | 1.7E-1 | 1.0E-4 | 6.0E-4 | 7.0E-4 | |||
| 10.6 | 2.6 | 7.1E-2 | 6.9E-1 | 1.4E-4 | 6.6E-4 | 8.0E-4 | |||
| 13.3 | 3.3 | 1.4E-1 | 1.32 | 2.6E-4 | 3.4E-4 | 4.8E-4 | |||
| 17.8 | 5.0 | 2.2E-1 | 2.73 | 5.6E-4 | 2.4E-4 | 8.0E-4 | |||
| 22.3 | 9.4 | 3.0E-1 | 4.48 | / | / | / | / | ||
| 38.2 | 30.0 | 4.88 | 8.01 | / | / | / | / |
To estimate the condensation efficiency in winds we can use the models in Schaller et al (1992) and Marigo et al (1996) to give the mass fraction lost in winds (as listed in Table 1), and the fraction which satisfies the conditions for nucleation given in Section 2.1. Equation 2 will then give an estimate of (although this is actually a maximum as we assume condensation wherever the nucleation conditions are satisfied).
| (2) |
It must be emphasised that a more detailed definition of the dust condensation efficiency in stellar winds would be to account for the free carbon in the ejecta (i.e. C not locked up in CO) and any available Si rather than just take the mass of heavy elements ejected as was done here. This has been done in a much more detailed manner in Dwek98 but in high redshift galaxies, it would be difficult to determine the composition from the sub-mm fluxes only. Thus we try and estimate the maximum dust mass which could be created in winds and ignore detailed composition calculations. The new dust formed in the TP-AGB phase is likely to be carbon based whereas in the superwind phase, the dust is likely to be silicate based depending on the C/O ratio in the star. The majority of any pre-exisiting dust in the ejecta is likely to be silicates.
To determine the average condensation efficiency over a stellar population we need to sum over the stellar mass spectrum, with Salpeter initial mass function, . The uncertainty of whether or not the TPAGB phase represents or does not allow a clear estimate to be made, and initially we estimate for the models in Schaller et al (1992), and which also includes the TPAGB and the superwind phase.
So for solar metallicity and using Table 1,
If the condensation efficiency of nucleation then this would decrease . Published estimates are (Dominik et al, 1993) for condensation of Si, Fe, Mg, O and for carbon (Cadwell et al, 1994) in stellar atmospheres. The numbers given in Table 1 are a maximum and could be as low as 0.1 if we assume only 30 per cent nucleation efficiency when conditions are right. This is a minimum limit for an elementary model (E01) to reach the observed dust masses in the solar neighbourhood. From these simple arguements, it appears that the TPAGB and superwind phases may be the most significant dust production phase in the stars lifetime.
2.4 Estimating the Condensation Efficiency in SNe
Recent work on the nucleation of dust grains in supernova gas has begun to shed some light in this area (Kozasa et al, 1997; Clayton et al, 2001; TF01). Using SN1987A observations as a basis, they all predict rapid growth of dust grains around 500-600 days after the initial explosion (as shown in SN1987A by the increase in the luminosity emitted in the Infrared at these times). The observational evidence for dust condensation in SN1987A is promising (for a detailed discussion see Wooden, 1997) but it nevertheless has a featureless emission spectra with no Si, C or O attributes. This is thought to be accounted for by iron type grains which is also suggested by the similarities in the iron and dust filling factors of the ejecta (Wooden, 1997). The total mass of dust observed in SN1987A from IR emission is although the elemental depletion seen in the ejecta suggests this should be a lot higher (Dwek, 1992). This discreprancy can be explained if a colder population of dust grains exists and survives in ejecta clumps (Lucy et al, 1991). These grains would radiate at longer wavelengths and could produce a further of dust not detectable in IR. Future Sub-mm observations of SNR’s could detect this cooler dust and if discovered may suggest condensation efficiencies of per cent. There is other observational evidence to support this view with dust emission seen in the young SNR Cassiopiea A. IR observations of Cass A indicate that of dust is present (Arendt et al, 1999; Douvion et al, 2001a,b) which is much less than expected from theory. Two ’recently’ observed supernovae SN1993J and SN1994I show no sign of dust condensation in their ejecta and unlike SN1987A, which began its SN phase as a blue supergiant, these progenitor stars were red supergiants (Wooden, 1997). It remains to be seen if SN1987A and CassA are special cases.
Theory is still a long way from reliably estimating the condensation efficiency of dust in SNe of different progenitor mass and evolutionary phases. The most acceptable theories begin with nucleation via chemical or kinetic rates, but still can not exactly match the observations of SN1987A (with that of Kozasa et al (1989, 1997) predicting lower gas temperatures than actually seen). Interestingly the models in Clayton et al (2001) allow for a greater production of carbon dust even in ejecta with compared to the more classical nucleation models (Kozasa et al, 1989, 1997). Again there may be the possibility of more carbon dust produced than silicates. We take the elementary model published in TF01 to estimate the condensation efficiency in SNe (although this is based on the nucleation theory given in Kozasa et al, which has been shown to be incorrect for SN1987A). The model gives the dust mass produced per supernova as a function of the mass of the progenitor star and the metallicity. TF01 have modelled two cases of dust production - (a) and (b) - corresponding to low and high energy SNe explosions respectively.
To estimate for these two cases, we require information on the heavy element yield from the ejecta (as we are interested in finding the condensation efficiency of dust forming from freshly synthesised elements, Equation 3).
| (3) |
The yields were obtained from the tables given in Woosley & Weaver (1995), for a grid of stellar masses and metallicities . Weighting the values over the stellar mass spectrum for solar metallicity, gives:
Other theoretical models suggest efficiencies of (Kozasa et al, 1991; Clayton et al, 2001) whereas observations suggest (Douvion et al, 2001b). The available data allows for a comparison of values at different metallicities as discussed in the next Section, although we must stress that there are no observations which clearly confirm the extent of any condensation of dust in SNe (other than SN1987A and CassA), this is purely based on theoretical models.
2.5 The Dependence of Dust Sources on Metallicity
Now we can ask the question does the condensation efficiency as estimated here vary with the metallicity evolution of a galaxy? It seems obvious that there will be less dust formation at low Z due to higher temperatures in the stellar atmopsheres but can we actually quantify this relationship?
It is useful at this stage to re-define the condensation efficiencies used in previous Sections:
-
•
- efficiency of dust condensation from new heavy elements for the (a) high energy (b) low energy SNe explosions.
-
•
- efficiency of dust condensation from pre-existing heavy elements in stellar winds of stars during their RG/AGB phases.
-
•
- condensation efficiency of dust from stellar winds of evolved stars during their TPAGB phase if we assume the available heavy elements are freshly synthesised in the star.
-
•
- condensation efficiency of dust from pre-existing heavy elements in the stellar winds of evolved stars during their RG/AGB phase and their superwind/TPAGB phases (i.e. ).
Using the same arguments as given in Section 2.3, the condensation efficiencies in stellar winds, and at different metallicities have been estimated. The criteria for nucleation is the same with the mass loss rates and effective temperatures taken from Schaller et al (1992), Schaerer et al (1993), and Schaller et al (1993). The published models allowed estimates to be made for dust nucleation for and 555as distributed by the astronomical data center at NASA Goddard Space Flight Center. Their corresponding values are listed below in Table 2. represents the condensation efficiency in the TPAGB phase if it is considered as a source i.e. freshly synthesised dust production. groups the TPAGB into the stellar wind mode.
For , the same process of estimating the condensation efficiency seen in Section 2.4 was applied to the yields at other metallicities from Woosley & Weaver (1995). The values are given in Table 2 where (a) and (b) still represent the low and high energy cases.
For zero metallicity, it has been shown that the TPAGB phase does occur but only at (Marigo et al 1999). Therefore the TPAGB phase at low metallicities is not considered here as a source of dust production. For , the star does appear to reach the low temperatures but for a shorter period of time as compared to those at solar metallicity (as shown in Marigo et al (1996)). The problems in trying to calculate the condensation efficiency at different become apparent when trying to determine the mass loss rates and the time spent in the nucleation conditions. With lack of any concrete information it is assumed that the TPAGB properties at are similar to those at but at lower metallicities less dust is formed per star due to less time being spent in this phase. Note that this will be a maximum estimate of . There is no significant correlation between the metallicity and the condensation efficiency in SNe so we assume is roughly constant, . The approximate variation of , and with metallicity is given below,
| 0 | / | / | / | 0 | 0.16 | 0.10 | |
| 0 | / | / | 0.10 | 0.10 | 0.45 | 0.21 | |
| 0 | / | / | 0.10 | 0.11 | 0.22 | 0.22 | |
| 0.46 | 0.15 | 0.18 | / | / | 0.22 | / | |
| 0.27 | 0.18 | 0.21 | / | / | 0.23 | / |
3 Modelling Chemical Evolution
Using the notation given in Pagel (1997) and Henry et al (2000), we can follow the buildup of heavy elements over time in a closed galactic system. Initially we have a mass of gas, g, which is converted into stars, s, via a star formation rate - SFR, and an IMF, . The total mass of the closed system will then be
Using an infall model (such as the one described in Dwek98), the extra dilution of the ISM limits the metallicity reached and hence the dust mass will be slightly less. Edmunds & Eales (1998) show that the simple model produces the maximum dust yields for a given gas fraction hence we assume no inflows or outflows (the effects of which are discussed elsewhere (e.g. Koppen and Edmunds, 1999; E01)). The gas mass, g will be depleted by star formation and enriched by the mass ejected from stars, e(t).
| (4) |
The evolution of heavy elements in the ISM () is governed by the ejection of metals by stars () and those going into forming stars.
| Mass Ranges | Z | ||
|---|---|---|---|
| 111From Marigo, 2000 | 0.004 | ||
| 0.02 | |||
| 222From Meader, 1992 | 0.001 | ||
| 0.02 | 0.015 |
| (5) |
Therefore the metallicity evolution is described by Equation 6
| (6) |
Assuming that mass loss occurs suddenly at the end of stellar evolution, the ejected mass and the ejected heavy elements are (Tinsely 1980)
| (7) |
| (8) | |||||
where is the stellar yield of heavy elements from a star of initial mass m (values taken from Maeder (1992) and Marigo (2000) for massive stars and IMS respectively). is the remnant mass, is the lifetime of a star of mass m such that a star formed at has died at time t, and is the stellar mass whose corresponds to the age of the system. Thus we have taken into account the finite age of the stars ejecting the material into the ISM.
The second term in Equation 8 gives the integrated yield, which defines the mass fraction of stars formed in the mass range and and eventually expelled as new element , Equation 9, Table 3.
| (9) |
is the initial mass function which is the normalised Salpeter IMF with b=1.35
| (10) |
where and . It is not straightforward to solve these equations without making some simple assumptions so we approximate the remnant mass from Talbot et al (1973) such that for and for . The assumed star formation rate, scales as the gas density to some power where
| (11) |
and the constant k we label as the star formation efficiency. is thought to lie between 1 and 2 - although here we assume for simplicity.
The code was written with a logarithmic timestep with initial conditions for the gas and metallicity of the system:
The yields from Maeder (1992) and Marigo (2000) were interpolated to find the stellar yield corresponding to a given metallicity and mass. The stellar lifetimes were taken from the Schaller et al papers and were also interpolated to find the relevant value for m and Z. Equations 4 & 6 were then solved at each timestep with each increment of Z and g added to the previous solution.
3.1 Dust Evolution

From E01, the elementary model uses the instantaneous recycling approximation and follows the evolution of gas mass (g), metallicity (Zg) and grain core mass (yg) as a mass ds forms stars as in equations 12, 13 & 14. The destruction of grains is ignored here as is also mantle growth onto the grains in the ISM (previously included in E01, Dwek98). The terms in Equation 14 represent the relative contributions of dust sources to the grain mass as a mass ds forms stars. The first term gives the contribution from SNe, the second from stars and the third from grains lost in forming stars.
| (12) |
| (13) |
| (14) |
However if the TPAGB can be considered as a ’new’ dust production mode then this will affect the elementary model. We can now propose an additional term allowing for the grain cores formed in the TPAGB phase with condensation efficiency, and the fraction of C stars in a population, . will depend strongly on the metallicity - the number of C stars increases at lower Z due to an increase in the efficiency of dredge-ups (Marigo et al 1999). This relationship is shown in Groenewegen (1999, Fig 3), and from this we can roughly quantify a function for the variation of with Z, as in Equation 15.
| (15) |
This empirical relationship fits well the obsservations in which the number of carbon stars in systems of different metallicity (e.g. LMC/SMC, Fornax Dwarf Galaxy, etc.) are identified by various spectroscopic methods. It is possible that the relative number of carbon stars may also depend on the star formation rate history (Gronenewegen, 1999) but detailed modelling would require excellent evolutionary tracks with reliable dredge up predictions. Further work might usefully investigate such models but for our present purposes this simple prescription should be adequate.
The integrated yield of carbon produced in low-intermediate mass stars during the TPAGB phase () can be estimated at different metallicities using Figure 12 in Marigo (2000). Qualitatively, if we assume that of the solar C/O value is carbon returned by these stars (Henry et al 2000) we obtain . The elementary model including the TPAGB phase is then described by Equation 16.
| (16) | |||||
The solutions for the dust mass y(g) and y*(g) were obtained numerically and are shown in Figure 4. In this Figure we compare the elementary model in E01 (Equation 14) to Equation 16 by plotting the ratio of the grain core mass (yg) to the metal mass (zg). For the elementary model case we use whereas for Equation 16, the values are those defined in previous Sections. The increased dust mass seen in Figure 4 initially, is due to a higher value. At lower gas mass the increased dust mass is now due to a higher (0.45). This model therefore predicts more dust mass seen throughout galactic evolution compared to the equal case of the elementary model.
We can include a time delay for the production of dust in stars if we assume dust is all produced in stellar winds at the end of stellar evolution (which is valid if our arguement in Section 2.1 is correct). This approach has been adopted before (Pagel, 1997; Dwek98) and can be quite a useful approximation. Using the lifetimes of stars of different mass (Schaller et al, 1993) we can set the delay of dust production, (in Gyrs) as:
as the delay of dust production in stars producing and dust respectively. Thus the dust will evolve with time as
| (17) | |||||
Equation 17 is not compared here as it is only important when looking at temporal variations of dust evolution. This is a useful analytical approximation to follow the delay of dust production in low mass stars but for a more detailed description we require further modelling (Section 4). The TPAGB model is not significantly different to the elementary model but will continue to be used here. It may be useful in tracing the evolution of carbon and silicate dust in the galaxy in future work.

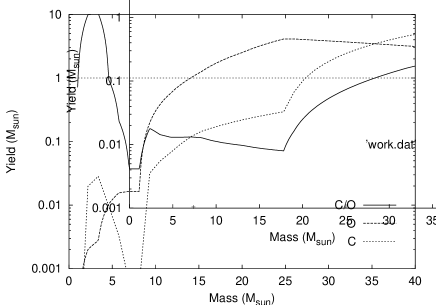

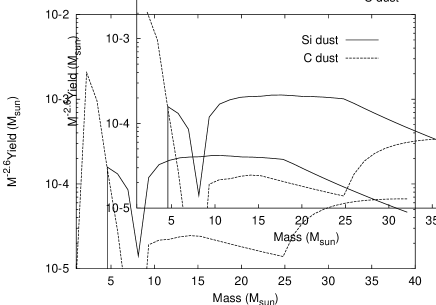
We can also compare our dust model with the work presented in Dwek98 which also follows dust formation via chemical evolution (although the model presented here is a very simplified version with fewer parameters). As both models assumes a fraction of the heavy elements will condense into dust, it is interesting to compare the differences in the yields used. In Figure 5 we plot the carbon and oxygen yields used in both models from stars in the range for solar metallicity. In (a) we sketch Figure 6 in Dwek98 in which the yields for IMS and massive stars are taken from Renzini & Voli (1981) and Woosley & Weaver (1995) respectively, and in (b) we plot the yields from this work as given in Table 1. This work takes the more recent results for IMS yields from Marigo (2000) in which a metallicity dependant mass loss prescription is used. This produces higher carbon yields for IMS than those in Renzini & Voli (1981) and negligible carbon yields in stars with (as is also shown in the TPAGB models presented in van de Hoek & Groenewegen (1995)). This is thought to occur due to a drop in the TP lifetime (hence lower number of dredge ups) due to HBB (Hot Bottom Burning - see aforementioned papers for discussion). The Renzini & Voli (1981) model also uses a lower mass loss parameter ( instead of in Marigo (2000)), which will produce optimistic yields for stars . The differences between these models are clearly seen in Fig 5 (a) and (b) with this work having a high C/O ratio produced in IMS but lower yields overall over the whole mass range. This in turn leads to a lower dust yield in this work in comparison with Dwek98 which is shown in Figure 6. Again in (a) we sketch the model in Fig 7, Dwek98 in which the SMS weighted dust yields are shown for solar metallicity and compare with this work in Figure 6(b). As originally shown in Dwek98, and reproduced in Figure 6(a) and (b), the majority of carbon dust is produced in IMS whereas the silicate dust is from massive stars. In (b) we have a greater yield of carbon dust from more massive stars () than (a) due to the higher C/O ratio in massive stars in the Maeder(1992) yields. It is clear that, due to the particular stellar models and yields chosen, Dwek98 and this work differ considerably in the prediction of dust production. This probably indicates that a degree of caution should be used in interpreting our overall results, but the underlying methodology should be sound and detailed predictions will improve with better stellar models.
3.2 Dust Evolution with Metallicity

Putting the relationships from Section 2.5 into the elementary model we obtain Figure 7. The variation of with metallicity as proposed here does not appear to differ significantly from the elementary model. The only differences are in the increased grain core mass at low Z (due to a higher ) and at very low gas masses (particularly for the relationship). The increased yield of carbon from the models given in Marigo (1998) as compared to those in Henry et al (2000) will also lead to an increased dust mass at low g. We conclude that the constant values derived in Sections 2.3 and 2.4 are sufficient to represent dust formation with metallicity.
One of the main conclusions of the elementary model is that the dust remains a fixed fraction of the metals in the ISM (Edmunds & Eales 1998) which is also echoed here. In Dwek (1980) and E01, this relationship is proposed as which includes the growth of icy mantles on top of the grain cores. Without yet considering mantle growth, the TP model gives which appears a little high. For a solar neighbourhood value gas mass of , we obtain a gas-to-dust ratio of . The observed value is thought to be closer to 150 so this is well within observational errors of a factor . It is expected that mantle growth onto the grain cores in the dense ISM needs to be considered before a more realistic comparison can be made. This leads to more complications as such a model will need understanding of mantle destruction and of the dense cloud fraction of the ISM in different galaxies (E01).
4 Dust Production In Early Galaxies


The earliest stages of star formation remain a mystery, but one important factor is likely to be the role of dust. The first heavy elements could not have been created until the first stars were formed, but how and when did dust formation turn itself on? Studying high redshift galaxies and the obscuration effects of dust at these epochs should provide some answers. Some differences between early galaxies and our own are quite obvious, these galaxies will certainly have higher temperatures and higher supernova production rates than that found in the Milky Way. Conditions at these earlier times, may have not been right for the accretion of mantles within the ISM with higher grain destruction rates. The primary source of dust cores here would be Type II SNe, introducing heavy elements into the ISM on timescales of yrs (if SNe are important as dust formation sites).
When modelling early galaxies we can no longer rely on the instantaneous recycling assumption as used in Section 3.1 to describe the dust production in stars. To be thorough, we require the detailed modelling of dust from stars using yield calculations and the variation with metallicity of the condensation efficiency in stars (Section 2.5). From Section 3, we can model dust in early galaxies using Equation 18 where , and are now the condensation efficiencies. The first term corresponds to the dust produced from recycled yields in stellar winds, the second the dust from freshly synthesised elements produced in massive stars and the third from freshly synthesised carbon in IMS stars with . Equation 18 was solved numerically with the code described in Section 3.
| (18) | |||||


We can compare with another dust evolution model (Hirashita et al, 2002) which represents a young starburst galaxy, SBS 0335-052 with a star formation rate of (Figure 8 - note that this only shows the contribution from SNe dust). The model presented here predicts a similar increase in dust mass with time but is offset due to a difference in the average term chosen (taken conservatively in our case to be for ) and the yields from massive stars (in this work taken from Maeder (1992)). An indicative dust mass derived from fitting a two component temperature model to the IRAS and ISO observations of SBS 0335-052 gives (Dale et al, 2001). The published errors in estimating the flux emitted and the temperatures of the dust are per cent leading to large uncertainties in the dust mass derived. As a guide, the model presented here cannot produce this amount of dust until yrs instead of Myrs from the Hirashita model. This is still consistent with the observed age of the starburst modelled in Hirashita et al (2002).
Our predictions for an arbritrary galaxy with gas mass and star formation rate of () are shown in this Section. This represents galaxies similar to the Milky Way in which the gas mass fraction reaches 15 per cent after Gyrs. The delay from long lived stars returning dust to the ISM is evident in Figure 9 with significant dust production only seen for 2Gyrs. Even if the condensation efficiency is increased from 0.16 to 0.45 which is the maximum value of allowed (i.e. 45 per cent of all returned metal mass in stellar winds is in the form of dust), we still only have appreciable dust mass after 2 Gyrs. Increasing the SFR rate by five times will result in a higher dust mass at a given time, but the delay from stars is still visible (Figure 10). SNe create more dust from a higher SFR, but we still have the delay from SW’s. From Figures 9 & 10 we can clearly see that for significant dust to be available in metal poor, young galaxies it must come from SNe unless star formation rates are very high. This is further highlighted when mapping redshift onto time for different cosmologies as seen in Figure 11.
To map redshift with time we need to know the cosmology i.e. the values of and . Currently popular values are 0.3 and 0.7 respectively (i.e. a flat universe with nonzero cosmological constant). Other scenarios include and (again flat but with zero cosmological constant) or and (i.e. an open universe). The age of the universe can be calculated from these models using,
| (19) |
where is the Hubble constant (chosen here to be - for a higher the corresponding time for a given redshift is lower) and for the simplest cases Equation 19 reduces to
and
We arbitrarily start star formation at years
corresponding to a redshift of 10 for 1, 0 cosmology and 14 for 0.3,
0.7 model. It is believed that the first generation of star formation may
lie between z = 10 - 15 (Mackey et al, 2002) and it allows us to ’push’ the time
available for dust formation. The evolution of grain core mass with time/redshift
starting from years is plotted in Fig 11. These
figures clearly show that for the different
cosmologies given and a SFR efficiency of 0.24 (corresponding to a SFR of
for a galaxy),
we require redshifts of less than 2, 8, or 4 respectively for dust
production in stellar winds to be
significant (i.e. when the dust mass fraction of the ISM (y) is
or alternatively when dust mass for the above system is ). Even if the
the condensation effciency in stellar winds is increased to 80 per
cent, we obtain similar results, Fig 11 (c). The amount of dust mass produced
depends more on the coefficient of the star formation rate than
as shown in Figure 10.
Indeed if the SFR efficiency is 2.5 ( for this
system), dust production in winds reaches this level at redshifts less
than 10, 30, 11 for the given cosmology (note: if is
actually 0.16 as proposed here then the ability to form dust is even harder -
significant dust production would require for ,
and ).
So if present cosmology is to be believed we may have a problem for the
creation of dust in these high redshift ’dusty’ galaxies where z could
be as large 10 (Eales et al, MNRAS submitted, 2002). Dusty AGN are
certainly seen out to
redshifts (Robson et al, 2002). If no dust is produced in SNe
then to observe such galaxies we must set the condensation
efficency in winds at the maximum estimate () and have a high
star formation efficiency .
If this is not the case
then significant dust is not available until . If we
assume that dust is heated in regions of intense star formation by
massive stars then we may relate the observed FIR luminosity from high
redshift sources to the current SFR of massive stars ().
The flux densities reached in such observations suggest
that SFR’s in the early Universe could be as high as
(Gear et al, 2000). With a galactic gas mass
of order , a SFR as high as this could only sustain
itself for about years. For the most massive galaxies
observed (), a SFR of
(e.g. Scott et al, 2002), represents a star
formation efficiency, k of and is equivalent to our nominal
galaxy with and SFR =
. So although we have high SFR’s inferred from
SCUBA sources, this is not enough to explain the dust seen in high
redshift galaxies, instead we require a high star formation efficiency.
5 Lines of Sight
To determine the observational properties of these early galaxies we need to know how soon they become optically thick due to the dust that they are manufacturing. Detailed modelling is beyond the scope of the present work, and here we simply ask two questions. The first question is - what is the average optical depth seen when looking at the galaxy? i.e. would we be able, on average, to see right through the galaxy? If the absorption is clumpy can we still see deep into/through most of the galaxy? This will have a considerable influence on the galaxy’s evolving optical and near-UV appearance. The second question is - what is the typical optical depth to those parts of the galaxy where most of the radiated energy is being generated? i.e. what is the optical depth to where young massive stars are? This will determine whether the bulk of energy is actually re-radiated at far-infrared wavelengths. Much fuller methodS for considering escape and absorption of radiation in a clumpy dusty environment are given by Városi & Dwek (1999) and Gordon et al (2001), but for an order-of-magnitude estimate here we just consider the optical depths through a cloud of fixed mass, divided in various ways. We start off with a single (protogalactic) gas cloud of mass , radius, . The optical depth through the cloud is given by
For the closed box model, with yield and fraction of heavy elements incorporated into dust, (, ) we obtain,
| (20) |
For of order unity i.e. evolution of gas fraction from 1 to 0.8, can be well approximated by . In Table 4 we give some examples of the optical depth for a protogalactic cloud with mass and radius 10kpc. Equation 20 gives the optical depth for a galaxy regarded as a single uniform cloud. Suppose that we now divide this cloud up into N smaller clouds each with mass and radius r. The optical depth of an individual cloud is now
The behaviour for different mass-radius relations of interstellar clouds is interesting and essentially well known, . Uniform density clouds would have and the optical depth from Equation 21 would decrease with divison. For clouds divided, but remaining in approximate virial equilibrium, (the Larson relation, e.g. see references in Ashman & Zepf, 2001) and the optical depth of an individual cloud does not change with division. For clouds in free-fall (with a structure), and the optical depth of an individual cloud increases with division.
| 0.99 | 0.95 | 0.90 | 0.80 | 0.50 | |
| 1/100 | 1/20 | 1/10 | 1/5 | 2/3 | |
| 0.15 | 0.75 | 1.35 | 2.68 | 5.20 |
From the mass-radius relation, hence
| (21) |
Now to answer the first question posed earlier - what is the mean optical depth through the galaxy? The answer is obvious, since the mass of dust remains the same, but it is instructive to follow a simple binomial distribution argument. If the N clouds each have radius, and are randomly distributed through a galaxy of radius, , then (neglecting geometric factors) the chance of a line of sight through the galaxy intercepting a particular cloud is
| (22) |
The probability of exactly n clouds being intercepted if there is a total of N is the binomial distribution (with )
which has a , and variance . The mean optical depth, is therefore ,
as expected and independent of the number of clouds. The variance is , tending to as N becomes large.
We can now sketch the early opactity evolution of a galaxy as it fragments into star forming clouds. The average optical depth through the galaxy will have a typical value in the visible of until the metallicity has risen above solar (Table 4). The individual clouds however, will rapidly become optically thick, even at abundances of 1/100 solar, provided the mass-radius exponent is less than 2. As an example, at solar, if and the mass of a typical cloud is as high as , then N is of the order (Equation 21) and . Star formation is likely to occur in the centres of these clouds, so extensive processing of radiation into the IR will take place if the visual and UV optical depth out of the clouds is greater then one. Most of the radiation will come from massive stars, and indeed McKee & Tan (2002) have suggested (in present day galaxies) that a mass column density of order is needed for formation of the massive stars. The surface density of our fiducial cloud is given by
so with , dividing into N clouds gives
Evidently the suitable densities might never be reached if was equal to or around the value of 2, but with gravitational collapse in the clouds its value will be lower and we can see that densities high enough for massive clouds will be approached, e.g. for as soon as (corresponding to masses of order ). Such clouds would become optically thick as soon as the metallicity reaches above 1/100 solar, which answers our second question.
So we have a very elementary model of a gas cloud which fragments, forming stars at the dense centers of the sub-clouds. The optical depth from the massive stars outwards rapidly becomes large enough to reprocess the bulk of radiation into the IR, even when the heavy element enrichment is low (1/100 solar) - provided, of course, that about 40 per cent of the interstellar metals are in the form of dust. The average optical depth through the galaxy can, however, remain low at , where until the metallicity exceeds about 1/10 solar.
When will the optical depths decrease again? A major process will be the dispersal of clouds due to the effects of massive stars (e.g. Whitworth 1979, Matzner 2000) on timescales of a few years. Global winds may pull dust out of the galaxy and (perhaps relevant to elliptical galaxies) will fall below 1 again, once is less than 0.02.
Overall, it is clear that the high IR and sub-mm flux from high redshift star forming galaxies is not suprising - there is ample dust available, provided the incorporation of heavy elements into dust is a fairly rapid process. Either SNe are a major source of dust cores and/or star formation rates are very high.
6 Discussion and Conclusions.
We conclude:
-
•
Published studies indicate the nucleation conditions for dust formation are only reached in stars during their last (and shortest) evolutionary stage (TPAGB for IMS and AGB/superwind phase for ). It appears that it may be easier to form carbon dust than silicates.
-
•
In the study of dust in early galaxies a crucial unknown is the relative contribution of SNe and stellar winds. SNe could inject dust instantaneously into the ISM whereas SW’s (unless from previously unidentified massive star wind sources) must be delayed because of chemical evolution and stellar lifetimes. Galactic dust suggests about equal contributions at the present day (E01). By considering current model atmospheres and stellar evolution tracks we conclude:
-
–
The normalised dust condensation efficiency in stellar winds can be set at a maximum of 45 per cent for solar metallicity, although we believe this may be much lower (around 16 per cent). Dust production will be still lower at lower metallicities.
-
–
In searching for dust formation sites it is likely that the TPAGB phase of IMS stars is the most promising site for dust formation in stellar winds. It would be interesting to find if an equivalent stage actually exists for massive stars.
-
–
-
•
There is no difficulty in producing highly dusty galaxies at redshifts above 5 if SNe are an important contributor to interstellar dust. If grain core destruction is mainly a result of SNe shocks the process cannot be efficient if grains from the source are to survive. We note that we have ignored dust destruction mechanisms in this initial model, believing (E01) that such mechanisms may not be efficient and require an extended timescale (yr) before they can significantly alter the grain core content of the ISM. Further studies will be required to demonstrate this is indeed so.
-
•
If SNe are not a dominant dust source, significant dust masses can only be generated at redshifts above 5 by galaxies with very high star formation rates.
-
•
High star formation rates required for significant dust production at high redshifts are however consistent with the SFR required to give the observed FIR luminosities, producing a consistent picture.
-
•
The average visual optical depth seen in a galaxy with 40 per cent of the interstellar metals in the form of dust will be less than 1 until a metallicity of solar is reached. The optical depths seen in individual star forming clouds can however reach values greater than 1 at very low metallicites (1/100 solar), provided that the mass-radius exponent of molecular clouds is less than 2. The mass-radius relation is instrumental in determining the optical depth observed in high redshift galaxies if dust is present. In a typical early galaxy the visual optical depth through it would be patchy (, with a few), allowing glimpses of emerging star forming regions, while most of the radiation from the stars would emerge at IR wavelengths.
In answer to the questions posed in Section 1, the source of dust at high redshift may be attributed to stars only if there are high enough star formation rates and condensation efficiencies. It appears however, that SNe dust must be required if dust is present at redshifts greater than 10. Whether this is an efficient process or not will be addressed in future work. Reduction of SCUBA data of young SNR’s will start shortly, with maps at 850 and 450 and available radio data providing a direct comparison between the emission from dust and from any synchrotron emission from relativistic electrons. This work will hopefully provide an estimate of an upper limit of any dust present and a condensation efficiency of SNe. Next steps include: (1) using the modified elementary model to examine the composition and size distribution of dust and its evolution (2) using the dust masses expected in early galaxies to examine the implications for molecular formation onto grains in the ISM (3) theoretical work on dust nucleation in SNe.
We would encourage more extensive modelling of dust formation processes particularly in stellar atmospheres with inhomogeneities and in a wider variety of stars.
Acknowledgements
HM would like to aknowledge a departmental grant from the University of Wales, Cardiff. We would like to thank Loretta Dunne for invaluable comments on the draft manuscript and Steve Eales and Tim Waskett for extremely interesting and informative discussions. We also thank the referee, Eli Dwek for invaluable comments and his help in clarifying this work.
References
- [1] Almaini, O., Lawrence, A., Boyle, B.J., MNRAS, 305, L59, 1999.
- [2] Arendt, R.G., Dwek, E., Moseley, S.H., preprint (astro-ph/9901042).
- [3] Ashman, K.M., & Zepf, S.E., AJ, 122, 1888, 2001.
- [4] Blöcker, T., A & A, 297, 727, 1995(a).
- [5] Blöcker, T., A & A, 299, 755, 1995(b).
- [6] Bode, M.F., in Dust in the Universe, eds. M.E.Bailey & D.A. Williams, P73, Cambridge University Press, Great Britian, 1988.
- [7] Brown, J.A., Johnson, H.R., Alexander, D.R., Cutright, L.C., Sharp, C.M., A & A, 277, 578, 1993.
- [8] Cadwell, B.J., Wang, H.A.I., Feigelson, E.D., Frenklach, M., ApJ, 429, 285, 1994.
- [9] Clayton, D.D., Deneault, E.A-N., Meyer, B.S., ApJ, 562, 480, 2001.
- [10] Dale, D.A., Helon, G., Neugebauer, G., Soifer, B.T., Frayer, D.T., Condon, J.J., AJ, 122, 1736, 2001.
- [11] Dominik, C., Sedlmayr, E., Gail, H.P., A & A, 277, 578, 1993.
- [12] Douvion, T., Lagage, P.O., Cesarsky, C.J., Dwek, E., A & A, 373, 281, 2001a.
- [13] Douvion, T., Lagage, P.O., Pantin, E., A & A, 369, 589, 2001b.
- [14] Dwek, E., ApJ, 501, 643, 1998.
- [15] Dwek, E., & Arendt, R.G., ARA & A, 30, 11, 1992.
- [16] Dwek, E., & Scalo, J.M., ApJ, 239, 193, 1980.
- [17] Edmunds, M.G., MNRAS, 328, 223,2001.
- [18] Edmunds, M.G., & Eales, S.E., MNRAS, 299, L29, 1998.
- [19] Frayer, F., & Scoville, P., preprint (astro-ph/9912114).
- [20] Fujii, T., Nakada, Y., Pathasarath, M., in Post AGB Objects as a Phase of Stellar Evolution, eds. R. Szczerba & S.K. Gornysk, Astrophysics and Space Science Library, Vol. 265, 111, Kluwer Academic Publishers, Netherlands, 2001.
- [21] Garcia-Lario, P., & Pera Calderon, J.V., in Post AGB Objects as a Phase of Stellar Evolution, eds. R. Szczerba & S.K. Gornysk, Astrophysics and Space Science Library, Vol. 265, 339, Kluwer Academic Publishers, Netherlands, 2001.
- [22] Gear, W.K, Lilly, S.J., Stevens, J.A., Clements, D.L., Webb, T.M., Eales, S.A., Dunne, L., MNRAS, 316, 51, 2000.
- [23] Gehrz, R., in IAU Symp. 135, Interstellar Dust, eds. L.J. Allomandola & A.G.G.M. Tielens, P445, 1989.
- [24] Gordon, K.D., Misselt, K.A., Witt, A.N., Clayton, G.C., ApJ, 551, 620, 2001.
- [25] Groenewegen, M.A.T., in IAU Symp. 191, Asymptotic Giant Branch Stars, eds T. Le Bertre., A. Lebre & C., Waelkens, P535, 1999.
- [26] Harper, G.M., Brown, A., Lim, J., ApJ, 551, 1073, 2001.
- [27] Hauschildt, P.H., Allard, F., Baron, E., ApJ, 512, 377, 1999a.
- [28] Hauschildt, P.H., Allard, F., Ferguson, J., Baron, E., Alexander, D.R., ApJ, 525, 871, 1999b.
- [29] Henry, R.B.C., Edmunds, M.G., Köppen, J., ApJ, 541, 660, 2000.
- [30] Herwig, F., Blöcker, T., Dreibe, T., preprint (astro-ph/9912350).
- [31] Hirashita, H., Hunt, L.K., Ferrara, A., preprint (astro-ph/0201112).
- [32] Jørgensen,U.G., Johnson, H.R., Nordlund, Å., A & A, 261, 263, 1992.
- [33] Köppen, J., & Edmunds, M.G., MNRAS, 306, 317, 1999.
- [34] Kosaza, T., Hasegawa, H., Nomoto, K., Paper I, ApJ, 344, 325, 1989.
- [35] Kosaza, T., Hasegawa, H., Nomoto, K., Paper II, ApJ, 249, 474, 1991.
- [36] Lamers, H.J.G.L.M., & Cassinelli, J.P., An Introduction to Stellar Winds, 46, Cambridge University Press, Great Britian, 1999.
- [37] Lorenz-Martins, S., de Arainjo, F.X., Codina Landaberry,S.J., de Almeda, W.G., de Nader, A & A, 367, 189, 2001.
- [38] Lucy, L.B., Danziger, I.J., Gouiffes, C., Bouchet, P., Dust Condensation in the Ejecta of SN1987A, II, in Supernovae, Proceedings of the Tenth Santa Cruz Summer Workshop in Astronomy and Astrophysics, ed. S.E.Woosley, 82, Springer-Verlag, 1991.
- [39] Mackey, J., Bromm, V., & Hernquist, L., pre-print (astro-ph/0208447).
- [40] Maeder, A., A & A, 264, 105, 1992.
- [41] Marchenko, S.V., Moffat, A.F.J., Vacca, W.D., Côté, S., Doyon, R., ApJ, 565, L59, 2002.
- [42] Marigo, P., A & A, 338, 209, 1998.
- [43] Marigo, P., preprint (astro-ph/0012181).
- [44] Marigo, P., Bressan, A., Chiosi, C., A & A, 313, 545, 1996.
- [45] Marigo, P., Girardi, L., Bressan, A., A & A, 344, 123, 1999.
- [46] Matzner, C.D., ApJ, 566, 302, 2002.
- [47] McKee, ,C.F., Tan, J.C., pre-print (astro-ph/0206037).
- [48] Molster, F.J., Yamamura, I., Wates, L.B.F.M., Nyman, L.A., Kaufl, H.U., de Jong, T., Loup, C., A & A, 366, 923, 2001.
- [49] Pagel, B.E.J., Nucleosynthesis & the Chemical Evolution of Galaxies, Cambridge University Press, Great Britian, 1997.
- [50] Plez, B., Brett, J.M., Nordlund, A., A & A, 256, 551, 1992(a).
- [51] Plez, B., A & AS, 94, 527, 1992(b).
- [52] Pols, O.R., Tout, C.A., Eggleton, P.P., Han, Z., pre-print (astro-ph/9504025).
- [53] Renzini, A., & Voli, M, A & A, 94, 175, 1981.
- [54] Robson, I., Priddey, R., Isaak, K., McMahon, R., Pearson, T.J., Fox, M.C., Ivison, R., in Active Galactic Nuclei: from Central Engine to Host Galaxy, eds. S. Collins, F. Combes & I. Shlosman, ASP Conference Series (to be published), P.80, 2002.
- [55] Salpeter, E.E., ApJ, 193, 579, 1974.
- [56] Schaerer, D., Meynet, G., Maeder, A., Paper II, A & AS, 98, 523, 1993.
- [57] Schaller, G., Schaerer, D., Meynet, G., Maeder, A., Paper I, A & AS, 96, 269, 1992.
- [58] Schaller, G., Schaerer, D., Meynet, G., Maeder, A., Charbonnel, C., Paper IV, A & AS, 102, 329, 1993.
- [59] Schönberner, D., & Steffan, M., in Post AGB Objects as a Phase of Stellar Evolution, eds. R. Szczerba & S.K. Gornysk, Astrophysics and Space Science Library, Vol. 265, p85, p113, Kluwer Academic Publishers, Netherlands, 2001.
- [60] Scott, S.E. et al, MNRAS, 331, 817, 2002.
- [61] Talbot, R.J.Jr., Arnett, W.D., ApJ, 186, 51, 1973.
- [62] Tielens, A.G.G.M., ApJ, 499, 267, 1998.
- [63] Tinsley, B.M., Fund. Cosmic. Phys., 5, 287, 1980.
- [64] Thomas, R.C., Kantowski, R., preprint (astro-ph/0003463).
- [65] Todini, P., & Ferrara, A., MNRAS, 325, 726, 2001.
- [66] Trams, N.R., Th. van Loon, J., et al, A & A, 344, L17, 1999.
- [67] Waskett, T.J., et al., accepted, MNRAS, 2003 (astro-ph/0.01610).
- [68] Weidermann, V., A & A, 188, 74, 1987.
- [69] Willson, L.A., Ann.Rev.Astron.Astrophys, 38, 573, 2000.
- [70] Whittet, D.C.B., Dust in the Galactic Environment, IOP Publishing, Great Britian. 1992.
- [71] Whitworth, A.P., MNRAS, 186, 59, 1979.
- [72] Wooden, D., in Astrophysical Implications of the Laboratory Study of Presolar Materials, eds. T.J.Bernatowicz & E.K.Zinner, AIP Conference 402, 317, 1997.
- [73] Woosley, S.E., & Weaver, T.A., ApJS, 101, 181, 1995.
- [74] Yorke, H.W, in Dust in the Universe, eds. M.E.Bailey & D.A. Williams, P355, Cambridge University Press, Great Britian, 1988.
- [75] Young, P.A., Mamajek, E.E., Arnett, D., Liebert, J., preprint (astro-ph/0103390).
- [76] van den Hoek, L.B., & Groenewegen, M.A.T., A & A Supp, 123, 1997.
- [77] Városi, F., Dwek, E., ApJ, 523, 265, 1999.