A MEDIUM DEEP CHANDRA AND SUBARU SURVEY OF THE 13HR XMM/ROSAT DEEP SURVEY AREA
Abstract
We present the results of a Chandra ACIS-I survey of a high latitude region at 13h +38 which was earlier observed with ROSAT (McHardy et al. 1998) and which has recently been observed by XMM-Newton for 200ksec. XMM-Newton will provide good quality X-ray spectra for over 200 sources with fluxes around the knee of the logN/logS, which are responsible for the bulk of the X-ray background (XRB). The main aim of the Chandra observations is to provide arcsecond, or better, positions, and hence reliable identifications, for the XMM-Newton sources. The ACIS-I observations were arranged in a mosaic of four 30ksec pointings, covering almost all of the radius XMM-Newton/ROSAT field. We detect 214 Chandra sources above a Cash likelihood statistic of 25, which approximates to significance, to a limiting flux of ergs cm-2 s-1 ( keV).
Optical counterparts are derived from a Subaru SuprimeCam image reaching to . The very large majority of the Chandra sources have an optical counterpart, with the distribution peaking at , although 14 have no counterpart to . The fraction of X-ray sources with no identification brighter than is similar to that found in deeper Chandra surveys (eg Hornschemeier et al. 2001; see Alexander et al. 2001 for a detailed discussion of X-ray sources with faint optical identifications).
The majority of the identifications are with galaxies. As found in other Chandra surveys, there is a very wide range of optical magnitude for given X-ray flux, implying a range of emission mechanisms, and many sources have high ratios, implying absorption at moderate redshift.
Comparison with the earlier ROSAT survey shows that the accuracy of the ROSAT positions agrees very well with the predictions from simulations in McHardy et al. (1998) and that the large majority of the identifications were correct.
keywords:
X-ray background, QSOs, emission line galaxies, clusters of galaxies.1 Introduction
The deepest surveys with ROSAT (eg Hasinger et al. 1998; McHardy et al. 1998) have resolved almost all of the soft ( keV) X-ray background (XRB). However the bulk of the energy in the XRB lies at significantly higher energies ( keV) and so we must discover which objects dominate the X-ray sky at energies above the ROSAT band if we are to properly understand the XRB. Very deep surveys with the Chandra X-ray Observatory (Weisskopf et al. 1996), eg Mushotzky et al. (2000), Giacconi et al. (2001, 2002), Hornschemeier et al. (2000, 2001), Brandt et al. (2001a, 2001b), have now resolved almost all of the background in the keV band (hereafter referred to as the medium energy band). A compilation of recent and historical measurements by Moretti et al. (2003) conclude that and per cent of the and keV XRB is due to discrete sources. These observations have revealed that faint X-ray sources are a far from homogenous population. The Chandra surveys, for example, contain a mix of broad line AGN together with very faint () objects of unknown type (Alexander et al. 2001), galaxies with only narrow optical emission lines (NELGs) and some bright () optically inactive galaxies (Mushotzky et al. 2000). The major question now is, what is the nature of these various classes of X-ray source, eg what is their X-ray emission mechanism? how important is absorption? It is also of great interest to know if there are further classes of emitter which are important at energies above the Chandra band.
X-ray spectra provide one of the best diagnostics of the X-ray emission mechanism and so, with XMM-Newton (Jansen et al. 2001) we have made a 200ksec observation, using the EPIC cameras (Lumb et al. 2000), of an area which we observed earlier with ROSAT (McHardy et al. 1998). XMM-Newton was specifically designed for spectral investigations and covers the wide band keV. At lower energies it has the throughput of Chandra and its upper energy bound is keV higher than that of Chandra, making it particularly useful for the study of obscured AGN, much quoted as being the likely major contributors to the XRB (eg Setti & Woltjer 1989; Wilman & Fabian 1999; Gilli et al. 2001).
The centroid of the survey area is at RA 13 34 37.0 Dec +37 54 44 (J2000), in a region of sky of extremely low obscuration ( cm-2; see McHardy et al. 1998 for details). It is very well observed in other wavebands, eg radio (Gunn et al. 2003), optical (Section 3) and near infrared. In addition, a very deep mid/far infrared observation will be made with SIRTF (Fanson et al. 1998) by Rieke and colleagues. Preliminary results from our XMM-Newton observation are presented by Page et al. (2003) and detailed results will be presented elsewhere (Mason et al. in preparation).
At the faint X-ray flux limits of our XMM-Newton observation ( ergs cm-2 s-1 , keV) we expect many identifications with very faint () optical counterparts (eg Giacconi et al. 2001; Hornschemeier et al. 2001). As the surface density of such objects is high, we require the best possible X-ray positions to avoid ambiguity in the identifications. Although XMM-Newton positions are quite reasonable ( for the highest significance sources, falling to at significance, after correction for systematic offsets), they are not adequate, as we shall quantify in Section 4.2, for unambiguous optical identification at the flux limit of our survey. However Chandra positions for sources close to the pointing axis have sub-arcsecond accuracy. We have therefore made four Chandra ACIS-I observations of the radius XMM-Newton field to provide improved positions for the XMM-Newton sources. In the soft ( keV) band, the XMM-Newton source density ( per square degree above significance in the centre of the field) is close to the XMM-Newton confusion limit. The Chandra observations also allow us to resolve almost all areas of confusion in the XMM-Newton images.
In this paper we present the Chandra observations (Section 2). Our large area coverage compared to single-pointing Chandra surveys, at fluxes around the knee in the medium energy logN/logS source distribution (Rosati et al. 2002), provides an excellent sample of the sources which contribute the bulk of the XRB. Later papers will deal with the astrophysics of the various classes of sources which contribute to the medium energy XRB, and to the relationship between those classes and the faint source populations in other bands, eg radio (cf Gunn et al. 2003). The main aim of the present paper is to provide the accurate positions and good optical identifications required for all later investigations.
Excellent optical coverage is provided by a Subaru SuprimeCam image of almost the whole X-ray area to (Section 3). Thus we are able to place stringent limits on the magnitudes of any Chandra sources with no optical identification. The identification content of the survey is discussed in Section 4, including a discussion of the likely contribution of obscured AGN. The Chandra observations also enable us to comment on the accuracy of the positions from our earlier ROSAT survey, which we find to be remarkably good, and to clarify which identifications were correct (Section 6), confirming many of the narrow emission line galaxies (NELGs).
2 Chandra Observations
2.1 Observational Details
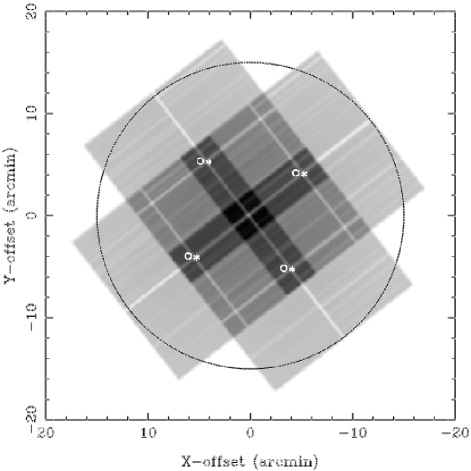
In order to cover the large majority of the XMM-Newton (and ROSAT) field at small Chandra off-axis angles, four pointings were made with the ACIS-I instrument. The observations were made consecutively and the roll angle of the observations are identical to within providing the coverage pattern shown in Fig. 1. The log of observations is listed in Table 1. The observations were postponed to avoid a large solar flare and then took place in relatively low background conditions. We used the ‘very faint’ observational mode111http://hea-www.harvard.edu/alexey/vf_bg/vfbg.html in which a 55 pixel array is read out around every event, allowing better photon/cosmic ray discrimination than in the standard 33 pixel ‘faint source’ readout mode.
There is a known positional offset for any Chandra observation which depends on the roll angle. For our roll angle that offset is RA=+ and Dec=+. These offsets were applied to the data before undertaking the source fitting procedure.
| Field | Sequence | Observation | Chandra | Roll | Exposure | |
|---|---|---|---|---|---|---|
| Number | Number | Date | RA | Dec | Angle | (ksec) |
| 1 | 900063 | 8 June 2001 | 13 34 13.06 | +37 58 46.0 | 232.20 | 30.18 |
| 2 | 900064 | 9 June 2001 | 13 35 06.19 | +37 50 34.7 | 232.20 | 30.18 |
| 3 | 900065 | 9 June 2001 | 13 35 00.43 | +37 59 54.7 | 232.20 | 28.53 |
| 4 | 900062 | 8 June 2001 | 13 34 18.91 | +37 49 25.9 | 232.20 | 30.39 |
2.2 Source Searching
By comparison with the background spectrum we determined that the band between 0.5 and 7.0 keV provides the optimum signal/noise for selection of typical sources and so ACIS images were made, and searched, in that band. Our source detection code is based on the algorithm of Cash (1979). The procedure involves a maximum likelihood process, fitting the PSF of the detector to the photon distribution and provides the best possible source positions (see Section 4.1). Details of the procedure are given in McHardy et al. (1998).
For the present Chandra observations we have customised the source fitting software to take account of the variation of PSF with off-axis angle although, for computational simplicity, we assume a circular PSF rather than the roughly elliptical PSF which occurs at high off-axis angles. We have made a simultaneous fit to the data from all four ACIS-I pointings, taking account of the different PSFs that may therefore apply at any particular sky position, to produce a single probability map of the sky. This procedure makes optimum use of all data. Objects are associated with peaks in the map of Cash statistic over the field. We set the detection limit at which corresponds approximately to a detection. The resulting catalogue, comprising 214 sources, is given in Table 2.
| Column | |
|---|---|
| [1] | Chandra flux-ordered source number. |
| [2] | Whether there is an alternative optical candidate. |
| ‘U’- the true identification is uncertain. | |
| ‘P’- the primary identification listed in Table 2 | |
| is probably correct. See Appendix A for details. | |
| [3] | 0.5-7.0 keV flux in units of ergs cm-2 s-1 |
| [4] | Cash value for the Chandra source. |
| [5,6] | RA and Dec (J2000) of the Chandra centroid. |
| Column | |
|---|---|
| [7,8] | Optical - Chandra offset (in that sense), in RA and Dec, of the optical counterpart listed in Table 2. |
| [9] | Total Optical - Chandra offset (arcsec). |
| [10] | -band magnitude of the optical counterpart. |
| [11] | Chandra off-axis angle of the source (arcmin). |
| [12] | XMM off-axis angle of the source (arcmin). |
| [13,14] | FWHM (arcsec) and stellarity of the optical counterpart. |
Notes to individual sources are at the end of the Table.
| Num | Alt | Flux | Chandra | R | OffC | OffX | FWHM | Stellar | |||||
|---|---|---|---|---|---|---|---|---|---|---|---|---|---|
| RA (J2000) Dec | (′′) | (′′) | (′′) | (mag) | (′) | (′) | (′′) | ||||||
| ¶1 | 800.53 | 45497.4 | 13:34:51.43 | 37:46:19.10 | 0.58 | 0.60 | 0.83 | 13.8 | 5.47 | 8.89 | 0.90 | 1.00 | |
| 2 | 85.00 | 1337.7 | 13:33:42.28 | 38:03:35.87 | 1.10 | 0.32 | 1.15 | 18.8 | 7.89 | 13.95 | 1.16 | 1.00 | |
| 3 | 80.15 | 3770.6 | 13:34:31.35 | 37:48:31.49 | -0.17 | -0.10 | 0.20 | 20.8 | 2.40 | 6.31 | 0.94 | 0.85 | |
| 4 | 69.36 | 1766.2 | 13:33:59.91 | 37:49:12.08 | 0.09 | -0.31 | 0.33 | 17.7 | 4.07 | 9.18 | 1.91 | 0.03 | |
| 5 | 67.98 | 3858.3 | 13:34:17.55 | 37:57:22.63 | -0.15 | -0.18 | 0.23 | 18.6 | 1.66 | 4.66 | 2.56 | 1.00 | |
| 6 | 63.64 | 928.7 | 13:35:29.77 | 38:04:32.61 | -0.96 | -0.47 | 1.07 | 19.5 | 7.06 | 14.29 | 1.10 | 0.66 | |
| 7 | 59.73 | 1485.8 | 13:33:58.55 | 37:59:38.48 | 0.25 | -0.18 | 0.31 | 21.1 | 3.24 | 9.03 | 0.92 | 0.98 | |
| 8 | 58.86 | 3775.9 | 13:34:38.08 | 37:56:03.88 | 0.03 | 0.17 | 0.17 | 20.0 | 5.44 | 1.35 | 1.18 | 0.03 | |
| 9 | 55.02 | 2821.5 | 13:34:10.63 | 37:59:56.14 | 0.16 | 0.19 | 0.25 | 19.6 | 1.28 | 7.35 | 1.19 | 0.19 | |
| 10 | 48.73 | 1972.8 | 13:34:41.83 | 38:00:11.36 | 0.15 | -0.14 | 0.21 | 18.4 | 3.97 | 5.54 | 1.41 | 0.03 | |
| 11 | 48.65 | 1912.2 | 13:34:46.94 | 37:47:48.46 | 0.06 | 0.15 | 0.16 | 20.9 | 5.05 | 7.20 | 1.50 | 0.03 | |
| †12 | 48.22 | 761.3 | 13:35:44.70 | 37:51:40.35 | -0.68 | 0.33 | 0.76 | 20.1 | 7.36 | 13.71 | — | — | |
| 13 | 48.15 | 2519.9 | 13:34:47.37 | 37:59:50.10 | 0.36 | -0.10 | 0.37 | 21.5 | 2.89 | 5.50 | 1.02 | 0.87 | |
| 14 | 41.63 | 413.4 | 13:33:32.03 | 37:46:42.06 | -0.15 | -0.86 | 0.88 | 20.4 | 10.00 | 15.14 | 1.01 | 0.98 | |
| 15 | 39.60 | 505.9 | 13:35:35.52 | 37:57:45.86 | -0.56 | 0.11 | 0.57 | 20.2 | 7.00 | 11.93 | 0.91 | 0.98 | |
| 16 | 36.56 | 432.8 | 13:35:25.45 | 38:05:34.30 | -1.14 | -0.54 | 1.26 | 15.7 | 7.18 | 14.43 | 7.22 | 0.69 | |
| 17 | 35.04 | 1096.8 | 13:33:55.81 | 37:52:58.52 | 0.20 | 0.18 | 0.27 | 20.6 | 5.92 | 8.31 | 0.93 | 0.99 | |
| 18 | 34.39 | 1579.5 | 13:34:42.77 | 37:59:15.03 | 0.19 | -0.06 | 0.19 | 19.8 | 3.87 | 4.66 | 0.95 | 0.99 | |
| 19 | 34.03 | 1359.6 | 13:35:15.92 | 37:52:40.72 | -0.04 | 0.01 | 0.04 | 22.2 | 2.52 | 7.95 | 1.25 | 0.06 | |
| 20 | 32.72 | 1652.4 | 13:35:06.21 | 37:49:52.89 | -0.11 | -0.45 | 0.47 | 18.8 | 0.91 | 7.54 | 1.93 | 0.03 | |
| 21 | 32.29 | 1539.3 | 13:35:02.85 | 37:49:56.61 | -0.06 | -0.21 | 0.22 | 22.6 | 1.25 | 7.00 | 1.23 | 0.05 | |
| 22 | 30.84 | 1480.3 | 13:34:52.17 | 37:57:44.71 | -0.04 | -0.05 | 0.07 | 20.1 | 3.03 | 4.24 | 1.27 | 0.17 | |
| 23 | 26.57 | 863.5 | 13:34:01.04 | 37:54:04.97 | 0.09 | 0.02 | 0.10 | 21.6 | 5.54 | 7.12 | 0.95 | 0.98 | |
| 24 | 26.50 | 222.3 | 13:33:34.06 | 37:45:47.80 | -0.08 | -0.35 | 0.36 | 20.0 | 9.92 | 15.32 | 0.98 | 0.98 | |
| ¶25 | 26.35 | 546.0 | 13:34:08.76 | 38:03:49.42 | 0.28 | 0.08 | 0.30 | 14.9 | 5.03 | 10.66 | 0.90 | 1.00 | |
| 26 | 25.27 | 1287.4 | 13:34:36.40 | 37:55:56.85 | 0.07 | 0.22 | 0.23 | 21.0 | 5.23 | 1.22 | 1.41 | 0.03 | |
| 27 | 25.20 | 378.3 | 13:33:42.90 | 37:56:37.43 | 0.44 | 0.76 | 0.88 | 23.0 | 6.66 | 10.83 | 1.07 | 0.35 | |
| 28 | 24.83 | 1064.4 | 13:34:08.82 | 37:57:06.89 | -0.13 | -0.10 | 0.17 | 22.7 | 2.14 | 6.04 | 0.94 | 0.96 | |
| 29 | 23.67 | 393.0 | 13:33:44.23 | 37:57:52.48 | 0.62 | 0.25 | 0.67 | 20.3 | 6.08 | 10.86 | 1.03 | 0.82 | |
| 30 | 22.59 | 271.7 | 13:35:30.35 | 37:57:49.53 | -0.57 | 0.26 | 0.63 | 20.8 | 6.03 | 10.96 | 0.89 | 0.98 | |
| 31 | 22.52 | 365.3 | 13:35:24.37 | 37:46:14.56 | -0.68 | 0.17 | 0.70 | 22.2 | 5.57 | 12.64 | 1.28 | 0.55 | |
| 32 | 22.44 | 392.9 | 13:35:17.64 | 38:02:47.28 | -0.24 | -0.07 | 0.25 | 21.8 | 4.11 | 11.35 | 1.94 | 0.91 | |
| 33 | 21.86 | 187.2 | 13:34:38.51 | 38:06:26.46 | 0.07 | 0.75 | 0.75 | 17.7 | 7.86 | 11.71 | 1.62 | 0.03 | |
| 34 | 21.36 | 321.3 | 13:35:12.69 | 37:44:18.70 | 0.31 | 1.02 | 1.07 | 20.8 | 6.50 | 12.59 | 1.45 | 0.03 | |
| 35 | 19.77 | 218.9 | 13:35:35.80 | 38:01:49.09 | -1.26 | 0.84 | 1.51 | 22.3 | 6.88 | 13.57 | 1.43 | 0.03 | |
| 36 | 19.19 | 419.7 | 13:35:22.83 | 37:49:11.06 | 0.45 | 0.62 | 0.77 | 22.3 | 3.36 | 10.62 | 2.20 | 0.03 | |
| 37 | 18.82 | 601.2 | 13:35:15.76 | 37:52:16.93 | -0.02 | -0.01 | 0.02 | 24.3 | 2.21 | 8.03 | 1.57 | 0.03 | |
| 38 | 17.52 | 560.0 | 13:34:24.61 | 37:46:15.29 | -0.35 | -0.22 | 0.41 | 20.5 | 3.44 | 8.82 | 1.20 | 0.71 | |
| †39 | 17.45 | 200.7 | 13:35:45.15 | 37:49:57.76 | -0.23 | 0.84 | 0.87 | 18.7 | 7.43 | 14.28 | — | — | |
| 40 | 17.01 | 292.0 | 13:33:48.58 | 37:58:09.01 | 0.13 | 0.02 | 0.13 | 21.6 | 5.19 | 10.14 | 0.98 | 0.97 | |
| 41 | 17.01 | 204.7 | 13:34:22.17 | 38:06:21.00 | 1.39 | -0.60 | 1.52 | 21.2 | 7.57 | 11.98 | 0.91 | 0.98 | |
| 42 | 16.72 | 305.1 | 13:35:12.54 | 38:02:46.95 | -0.64 | -0.10 | 0.65 | 21.2 | 3.41 | 10.67 | 1.60 | 0.88 | |
| 43 | 15.71 | 332.9 | 13:34:02.56 | 37:51:29.53 | -0.16 | -0.20 | 0.26 | 20.5 | 4.01 | 7.53 | 0.92 | 0.98 | |
| 44 | 15.57 | 106.1 | 13:33:24.32 | 37:57:45.36 | -0.10 | 0.04 | 0.10 | 20.8 | 9.98 | 14.64 | 1.64 | 0.03 | |
| 45 | 15.20 | 439.2 | 13:34:34.03 | 38:00:43.48 | 0.35 | -0.17 | 0.39 | 21.5 | 4.23 | 6.02 | 1.11 | 0.76 | |
| 46 | 15.13 | 135.2 | 13:33:43.27 | 37:45:11.12 | 0.56 | 0.76 | 0.95 | 23.6 | 8.57 | 14.28 | 1.24 | 0.76 | |
| 47 | U | 14.99 | 152.3 | 13:33:32.09 | 37:58:15.86 | 0.68 | 0.40 | 0.79 | 24.5 | 8.40 | 13.27 | 2.08 | 0.02 |
| 48 | 14.99 | 272.0 | 13:34:01.16 | 37:46:47.90 | 0.25 | -0.06 | 0.26 | 21.8 | 4.73 | 10.64 | 0.87 | 0.98 | |
| 49 | 14.77 | 123.7 | 13:33:34.49 | 37:49:12.13 | -0.07 | 0.30 | 0.31 | 19.8 | 9.09 | 13.53 | 1.00 | 0.98 | |
| Num | Alt | Flux | Chandra | R | OffC | OffX | FWHM | Stellar | |||||
|---|---|---|---|---|---|---|---|---|---|---|---|---|---|
| RA (J2000) Dec | (′′) | (′′) | (′′) | (mag) | (′) | (′) | (′′) | ||||||
| 50 | 14.19 | 31.3 | 13:33:29.12 | 38:02:18.01 | — | — | — | 27.0 | 9.57 | 15.36 | — | — | |
| 51 | 14.12 | 116.2 | 13:33:38.79 | 37:52:17.23 | 0.04 | 0.55 | 0.55 | 24.4 | 8.65 | 11.74 | 1.53 | 0.17 | |
| 52 | 14.05 | 406.3 | 13:34:03.09 | 37:53:21.83 | 0.30 | 0.12 | 0.32 | 21.7 | 5.09 | 6.83 | 3.24 | 0.03 | |
| 53 | 13.61 | 468.9 | 13:34:45.34 | 37:57:22.65 | 0.26 | 0.15 | 0.30 | 20.5 | 4.25 | 3.11 | 0.89 | 0.98 | |
| 54 | 13.54 | 85.9 | 13:34:11.11 | 37:39:46.85 | -1.65 | -0.01 | 1.65 | 21.9 | 9.99 | 15.81 | 1.42 | 0.07 | |
| 55 | 13.32 | 403.0 | 13:34:31.24 | 37:49:53.14 | -0.08 | -0.24 | 0.25 | 21.7 | 2.15 | 4.98 | 1.21 | 0.32 | |
| 56 | U | 13.10 | 90.7 | 13:33:30.72 | 37:48:15.50 | -0.20 | 1.08 | 1.10 | 24.1 | 9.91 | 14.61 | 1.15 | 0.73 |
| 57 | U | 12.96 | 70.5 | 13:33:20.30 | 37:57:44.85 | 1.23 | 1.14 | 1.68 | 21.8 | 10.77 | 15.41 | 1.58 | 0.03 |
| 58 | 12.96 | 407.0 | 13:34:08.54 | 37:54:41.82 | -0.17 | 0.15 | 0.23 | 23.5 | 4.40 | 5.61 | 1.20 | 0.15 | |
| 59 | 12.38 | 494.6 | 13:34:20.81 | 37:55:01.01 | -0.26 | 0.13 | 0.29 | 20.8 | 4.10 | 3.21 | 1.43 | 0.03 | |
| 60 | 11.58 | 117.2 | 13:34:08.20 | 38:06:28.48 | -1.08 | -0.87 | 1.39 | 23.2 | 7.65 | 13.04 | 5.30 | 0.01 | |
| 61 | 11.44 | 158.8 | 13:35:03.71 | 37:44:09.44 | 0.22 | 0.94 | 0.97 | 22.9 | 6.63 | 11.82 | 1.57 | 0.03 | |
| 62 | 11.44 | 92.6 | 13:33:35.61 | 37:54:00.36 | — | — | — | 27.0 | 9.13 | 12.13 | — | — | |
| 63 | 11.00 | 465.4 | 13:34:18.92 | 37:58:57.24 | 0.03 | -0.13 | 0.13 | 19.9 | 0.85 | 5.52 | 1.45 | 0.02 | |
| 64 | 10.86 | 280.7 | 13:34:52.04 | 37:58:25.88 | 0.04 | -0.32 | 0.32 | 19.8 | 2.56 | 4.74 | 1.54 | 0.04 | |
| 65 | 10.43 | 446.3 | 13:34:46.33 | 37:54:41.23 | 0.15 | 0.15 | 0.21 | 24.0 | 5.78 | 1.84 | 2.94 | 0.02 | |
| 66 | 10.28 | 268.6 | 13:34:11.28 | 37:47:57.51 | -0.11 | -0.42 | 0.44 | 21.8 | 2.44 | 8.47 | 0.89 | 0.98 | |
| 67 | 9.92 | 286.8 | 13:35:14.84 | 37:50:36.78 | 0.22 | 0.02 | 0.22 | 24.6 | 1.41 | 8.53 | 2.16 | 0.01 | |
| 68 | 9.85 | 331.4 | 13:34:08.29 | 37:52:19.70 | -0.03 | 0.12 | 0.12 | 21.4 | 3.64 | 6.15 | 0.91 | 0.97 | |
| 69 | 9.77 | 263.9 | 13:34:31.25 | 38:03:09.86 | 0.40 | -0.18 | 0.44 | 24.9 | 5.36 | 8.51 | 2.47 | 0.08 | |
| 70 | 9.77 | 278.7 | 13:35:00.20 | 37:56:32.75 | 0.13 | 0.32 | 0.34 | 19.7 | 3.55 | 4.92 | 2.14 | 0.06 | |
| 71 | 9.70 | 392.4 | 13:34:27.29 | 37:50:09.88 | 0.00 | -0.18 | 0.18 | 24.0 | 1.47 | 4.95 | 1.04 | 0.85 | |
| 72 | 9.56 | 121.6 | 13:33:53.53 | 38:02:04.52 | 0.48 | 0.39 | 0.62 | 23.5 | 5.21 | 11.28 | 1.21 | 0.16 | |
| 73 | 9.19 | 79.2 | 13:33:37.54 | 37:47:57.28 | -0.33 | 0.38 | 0.50 | 21.2 | 8.63 | 13.56 | 1.20 | 0.04 | |
| 74 | 9.05 | 34.4 | 13:35:04.50 | 37:39:53.56 | 1.46 | 1.03 | 1.79 | 23.5 | 10.87 | 15.81 | 2.06 | 0.03 | |
| 75 | 8.91 | 162.8 | 13:35:14.69 | 37:48:39.31 | -0.02 | -0.41 | 0.41 | 23.5 | 2.50 | 9.61 | 1.81 | 0.03 | |
| 76 | 8.91 | 130.0 | 13:33:48.18 | 37:53:33.84 | 0.65 | 0.13 | 0.66 | 21.3 | 7.48 | 9.70 | 1.83 | 0.03 | |
| 77 | 8.69 | 81.2 | 13:35:19.35 | 37:43:18.08 | -0.51 | 0.49 | 0.71 | 22.9 | 7.79 | 14.17 | 2.42 | 0.03 | |
| 78 | 8.69 | 88.9 | 13:33:46.56 | 38:00:22.24 | 0.14 | -0.10 | 0.17 | 24.3 | 5.71 | 11.42 | 2.52 | 0.01 | |
| 79 | 8.69 | 84.2 | 13:33:42.48 | 37:50:27.40 | 0.03 | -0.57 | 0.57 | 23.9 | 7.55 | 11.58 | 1.60 | 0.05 | |
| 80 | 8.69 | 273.4 | 13:34:29.97 | 37:56:40.08 | 0.15 | 0.32 | 0.36 | 19.3 | 3.78 | 2.38 | 1.81 | 0.03 | |
| ¶81 | 8.47 | 350.7 | 13:34:14.71 | 37:51:31.31 | 0.01 | -0.21 | 0.21 | 13.4 | 2.24 | 5.45 | 0.90 | 1.00 | |
| 82 | 8.40 | 204.8 | 13:34:08.58 | 37:57:14.95 | -0.38 | 0.76 | 0.85 | 21.5 | 2.06 | 6.14 | 2.34 | 0.03 | |
| 83 | 8.25 | 202.6 | 13:35:15.24 | 37:58:38.38 | -0.31 | -0.08 | 0.32 | 20.5 | 2.98 | 8.49 | 0.97 | 0.99 | |
| 84 | 8.18 | 149.4 | 13:34:00.87 | 38:01:25.03 | — | — | — | 27.0 | 3.67 | 9.76 | — | — | |
| 85 | P | 7.89 | 150.3 | 13:34:13.07 | 37:58:30.96 | 0.05 | 0.21 | 0.22 | 22.9 | 0.51 | 6.05 | 1.20 | 0.07 |
| 86 | 7.24 | 107.4 | 13:35:17.33 | 37:54:15.51 | -0.32 | 0.39 | 0.51 | 23.5 | 3.99 | 7.97 | 1.02 | 0.82 | |
| 87 | 7.10 | 168.7 | 13:34:38.26 | 38:01:38.10 | -0.10 | 0.01 | 0.10 | 23.1 | 4.92 | 6.91 | 1.28 | 0.04 | |
| 88 | 6.95 | 54.4 | 13:34:13.77 | 38:07:23.05 | -0.13 | 1.07 | 1.08 | 24.0 | 8.46 | 13.45 | 2.00 | 0.03 | |
| 89 | 6.95 | 44.6 | 13:33:31.36 | 38:00:48.46 | 0.01 | 0.60 | 0.60 | 23.0 | 8.72 | 14.29 | 1.46 | 0.17 | |
| 90 | 6.88 | 172.1 | 13:35:14.78 | 37:52:58.15 | -0.01 | -0.31 | 0.31 | 21.9 | 2.63 | 7.66 | 1.57 | 0.03 | |
| 91 | 6.81 | 71.9 | 13:35:29.88 | 37:46:03.13 | -0.32 | -0.03 | 0.32 | 24.0 | 6.41 | 13.59 | 0.95 | 0.96 | |
| 92 | 6.81 | 42.8 | 13:34:50.74 | 38:07:05.72 | -0.29 | -1.02 | 1.06 | 22.1 | 7.36 | 12.65 | 1.36 | 0.03 | |
| 93 | 6.81 | 179.9 | 13:34:19.93 | 37:54:00.48 | -0.03 | 0.22 | 0.22 | 25.7 | 4.41 | 3.45 | 1.25 | 0.42 | |
| 94 | 6.66 | 197.9 | 13:34:35.86 | 37:54:19.04 | -0.37 | -0.23 | 0.44 | 25.4 | 5.62 | 0.47 | 1.22 | 0.64 | |
| 95 | P | 6.59 | 130.6 | 13:34:37.20 | 37:54:36.78 | -0.03 | -0.30 | 0.30 | 23.6 | 6.01 | 0.13 | 1.05 | 0.70 |
| 96 | 6.59 | 56.9 | 13:35:19.24 | 37:42:59.61 | -0.22 | 0.30 | 0.37 | 22.1 | 8.07 | 14.41 | 3.74 | 0.03 | |
| 97 | 6.59 | 101.3 | 13:34:36.74 | 38:03:19.00 | 0.57 | -0.12 | 0.58 | 22.6 | 5.93 | 8.58 | 0.97 | 0.98 | |
| 98 | 6.37 | 45.8 | 13:35:31.98 | 37:45:35.95 | -0.70 | 0.35 | 0.78 | 17.9 | 7.03 | 14.20 | 2.04 | 0.03 | |
| †99 | 6.23 | 49.1 | 13:35:44.04 | 37:47:31.89 | -0.36 | 2.78 | 2.80 | 21.7 | 7.86 | 15.08 | — | — | |
| 100 | 6.23 | 121.5 | 13:35:09.75 | 37:48:20.25 | -0.08 | -0.03 | 0.09 | 22.4 | 2.44 | 9.10 | 1.23 | 0.06 | |
| 101 | 5.86 | 125.3 | 13:35:20.07 | 37:58:24.11 | -0.64 | -0.01 | 0.64 | 22.6 | 3.94 | 9.25 | 0.98 | 0.98 | |
| 102 | U | 5.79 | 54.0 | 13:35:43.14 | 37:53:08.69 | -0.18 | 0.87 | 0.89 | 23.9 | 7.39 | 13.15 | 1.18 | 0.94 |
| 103 | 5.72 | 68.4 | 13:34:58.38 | 38:04:30.36 | -0.02 | -0.53 | 0.53 | 20.4 | 4.49 | 10.64 | 1.23 | 0.94 | |
| 104 | 5.57 | 32.6 | 13:34:28.58 | 37:41:27.74 | -0.44 | 0.85 | 0.96 | 25.3 | 8.29 | 13.38 | 2.76 | 0.11 | |
| 105 | 5.57 | 30.7 | 13:33:37.05 | 37:56:29.65 | 0.41 | 1.30 | 1.36 | 20.9 | 7.79 | 11.95 | 0.95 | 0.99 | |
| 106 | 5.50 | 161.5 | 13:34:36.24 | 37:51:06.63 | -0.05 | -0.05 | 0.07 | 21.2 | 3.47 | 3.63 | 0.91 | 0.90 | |
| 107 | 5.50 | 63.1 | 13:35:35.80 | 37:51:10.81 | -0.24 | 1.12 | 1.15 | 23.3 | 5.56 | 12.14 | 2.10 | 0.03 | |
| 108 | 5.36 | 164.9 | 13:34:34.62 | 37:56:39.34 | — | — | — | 27.0 | 4.56 | 1.98 | — | — | |
| 109 | 5.36 | 26.9 | 13:34:54.02 | 38:07:56.28 | 1.05 | -2.61 | 2.82 | 22.6 | 8.02 | 13.62 | 1.26 | 0.28 | |
| 110 | 5.21 | 53.7 | 13:34:24.02 | 37:42:57.83 | -0.21 | 0.37 | 0.43 | 21.5 | 6.67 | 12.05 | 1.41 | 0.03 | |
| 111 | 5.21 | 31.4 | 13:33:59.05 | 38:05:56.74 | 1.11 | -1.49 | 1.86 | 22.4 | 7.65 | 13.47 | 1.05 | 0.63 | |
| 112 | 5.14 | 157.0 | 13:34:57.28 | 37:49:43.53 | 0.48 | -0.00 | 0.48 | 25.5 | 2.30 | 6.41 | 1.44 | 0.24 | |
| Num | Alt | Flux | Chandra | R | OffC | OffX | FWHM | Stellar | |||||
|---|---|---|---|---|---|---|---|---|---|---|---|---|---|
| RA (J2000) Dec | (′′) | (′′) | (′′) | (mag) | (′) | (′) | (′′) | ||||||
| 113 | 5.14 | 61.5 | 13:33:42.69 | 37:52:39.48 | 0.50 | 0.30 | 0.58 | 23.7 | 8.06 | 10.92 | 1.37 | 0.04 | |
| †114 | 5.07 | 34.9 | 13:35:52.42 | 37:50:43.74 | 0.00 | -0.22 | 0.22 | 24 | 8.82 | 15.42 | — | — | |
| 115 | U | 5.07 | 60.8 | 13:35:36.41 | 37:51:11.58 | -0.03 | 0.67 | 0.67 | 26.0 | 5.68 | 12.25 | 1.57 | 0.52 |
| 116 | 5.00 | 136.0 | 13:34:19.16 | 37:50:30.21 | 0.10 | 0.22 | 0.24 | 22.0 | 0.94 | 5.50 | 2.30 | 0.03 | |
| 117 | 5.00 | 89.0 | 13:34:23.07 | 38:04:15.67 | 0.28 | 0.34 | 0.43 | 19.9 | 5.59 | 9.91 | 1.00 | 0.98 | |
| 118 | 5.00 | 29.0 | 13:34:01.90 | 38:08:14.36 | 0.46 | 0.04 | 0.46 | 23.4 | 9.64 | 15.17 | 1.03 | 0.94 | |
| 119 | 4.85 | 141.1 | 13:34:14.28 | 37:52:31.60 | 0.06 | 0.57 | 0.57 | 23.5 | 3.17 | 5.00 | 6.16 | 0.03 | |
| 120 | 4.85 | 82.9 | 13:34:14.78 | 38:00:01.15 | 0.03 | -0.28 | 0.28 | 23.9 | 1.09 | 6.86 | 1.50 | 0.48 | |
| 121 | 4.78 | 54.4 | 13:35:18.04 | 37:46:25.40 | -0.36 | 0.14 | 0.39 | 23.9 | 4.77 | 11.61 | 1.97 | 0.03 | |
| 122 | P | 4.78 | 101.1 | 13:34:28.56 | 37:47:07.05 | -0.52 | -0.35 | 0.63 | 24.0 | 2.95 | 7.80 | 3.58 | 0.26 |
| 123 | 4.78 | 31.5 | 13:35:06.00 | 38:06:59.12 | — | — | — | 27.0 | 6.96 | 13.51 | — | — | |
| 124 | 4.78 | 51.1 | 13:33:56.42 | 38:04:07.14 | 0.78 | -0.18 | 0.80 | 22.4 | 6.30 | 12.32 | 1.12 | 0.34 | |
| 125 | 4.71 | 82.3 | 13:35:19.38 | 37:53:00.25 | -0.47 | -0.28 | 0.55 | 22.1 | 3.23 | 8.54 | 2.03 | 0.03 | |
| 126 | 4.71 | 33.1 | 13:35:23.38 | 38:04:41.39 | -0.98 | -0.28 | 1.02 | 19.8 | 6.25 | 13.51 | 0.98 | 0.98 | |
| 127 | 4.63 | 112.7 | 13:34:43.43 | 37:49:21.98 | -0.06 | -0.32 | 0.33 | 23.3 | 4.54 | 5.52 | 2.71 | 0.02 | |
| 128 | 4.56 | 47.0 | 13:33:50.50 | 37:49:46.92 | 1.01 | 0.13 | 1.02 | 23.4 | 5.92 | 10.43 | 4.32 | 0.01 | |
| 129 | 4.56 | 27.3 | 13:33:50.83 | 38:05:03.32 | — | — | — | 27.0 | 7.71 | 13.75 | — | — | |
| 130 | U | 4.56 | 72.0 | 13:34:44.09 | 37:44:34.90 | -0.76 | 0.02 | 0.76 | 24.7 | 6.85 | 10.25 | 2.95 | 0.14 |
| 131 | 4.42 | 73.3 | 13:35:19.69 | 37:49:18.05 | -0.14 | 0.29 | 0.32 | 23.2 | 2.77 | 10.03 | 2.00 | 0.02 | |
| 132 | 4.42 | 50.2 | 13:34:14.11 | 38:04:38.43 | 0.48 | 1.42 | 1.50 | 25.3 | 5.71 | 10.88 | 2.96 | 0.03 | |
| 133 | 4.42 | 47.1 | 13:34:21.89 | 38:04:50.31 | 0.19 | -0.02 | 0.19 | 22.4 | 6.08 | 10.53 | 1.18 | 0.07 | |
| 134 | 4.34 | 32.4 | 13:35:46.50 | 37:53:27.62 | -1.41 | 1.70 | 2.21 | 23.5 | 8.12 | 13.77 | 1.06 | 0.88 | |
| 135 | 4.34 | 73.2 | 13:35:05.57 | 37:50:31.22 | 0.21 | -0.38 | 0.44 | 22.4 | 0.48 | 7.04 | 1.23 | 0.11 | |
| 136 | 4.34 | 43.6 | 13:33:52.10 | 38:02:52.10 | 0.02 | 1.05 | 1.05 | 24.7 | 5.93 | 12.01 | 2.59 | 0.01 | |
| 137 | 4.20 | 46.8 | 13:34:19.40 | 37:43:49.38 | -0.16 | 0.12 | 0.20 | 23.1 | 5.78 | 11.45 | 1.31 | 0.05 | |
| 138 | 4.20 | 31.9 | 13:34:57.72 | 38:05:23.58 | — | — | — | 27.0 | 5.38 | 11.41 | — | — | |
| 139 | 4.13 | 31.0 | 13:35:38.79 | 37:55:09.91 | 0.19 | 0.42 | 0.46 | 23.5 | 7.56 | 12.19 | 2.27 | 0.02 | |
| 140 | 4.05 | 45.3 | 13:35:03.68 | 37:45:15.12 | 0.92 | 0.86 | 1.25 | 23.6 | 5.55 | 10.85 | 1.33 | 0.05 | |
| 141 | 4.05 | 94.9 | 13:34:09.90 | 37:54:31.78 | -0.08 | 0.28 | 0.29 | 23.3 | 4.50 | 5.35 | 1.59 | 0.03 | |
| 142 | 3.98 | 78.1 | 13:34:45.31 | 38:00:30.43 | 0.05 | -0.41 | 0.41 | 24.3 | 3.31 | 6.00 | 0.94 | 0.96 | |
| 143 | 3.98 | 29.2 | 13:33:40.73 | 37:52:42.13 | 1.44 | 1.05 | 1.78 | 22.1 | 8.43 | 11.29 | 0.97 | 0.98 | |
| 144 | 3.98 | 89.7 | 13:34:33.51 | 37:48:36.04 | 0.00 | -0.02 | 0.02 | 19.5 | 2.76 | 6.17 | 1.41 | 0.05 | |
| 145 | 3.84 | 33.5 | 13:35:03.08 | 37:44:07.40 | -1.25 | -1.01 | 1.60 | 23.9 | 6.68 | 11.80 | 4.62 | 0.37 | |
| 146 | 3.76 | 73.9 | 13:35:16.34 | 37:56:21.61 | -0.45 | -0.39 | 0.59 | 16.0 | 4.67 | 7.92 | 5.76 | 0.03 | |
| 147 | 3.69 | 43.4 | 13:35:15.05 | 38:03:20.02 | -0.62 | -0.23 | 0.66 | 22.0 | 4.15 | 11.40 | 0.92 | 0.90 | |
| 148 | 3.62 | 76.5 | 13:35:08.78 | 37:57:04.82 | -0.22 | -0.65 | 0.69 | 23.4 | 3.28 | 6.69 | 1.03 | 0.81 | |
| ∗149 | U | 3.62 | 80.1 | 13:34:01.19 | 37:53:49.14 | -0.60 | 0.16 | 0.61 | 23.8 | 5.68 | 7.12 | — | — |
| 150 | 3.62 | 89.8 | 13:34:56.57 | 37:53:49.98 | 0.35 | 0.26 | 0.43 | 24.7 | 3.80 | 3.96 | 1.41 | 0.21 | |
| 151 | 3.55 | 48.7 | 13:35:01.20 | 37:59:38.05 | -0.13 | -0.87 | 0.88 | 22.9 | 0.47 | 6.84 | 1.35 | 0.03 | |
| 152 | 3.48 | 29.2 | 13:34:39.05 | 37:43:34.94 | -1.36 | -1.05 | 1.72 | 23.2 | 7.05 | 11.16 | 0.87 | 0.98 | |
| 153 | 3.48 | 86.0 | 13:34:48.26 | 37:51:10.25 | — | — | — | 27.0 | 3.87 | 4.20 | — | — | |
| 154 | P | 3.40 | 39.9 | 13:35:34.89 | 37:50:28.74 | 0.45 | 0.18 | 0.49 | 24.3 | 5.37 | 12.20 | 2.13 | 0.02 |
| 155 | 3.40 | 61.7 | 13:35:18.49 | 37:55:33.21 | -0.46 | 0.19 | 0.49 | 22.9 | 5.26 | 8.22 | 1.12 | 0.98 | |
| 156 | 3.40 | 34.6 | 13:35:25.71 | 37:52:34.93 | — | — | — | 27.0 | 4.00 | 9.85 | — | — | |
| 157 | 3.40 | 59.1 | 13:34:43.90 | 38:02:45.77 | 0.50 | -0.02 | 0.50 | 24.4 | 4.46 | 8.14 | 3.21 | 0.26 | |
| 158 | 3.33 | 53.2 | 13:34:22.05 | 38:04:11.14 | -0.03 | -0.14 | 0.14 | 24.9 | 5.46 | 9.90 | 1.36 | 0.24 | |
| 159 | 3.26 | 36.2 | 13:35:06.17 | 37:50:03.93 | — | — | — | 27.0 | 0.74 | 7.41 | — | — | |
| 160 | 3.19 | 77.3 | 13:34:58.83 | 37:50:17.67 | -0.19 | -0.39 | 0.44 | 23.6 | 1.81 | 6.19 | 2.71 | 0.03 | |
| 161 | 3.19 | 66.7 | 13:34:35.10 | 37:49:11.03 | 0.09 | 0.20 | 0.22 | 22.6 | 2.92 | 5.56 | 1.55 | 0.03 | |
| 162 | U | 3.11 | 30.6 | 13:34:33.62 | 38:05:40.27 | 0.32 | 0.55 | 0.64 | 23.8 | 7.71 | 10.96 | 2.86 | 0.02 |
| 163 | 3.11 | 28.4 | 13:35:38.29 | 37:52:06.85 | -0.86 | 1.23 | 1.50 | 22.8 | 6.19 | 12.38 | 1.32 | 0.04 | |
| 164 | 3.11 | 39.0 | 13:35:19.33 | 38:00:05.56 | -0.15 | -0.17 | 0.23 | 23.8 | 3.42 | 9.91 | 1.12 | 0.32 | |
| 165 | 2.97 | 65.4 | 13:34:53.78 | 37:51:08.19 | -0.08 | -0.30 | 0.31 | 26.4 | 2.78 | 4.89 | 1.52 | 0.62 | |
| 166 | 2.90 | 33.4 | 13:35:07.80 | 37:45:44.48 | -0.86 | -0.12 | 0.87 | 26.2 | 5.00 | 10.86 | 0.87 | 0.51 | |
| 167 | 2.82 | 65.0 | 13:34:46.61 | 37:58:40.29 | 0.52 | 0.14 | 0.54 | 18.6 | 3.34 | 4.37 | 1.58 | 0.03 | |
| 168 | 2.82 | 61.1 | 13:34:29.68 | 37:49:19.80 | 0.11 | 0.25 | 0.28 | 23.9 | 1.84 | 5.59 | 2.01 | 0.02 | |
| 169 | 2.75 | 26.0 | 13:33:55.01 | 38:03:13.01 | 1.20 | 0.31 | 1.24 | 24.4 | 5.77 | 11.85 | 1.63 | 0.29 | |
| 170 | U | 2.68 | 78.8 | 13:34:17.03 | 37:59:49.48 | -0.02 | -0.02 | 0.03 | 23.3 | 1.02 | 6.43 | 1.04 | 0.97 |
| 171 | 2.68 | 42.0 | 13:34:46.58 | 38:01:25.70 | 0.50 | 0.21 | 0.54 | 23.8 | 3.32 | 6.96 | 1.16 | 0.29 | |
| 172 | 2.68 | 50.9 | 13:34:49.80 | 37:54:49.30 | — | — | — | 27.0 | 5.40 | 2.53 | — | — | |
| 173 | P | 2.68 | 63.1 | 13:34:42.90 | 37:52:04.09 | 0.36 | 0.29 | 0.47 | 23.2 | 5.07 | 2.91 | 0.91 | 0.92 |
| 174 | 2.61 | 57.5 | 13:34:30.57 | 37:57:02.94 | -0.17 | -0.15 | 0.23 | 22.3 | 3.67 | 2.64 | 1.32 | 0.03 | |
| 175 | 2.61 | 31.8 | 13:33:54.72 | 37:51:28.71 | 0.39 | -0.05 | 0.39 | 24.6 | 5.42 | 8.96 | 1.19 | 0.53 | |
| Num | Alt | Flux | Chandra | R | OffC | OffX | FWHM | Stellar | |||||
|---|---|---|---|---|---|---|---|---|---|---|---|---|---|
| RA (J2000) Dec | (′′) | (′′) | (′′) | (mag) | (′) | (′) | (′′) | ||||||
| 176 | 2.61 | 49.9 | 13:34:57.08 | 37:55:41.51 | 0.05 | 0.57 | 0.57 | 25.7 | 4.49 | 4.07 | 1.90 | 0.14 | |
| 177 | 2.61 | 53.4 | 13:35:00.09 | 37:53:43.33 | 0.17 | 0.15 | 0.23 | 23.3 | 3.34 | 4.67 | 0.93 | 0.98 | |
| 178 | 2.53 | 32.6 | 13:34:56.82 | 37:45:53.50 | -0.31 | 0.41 | 0.51 | 19.5 | 5.31 | 9.67 | 1.73 | 0.03 | |
| 179 | 2.46 | 69.5 | 13:34:30.30 | 37:55:25.16 | 0.07 | -0.29 | 0.29 | 22.6 | 4.68 | 1.49 | 1.70 | 0.03 | |
| 180 | 2.39 | 51.9 | 13:34:33.26 | 37:55:09.86 | -0.46 | 0.28 | 0.54 | 20.3 | 5.26 | 0.85 | 1.79 | 0.03 | |
| 181 | 2.39 | 59.2 | 13:34:38.11 | 37:49:07.71 | -0.66 | -0.00 | 0.66 | 19.6 | 3.52 | 5.61 | 1.12 | 0.90 | |
| 182 | 2.32 | 27.1 | 13:35:33.41 | 37:56:15.75 | -0.16 | 0.05 | 0.17 | 21.7 | 7.28 | 11.23 | 1.19 | 0.04 | |
| 183 | 2.24 | 36.9 | 13:34:01.27 | 37:55:14.08 | -0.68 | 1.63 | 1.76 | 19.9 | 4.53 | 7.06 | 2.84 | 0.03 | |
| 184 | 2.24 | 46.0 | 13:34:11.54 | 37:59:33.09 | 0.10 | -0.01 | 0.10 | 25.4 | 0.87 | 6.96 | 2.30 | 0.12 | |
| 185 | 2.24 | 42.6 | 13:34:23.51 | 37:59:30.85 | 0.00 | 0.33 | 0.33 | 22.3 | 1.85 | 5.47 | 1.60 | 0.03 | |
| 186 | 2.17 | 40.2 | 13:35:02.89 | 37:56:18.03 | -0.31 | 0.35 | 0.46 | 22.9 | 3.78 | 5.34 | 8.24 | 0.00 | |
| 187 | 2.17 | 36.3 | 13:35:01.69 | 37:47:26.02 | -0.02 | 0.30 | 0.30 | 23.6 | 3.52 | 8.78 | 1.33 | 0.05 | |
| ∗188 | U | 2.10 | 35.5 | 13:34:01.91 | 37:53:25.73 | 0.44 | 0.47 | 0.64 | 23.6 | 5.30 | 7.05 | — | — |
| 189 | 2.03 | 71.4 | 13:34:12.68 | 38:00:23.90 | 0.48 | 0.24 | 0.54 | 24.7 | 1.52 | 7.42 | 1.55 | 0.46 | |
| 190 | 2.03 | 34.4 | 13:34:48.18 | 37:54:32.91 | — | — | — | 27.0 | 5.42 | 2.21 | — | — | |
| 191 | 1.95 | 45.6 | 13:34:20.98 | 37:59:30.92 | -0.61 | 0.41 | 0.73 | 23.2 | 1.39 | 5.73 | 2.14 | 0.03 | |
| 192 | U | 1.95 | 57.6 | 13:34:21.56 | 37:49:59.82 | 0.47 | 0.05 | 0.48 | 25.9 | 0.46 | 5.63 | 2.08 | 0.07 |
| 193 | 1.95 | 49.3 | 13:34:28.51 | 37:54:48.32 | 0.76 | 0.13 | 0.77 | 23.8 | 4.95 | 1.68 | 2.67 | 0.05 | |
| 194 | 1.95 | 29.8 | 13:35:18.90 | 37:54:16.81 | -0.10 | 0.09 | 0.14 | 23.7 | 4.17 | 8.28 | 3.19 | 0.01 | |
| 195 | 1.95 | 27.4 | 13:35:13.08 | 37:56:39.55 | — | — | — | 27.0 | 4.06 | 7.37 | — | — | |
| 196 | 1.88 | 41.6 | 13:34:22.13 | 37:53:44.87 | -0.19 | 0.62 | 0.65 | 24.6 | 4.17 | 3.09 | 1.12 | 0.86 | |
| 197 | 1.88 | 29.6 | 13:34:01.21 | 37:55:24.48 | 0.44 | 0.32 | 0.54 | 23.6 | 4.40 | 7.09 | 1.90 | 0.02 | |
| 198 | 1.88 | 26.4 | 13:34:28.11 | 37:47:48.00 | 0.36 | 0.02 | 0.36 | 23.7 | 2.35 | 7.15 | 2.38 | 0.02 | |
| 199 | 1.81 | 26.9 | 13:34:54.67 | 37:52:38.57 | 0.90 | -0.35 | 0.97 | 26.2 | 3.20 | 4.06 | 0.99 | 0.53 | |
| ∗200 | U | 1.74 | 41.7 | 13:35:09.62 | 37:50:11.89 | 0.11 | -0.49 | 0.50 | 25.5 | 0.66 | 7.88 | — | — |
| 201 | 1.74 | 42.9 | 13:34:56.74 | 37:52:17.72 | 0.44 | 0.10 | 0.45 | 24.9 | 2.67 | 4.60 | 1.51 | 0.13 | |
| 202 | P | 1.67 | 27.2 | 13:35:20.44 | 37:55:29.25 | -0.48 | 1.09 | 1.19 | 22.0 | 5.37 | 8.60 | 1.39 | 0.04 |
| 203 | 1.67 | 30.5 | 13:34:34.99 | 37:56:50.03 | 0.13 | 0.25 | 0.28 | 21.2 | 4.53 | 2.14 | 1.22 | 0.04 | |
| 204 | U | 1.67 | 26.7 | 13:34:43.12 | 38:00:20.47 | 0.35 | -0.08 | 0.36 | 25.4 | 3.72 | 5.74 | 1.70 | 0.13 |
| 205 | 1.67 | 27.6 | 13:34:46.76 | 37:55:45.22 | 0.01 | 0.43 | 0.43 | 24.2 | 5.26 | 2.18 | 2.44 | 0.02 | |
| 206 | 1.67 | 26.1 | 13:34:44.89 | 38:00:35.78 | 0.58 | -0.54 | 0.79 | 23.0 | 3.41 | 6.07 | 1.43 | 0.03 | |
| 207 | 1.59 | 25.4 | 13:34:33.85 | 37:45:13.26 | — | — | — | 27.0 | 5.11 | 9.53 | — | — | |
| 208 | 1.52 | 30.8 | 13:34:04.20 | 37:56:38.92 | -0.23 | -0.01 | 0.23 | 20.4 | 3.07 | 6.74 | 0.93 | 0.98 | |
| 209 | 1.52 | 33.9 | 13:34:33.95 | 37:49:46.45 | -0.00 | -0.24 | 0.24 | 24.8 | 2.67 | 5.00 | 1.59 | 0.20 | |
| 210 | U | 1.38 | 26.0 | 13:34:33.22 | 37:52:22.40 | -0.52 | -1.06 | 1.18 | 23.4 | 3.75 | 2.48 | 1.17 | 0.31 |
| 211 | 1.38 | 33.0 | 13:34:56.50 | 38:01:46.18 | -0.28 | 0.49 | 0.56 | 23.9 | 2.01 | 8.02 | 1.35 | 0.09 | |
| 212 | 1.38 | 27.7 | 13:34:35.23 | 37:53:56.92 | -0.07 | -0.74 | 0.75 | 23.7 | 5.24 | 0.86 | 1.05 | 0.84 | |
| 213 | 1.38 | 26.5 | 13:34:09.79 | 37:57:44.85 | -0.28 | -0.01 | 0.28 | 23.4 | 1.51 | 6.15 | 1.11 | 0.41 | |
| 214 | 1.23 | 25.5 | 13:34:22.22 | 37:48:04.67 | -0.62 | -0.36 | 0.72 | 20.0 | 1.56 | 7.27 | 1.38 | 0.03 | |
NOTES
¶ Optical position is taken direct from the APM scan of the POSSII plates and magnitude is from UH imaging.
† Magnitude taken from CFHT image. For source 114 we give the coordinates of a very faint object which is not visible on the CFHT image but which is visible on a deep B-band image (Croom, private communication). Sources 99 and 114, whose identification is unreliable because of the lower sensitivity imaging, are not included in any statistical analysis.
∗ Optical counterpart not deblended properly by SExtractor software so coordinates and magnitude, but not stellarity or FWHM, calculated manually.
Note that our source searching, which compares photon distributions with the shape of the PSF, is optimised for the detection of point sources. Thus extended sources, such as clusters of galaxies or even extended starburst emission in galaxies, may be missed or be given incorrect fluxes.
Examination of the Cash-statistic map, as well as the raw photon distributions, shows that positions are good, statistically, to better than in the large majority of cases. By examining the X-ray/optical offsets of bright optical counterparts for which the likelihood of chance random associations is very low, we can obtain a retrospective view of the X-ray positional accuracy. This investigation is given in Section 4.1.
2.3 X-ray Positional Accuracy
From simulations of a 300ksec ACIS-I observation using the MARX simulator (Wise et al. 2000) Tozzi et al. (2001) present (their Fig 1) a distribution of differences between input and output coordinates, drawn from sources on all parts of the ACIS-I detector. Most sources appear to have positional errors of arcsec but Tozzi et al. do not distinguish sources of different off-axis angles. Giacconi et al. (2002) determine an average rms positional offset of between optical and X-ray coordinates for X-ray sources from a 942ksec ACIS-I observation and assume an analytic form for the increase in X-ray PSF with off-axis angle. Hornschemeier et al. (2001), in a 222ksec ACIS-I exposure, adopt a positional error of but note that, for sources off-axis, positions will be worse. We are unaware of any study of positional errors in relatively short ACIS-I exposures, such as ours and so in this paper we consider the errors in some detail. In this section we address how the error changes as a function of off-axis angle by considering the relative positions of X-ray sources as detected in different observations. Then, in Section 4.1, we derive X-ray positional errors by reference to bright optical counterparts.
Sixty seven sources appear on more than one pointing. There are 158 positional measurements for these 67 sources. We can obtain an idea of our positional accuracy as a function of off-axis angle by examining the differences between the positions derived from single observations and those derived from the simultaneous fit to all observations, which are listed in Table 2. In Table 3 we give the offsets within which 50 per cent and 90 per cent of the sources lie. We also list the number of detections, N, contributing to each off-axis bin. The simultaneous fit position is dominated by the very accurate positions obtained close to the axis and so we do not list the offsets for sources with off-axis angles less than . The positional accuracy of these sources is considered in Section 4.1. As the four individual pointings were placed on the corners of a square of side , a detection at, say, off-axis in one observation tends to imply a detection at in another. In other words we will be able to compare the off-axis position with a highly accurate, close to the axis, position and so obtain a good estimate of the off-axis positional uncertainty.
This method of off-axis positional determination, although based on only 67 sources, depends only on Chandra observations and so does not rely on any assumptions about the accuracy of the optical identifications. It therefore provides a useful complement to the positional determination in Section 4.1. Note however that, in Table 3, we neglect any contribution to the off-axis error from the error in on-axis positions. The on-axis positional error is, however, very small () and so, when added in quadrature, adds very little to the off-axis error.
| Off-axis | N | 50% | 90% |
|---|---|---|---|
| arcmin | arcsec | arcsec | |
| 6-7 | 23 | 0.65 | 1.40 |
| 7-8 | 27 | 0.68 | 1.60 |
| 8-9 | 13 | 0.85 | 2.30 |
| 15 | 1.15 | 2.75 |
Of the 50 single pointing positions out to off-axis, only one lies from the simultaneous fit position and most are much closer. Even beyond off-axis, only 4 of the 15 offsets are .
2.4 X-ray Flux Determination
Fluxes are determined from the Maximum Likelihood (ML) parameters of the Cash statistic, where count-rate is a free parameter. These count rates automatically compensate for the variation in the PSF and the complicated exposure map of the observations. The ML count rates are then converted to keV fluxes by assuming a power-law spectrum with an energy spectral index, , and Galactic absorption of cm-2 (Stark et al. 1992; Branduardi-Raymont et al. 1994). The spectrum is chosen because it is similar to that of the diffuse background (eg Gendreau et al. 1995). For the majority of sources, this spectral assumption is the dominant source of error ( would increase the flux by 24 per cent, and would decrease it by a similar amount). For the faintest sources, however, the excellent on-axis PSF means that as few as 6 photons can give rise to a significant detection, and the flux is then dominated by Poisson noise, giving errors of up to 40 per cent.
3 Optical Observations
3.1 CCD Photometry
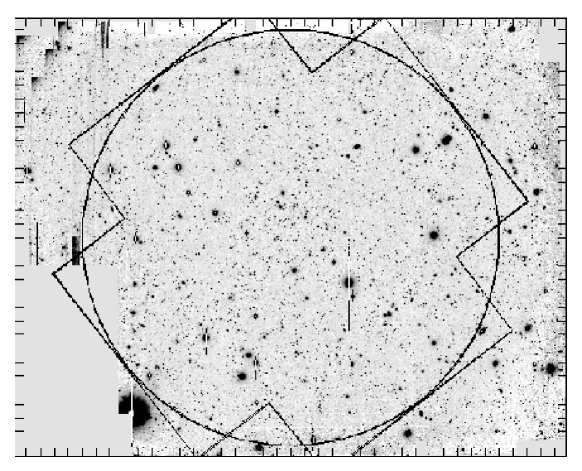
The field was observed for one hour on 2000 December 23 using the Prime Focus Camera, SuprimeCam (Miyazaki et al. 1998), on the 8.2m Japanese Subaru Telescope. SuprimeCam consists of ten closely butted MIT/Lincoln Labs 4096x2048 CCDs, with a scale of 0.2 arcsec/pixel, giving an overall field of view of . The present observations were dithered in order to fill the small gaps between the CCDs, resulting in an overall field of . At the time of observation, only nine of the CCDs were operational, hence part of the south-east corner of the X-ray field was not covered. An overview of the optical image is shown in Fig. 2, with a 15 arcmin radius circle representing the ROSAT and XMM-Newton field overlaid. The limiting magnitude of the observations, for isolated stellar sources, is ( significance), a little fainter in some places, although our optical catalogue (see Section 3.3) is not complete at that limit. The average seeing was 0.9 arcsec.
The missing portion of the XMM-Newton field, containing Chandra sources 12, 39, 99 and 114, is covered by an observation from the 8k8k CCD camera on CFHT, reaching to . For Chandra sources 1, 25 and 81, with very bright stellar counterparts, we show our least saturated optical imaging from the University of Hawaii (UH) 88 inch telescope, which reaches to (see McHardy et al. 1998 for details).
3.1.1 Registration of the Subaru Coordinate Frame
The coordinate frame of the CCD observations was set initially by reference to the USNO-A2.0 stars (Monet et al. 1998) and also to the HST Guide Star Catalog (Ver 1.2; van Altena 1999), providing a coordinate frame which was good to better than an arcsecond. The coordinate frame was then refined by comparison with stellar objects visible on the second epoch Palomar Sky Survey J plates. An initial comparison with scans of the first epoch Palomar plates had shown evidence of proper motion in significant numbers of stars. The second epoch plates were scanned by Mike Irwin using the Cambridge Automatic Plate Measuring Machine, whose frame is very accurately tied to the FK5 system. The positions of CCD counterparts to the positions of APM stars were selected automatically (using the IRAF task imcentroid) but correspondences were then checked by eye to ensure that imcentroid had not selected a spurious source. Remaining incorrect associations were removed by an iterative 2.5 cut. Finally over 1100 corresponding objects were used to define the CCD frame resulting in rms errors of 0.30 arcsec in both RA and Dec (an improvement of in both axes compared to using the first epoch Palomar plates.) Subsequent comparison of the resultant CCD positions with those from accuracy VLA radio positions (Seymour et al., in preparation) confirms the accuracy of the CCD positions.
3.2 Object Extraction
In order to determine the magnitudes, positions and approximate morphologies of all of the optical objects in the SuprimeCam image, both to find counterparts to X-ray sources and to determine the background star and galaxy surface density, we ran the SExtractor software (Bertin & Arnouts 1996, hereafter BA96). We ran SExtractor twice: once on the central 60004000 pixels () of our image where the exposure is very uniform in order to determine galaxy and star source counts and secondly on the entire image to find all possible X-ray counterparts. The input seeing parameter was set to . Amongst the parameters output by SExtractor is the stellarity parameter, which indicates how confident the software is that the object detected is a ‘star’ or a galaxy. Typically, bright objects with stellarity are stars or QSOs and objects with stellarity are galaxies. We take the SExtractor ‘best estimate’ magnitude as our standard magnitude.
In Fig. 3 we plot the distribution of stellarities for the central as a function of magnitude. The distribution is typical of the extragalactic sky (eg see fig. 9 of BA96). By comparison with the simulations of BA96, and using their figs 7 and 9, we estimate that almost all objects brighter than should be correctly classified and that per cent of objects with should be correctly classified. Beyond that magnitude the large majority of objects in the high latitude extragalactic sky should be galaxies (Smail et al. 1995) but SExtractor cannot give a reliable classification. As will be noted from BA96 fig. 9 and from our Fig. 3, there is a tendency for SExtractor to classify, as stars, faint objects which are probably galaxies. Thus, for objects fainter than , imposing a stellarity selection criterion as low as 0.5 probably classifies incorrectly some galaxies as stars. We note that Hogg et al. (1997) classify all faint objects as galaxies.

3.3 Background galaxy and ‘star’ counts
In order to compare our object extraction efficiency and photometry with that of previous workers we have calculated the differential source counts for the objects in our SExtractor catalogue. We select objects with stellarity . Fitting the distribution in the range we find a slope of 0.345 which is almost identical to the slope determined by Hogg et al. of 0.334 over the same magnitude range. Taking account of the slight differences between our Cousins -band and the Johnson -band of Hogg et al. (; Fukugita et al. 1995) we find an almost identical normalisation. At brighter magnitudes we also see the fall off in galaxies which was noted in the large area photographic surveys (eg Metcalfe et al. 1991). Thus our galaxy catalogue appears complete to . Compact galaxies and QSOs, in isolated environments, can be seen down to , but those close to brighter objects are sometimes not deblended by SExtractor so our catalogue is imcomplete at .
We note that the raw galaxy counts of Hogg et al. show exactly the same deviation from a powerlaw at as do our own counts. Hogg et al. correct for incompleteness and show that, to , the same powerlaw that describes the brighter galaxy counts continues to apply. We may therefore use an extrapolation of the powerlaw which describes our own integral source counts at to estimate the likelihood of a chance identification, in an optically uncrowded region, in our Chandra errorcircles (Section 4.1).

4 The Optical Identifications
In order to give as informative a view as possible of the optical identifications, we show postage stamp images of all of the Chandra sources in Fig. 5, in order of Chandra flux. Unless indicated otherwise in the figure caption, the images are taken from the Subaru -band image with identical greyscales, to aid comparison. All postage stamp images are centred on the Chandra positions to within a pixel (). As the Chandra positional accuracy is related to the Chandra off-axis angle and the significance of the source detection, each image is labelled with its Chandra source number (top left), the smallest Chandra off-axis angle from the various Chandra fields in which the source was detected (top centre) and the Cash statistic derived in the source detection (top right). Visual examination of Fig. 5 shows that an object is visible within an arcsecond of the X-ray position in the very large majority of cases. However, given the high accuracy of the Chandra positions, it is clear that there are a significant number of sources (28, 13 per cent of our sample) where the identification is very faint (), as has been noted in other Chandra surveys (eg Mushotzky et al. 2000; Alexander et al. 2001). Of the 28 sources, 14 have no identification at all to .
In Table 2 we list the Chandra sources, together with identification information from the SExtractor analysis, for optical candidates within of the Chandra centroid. As we have seen above (Section 2.3), this selection radius is sufficient for the vast majority of Chandra sources. However of the 24 sources at off-axis angles may have identifications in the range . For sources more than off-axis we therefore increased the search radius to . In 2 cases (110 and 135, both off-axis) a plausible counterpart was found where one had not already been found within of the Chandra position. These two counterparts are listed in Table 2. Examination of the finding charts for sources off-axis occasionally shows objects at very large distances () from the Chandra position where otherwise there is no detectable counterpart. Although perhaps one such objects might be the correct identification, it is very unlikely that many counterparts will lie so far from the Chandra position.
Note that, despite our best efforts, the faintest objects, which are still easily detected by SExtractor and which are clearly visible on computer displays, are not always clearly visible on the hard copies presented here.
4.1 Positional Accuracy
Positional errors for Chandra sources are often determined by reference to unambiguous optical identifications (eg Giacconi et al. 2002; Hornschemeier et al. 2001). In this section we apply the same method to our observations. We perform our analysis using X-ray sources with optical counterparts in the magnitude range to 24 which lie within of the Chandra position. We choose an cut-off as stars brighter than are saturated on the SuprimeCam image. At magnitudes brighter than we will show below (Section 4.2) that the number of chance coincidences is very low.
We separately calculated the systematic optical/X-ray positional offsets for all four Chandra pointings. The offsets were reasonably well represented by Gaussian distributions in both right ascension and declination. In all cases there was evidence of a slight systematic offset between the optical and X-ray positions but the offsets were the same, within the errors, for all 4 Chandra pointings at in RA (optical – X-ray position) and in declination. These small corrections were applied to the Chandra coordinate frames and the resultant distribution of optical-X-ray offsets for all Chandra sources within 6 arcmin of a pointing axis and with optical counterparts in the range are shown in Fig. 6. For these sources the rms dispersion between the optical and X-ray coordinates, (in both RA and Dec) and for sources further than 6 arcmin from an axis, going out to in one case, . The average for all sources is . A full 2D polynomial coordinate solution between the X-ray and optical positions did not reduce the dispersion significantly more than the simple systematic offsets derived above.
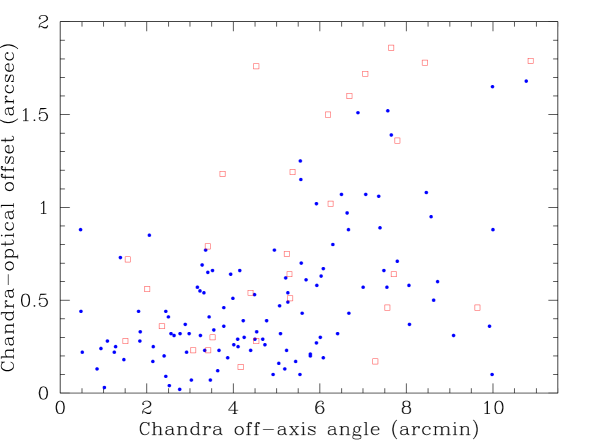
In order to investigate the variation of positional accuracy with off-axis angle we plot, in Fig. 7, the Chandra-optical offset for sources with an identification in the range mag. The lowest significance sources are plotted separately but off-axis angle is clearly the major factor affecting source positions. We conclude that for sources within of a Chandra pointing axis, the Chandra positions are good to typically , with almost all identifications lying within . In the outer part of our Chandra images these positional errors approximately double.
Confirmation of the Chandra positions, and the accurate registration of the Chandra and Subaru coordinate frames, can be obtained by examining the Chandra - Subaru offsets for the 28 Chandra sources, lying within of a Chandra pointing axis, which already have firm identifications (eg McHardy et al. 1998). Apart from source 1, whose image is saturated, none of the other 27 have Chandra - Subaru separations greater than . Of course these 27 are mostly rather bright X-ray sources and so have the best Chandra positions and so reliable identifications can still be expected, for the fainter Chandra sources, at slightly greater Chandra - optical separations.
4.2 Chance Coincidences
From examination of Fig. 7 we take as a conservative estimate of the 90 per cent confidence radius for sources within of a Chandra pointing axis. The number of chance optical coincidences, for the 123 Chandra sources with no previous identification, together with the number of actual identifications, is given in Table 4, for various magnitude ranges. We see immediately that identifications with can be considered quite firm, those with are mostly reliable, but those with are probably spurious. We note, however, that the ‘observed’ numbers include all identifications within our search radius. Of these identifications, 10 lie in the range , 7 lie in the range and 2 lie in the range . If the 90 per cent confidence radius is , then we would expect of order 10 identifications outside that radius (for the observed 104 within) and so the 10 sources in the range are probably good identifications. Even if we increase the confidence radius to and so double the number of chance expected coincidences, the identifications with are still secure. Of course, if any faint () identifications are incorrect, then the true identifications must be even fainter.
Beyond separation, we are not confident of the identifications, except for the optically brightest (source 202), even though most of the larger separations correspond to fainter Chandra sources where poorer positions are expected. If we increase the confidence radius from to , we increase chance coincidences by . Thus, to , we expect 3.6 chance coincidences in the 123 Chandra errorboxes and there are 5 possible identifications with in the separation range 1.01 to . A consequence of our positional accuracy is that we can be reasonably confident that Chandra source 183 is not associated with the nucleus of the 19.9 magnitude galaxy which lies away. The X-ray source must either be associated with a background object, which is obscured by the galaxy, or with a non-nuclear source (eg an ultra high luminosity X-ray source (ULX), c.f. Roberts & Warwick 2000) in the outer envelope of the bright galaxy, as may also be the case in source 188 (see Appendix A for details.)
For Chandra sources at greater off-axis angles than , the positional errors increase (eg see Fig. 7 and Table 3). In the range off-axis there are 22 Chandra sources with identifications of compared with 2 expected by chance for a radius errorbox, which is sufficient to encompass all candidates, although larger than the 90 per cent confidence radius (, see Table 3). Thus most of the identifications with are secure. There are only 3 identifications at fainter magnitudes but those cannot be considered reliable. Beyond off-axis there are 21 Chandra sources without previous identifications, of which 15 have . All but 2 of the latter are within of the Chandra position. However taking a conservative error radius of (a little larger than the 90 per cent confidence radius), we expect 2.7 chance identifications of . Therefore we are again confident that identifications with are secure but those at fainter magnitudes are not.
| -magnitude | Observed | Chance |
|---|---|---|
| 24 | 91 | 1.1 |
| 24–25 | 19 | 1.1 |
| 25–26 | 9 | 2.2 |
| 26–27 | 4 | 4.5 |

5 Identification Content
A number of papers have already been written on the optical identification of sources in the very deep Chandra surveys (eg Hornschemeier et al. 2001, 2002; Bauer et al. 2002; Tozzi et al. 2001; Koekemoer et al. 2002; Barger et al. 2002; Vignali et al. 2002; Gunn et al. 2003). In this section we summarise the optical properties of the identifications in our shallower, but larger area, survey to place them in the context of the deeper surveys so that they may be useful to other researchers. We also illustrate the usefulness of the SExtractor stellarity parameter for morphological classification.
If our sources lie in broadly the same redshift range as those of other Chandra surveys, ie (eg Rosati et al. 2002; Crawford et al. 2002; Barger et al. 2001) and the redshifts which we have already (see Table 5) are consistent with that view, then most of our sources will be of relatively low luminosity. For example a flux of ergs cm-2 s-1 ( keV), close to the limit of our catalogue, corresponds to ergs s-1 at redshift , or ergs s-1 at .222We assume a flat cosmology with and km s-1 Mpc-1 throughout this paper. Although AGN will certainly be the dominant sources of X-ray emission, at the lowest luminosities, off-nuclear emission such as a ULX (eg Roberts and Warwick 2000) is a realistic possibility (eg sources 183 and 188), as is thermal emission from hot gaseous halos of large elliptical galaxies (eg O’Sullivan et al. 2001; Mathews & Brighenti 1998), starburst emission (Griffiths & Padovani 1990), and hidden BL Lacs (Browne & Marcha 1993; McHardy et al. 2003).
5.1 Morphology
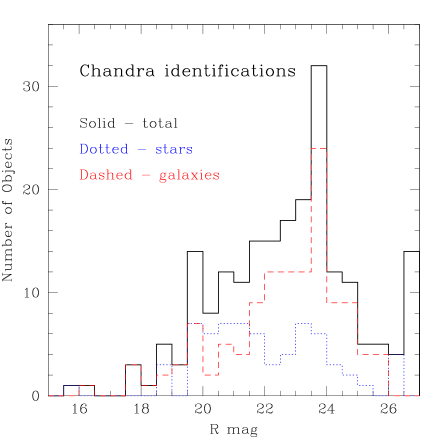
We performed a simple morphological analysis of the identifications using the stellarity parameter from the SExtractor software. In Fig. 8 we show the distribution of stellarity for the identifications listed in Table 2. The majority of identifications are non-stellar. As the majority of X-ray sources have a counterpart with , SExtractor is able to make a reasonably confident judgment about their morphologies. Taking a crude split between stars and galaxies at a stellarity level of 0.5, we obtain Fig. 9, which gives a summary of the ‘stellar’ (ie mostly QSO) and ‘galaxy’ content of the survey. We see that the peak of the distribution for all morphological types is around .
At bright magnitudes () the galaxies appear visually to be mainly ellipticals, although some definite spirals and lenticulars are also seen. At fainter magnitudes there are many low surface brightness objects, which are probably disc galaxies, together with some more compact objects which may be QSOs or compact galaxies. These results are broadly consistent with the findings of other Chandra surveys (eg Koekemoer et al. 2002) but we leave proper morphological classification to a later paper.
We also note a number of cases where the optical postage stamps show an apparent excess number of galaxies, eg sources 145 (perhaps accounting for the large listed X-ray/optical offset), 162 and 192. However as Chandra is not well suited to the detection of extended low-surface brightness emission, we leave proper discussion of the cluster content of our survey until later, when the XMM-Newton data can be included.
5.2 X-ray/Optical Flux Distributions
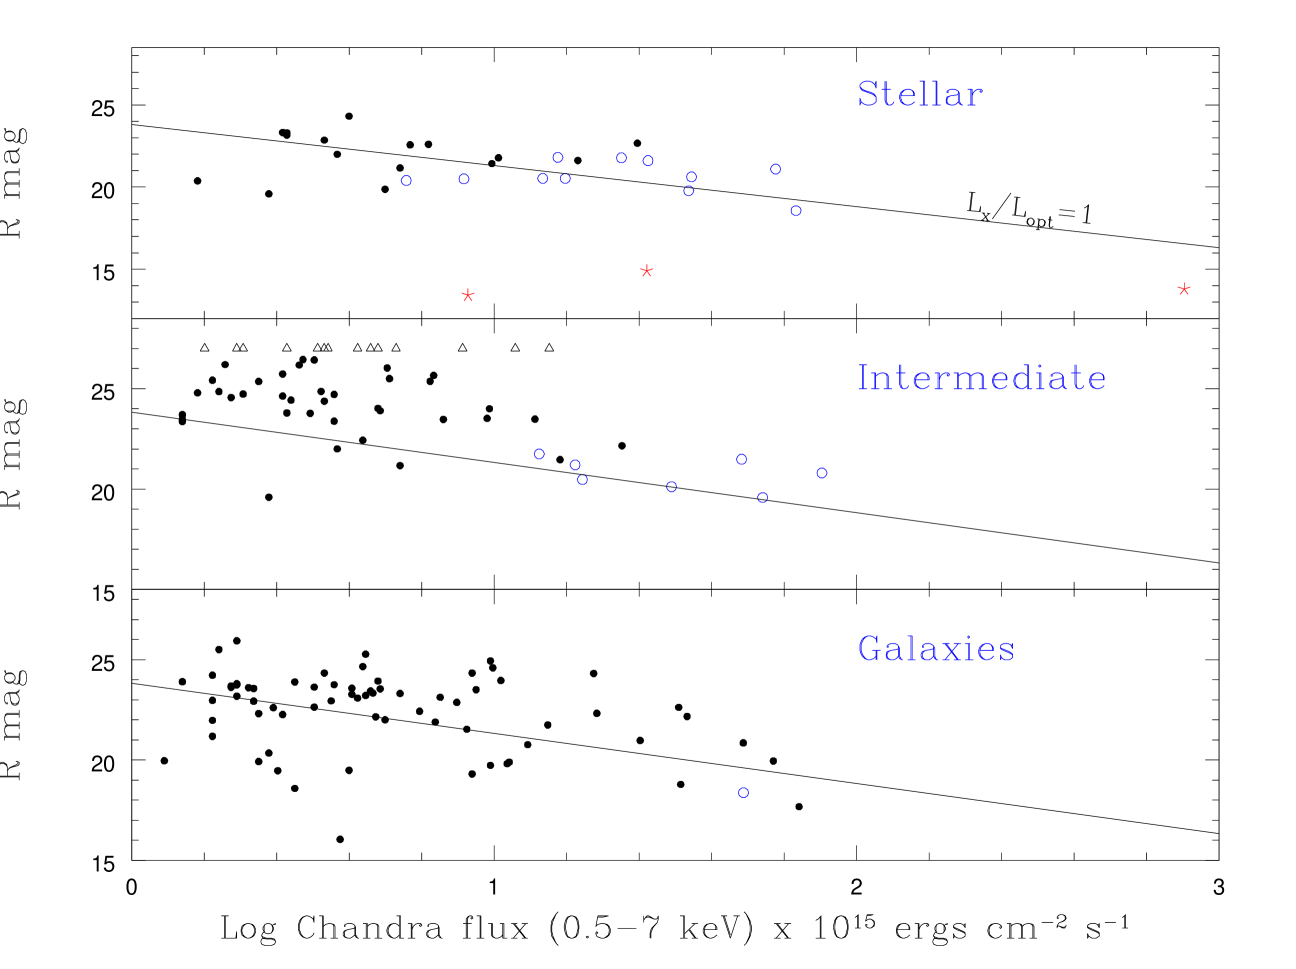
Previous authors (eg Giacconi et al. 2002) have shown that there is a wide range of X-ray/optical ratios amongst the identifications in the very deep Chandra surveys. Here we present the X-ray/optical ratios for the sources in our less deep survey (Fig. 10). We also split our identifications into three morphological classes. In Fig. 10 we define ‘stellar’ objects to have stellarity , ‘galaxies’ to have stellarity and all other stellarities are classified as ‘intermediate’. Using these rather strict definitions, our ‘stellar’ and ‘galaxy’ identifications should be unequivocal. In all panels we present objects which have previously been classified spectroscopically as ‘QSOs’ with open circles. In all panels we show the (unity) line of X-ray/optical ratio, , characteristic of unabsorbed AGN (eg Stocke et al. 1991). We follow the most widely used definition of , as given by Stocke et al. In Appendix B we discuss the conversion of the relationship between the optical and X-ray bands used by Stocke and those used here. We also compare our definition of with the very similar, but not absolutely identical, one of Giacconi et al. (2002).
A number of conclusions are obvious from examination of Fig. 10. Amongst the ‘stellar’ identifications, the galactic stars lie, as expected, well below the unity line. With only about 2 or 3 exceptions, all of the other stellar objects, including the previously spectroscopically classified broad line objects, have optical magnitudes within 2 mags of the unity line, in agreement with the typical spread in found by Stocke et al. (1991) for broad line AGN. Thus there are probably very few stars in our sample and the QSOs are, in general, not greatly absorbed. Incidentally, we note a very good correspondence between morphological classification as a stellar object via the stellarity indicator and spectral classification as a QSO. See Tables 2 and 5 for more details.
The distribution of definite galaxies around the unity line is very wide. The objects below the line (mostly bright elliptical galaxies) could be either low luminosity AGN, possibly including advective flow AGN (di Matteo & Fabian 1997) where the light from the host galaxy dominates the optical light, starburst galaxies, or low luminosity BL Lacs. However, typically pure starburst galaxies have and so would lie more than 5 magnitudes below the unity line. Although some galaxies lie that far from the line, and so may be starburst dominated, most do not and so, if they do contain a starburst component, they must also contain another component of higher , eg an AGN.
However most galaxies lie above the unity line, with an average separation from the line of roughly twice that of the stellar objects. A combination of absorption and moderately high redshift is required to produce . Absorption will preferentially remove lower energy X-rays, but redshift will bring the less absorbed, higher energies, into the observing band. However redshift brings the more absorbed UV into the optical observing band. As the point-like active nucleus is then not bright in the optical observing band, the optical light will be dominated by the host galaxy and the object will have a low stellarity. This conclusion is robust against chance identifications as, if the optical identification listed in Table 2 is not correct then the correct identification will be even fainter and so of higher .
Where redshifts are available for faint objects in other Chandra surveys (eg Rosati et al. 2002; Crawford et al. 2002; Barger et al. 2001), values around unity are found, particularly for the type 2 AGN. Although we do not yet have spectroscopic redshifts for the high galaxies in our survey, we can make crude redshift estimates, assuming that the galaxies do host absorbed AGN and so the host galaxies will typically be more luminous than (eg Crawford et al. 2001). Assuming star formation histories and hence evolutionary and K-corrections similar to those invoked to explain the faint galaxy counts (Metcalfe et al. 2001), then for the faint galaxies which lie mainly in the range , redshifts in the range 0.5 to 2 (with slightly higher redshifts being allowable for late type galaxies) are therefore generally appropriate unless the host is considerably more luminous than . For even fainter identifications, the hosts must either be at even higher redshift, or be less luminous than .

The ‘intermediate’ objects contain, at brighter X-ray and optical fluxes, some spectroscopically confirmed QSOs which lie close to the unity line. In the magnitude range , where SExtractor can produce a reasonably reliable classification, almost all of the intermediate objects have an optical FWHM compared to only half of the galaxy sample in the same magnitude range. These intermediate objects may therefore have contributions from both a host galaxy and an unresolved AGN core to their optical light. Chandra counterparts with have unreliable morphological classifications and are placed, by SExtractor, within the ‘intermediate’ class. These faint objects are mostly of high and so are more likely to be (absorbed) galaxies than stellar objects.
Although our sources (of all stellarity combined) generally straddle the unity line, more lie above it than below. Thus our distribution differs, at first sight, from the deeper sample of Giacconi et al. (2002) which has many sources of low below an X-ray flux of ergs cm-2 s-1 (0.5-10 keV), mostly associated with nearby optically bright galaxies (cf Hornschemeier et al. 2001) which we do not detect. However above the limiting flux of our sample, their distribution of is similar to ours.
6 Comparison with previous ROSAT Survey
6.1 Accuracy of ROSAT Positions
We list, in Table 5, the Chandra, and ROSAT, positions of the ROSAT sources from McHardy et al. (1998) which are covered by the present Chandra observations. For comparison, the flux limit of the Chandra survey, on axis, in the ROSAT band ( keV), is ergs cm-2 s-1 (assuming ) compared with the flux limit of the ROSAT survey of ergs cm-2 s-1 . We searched for Chandra sources within a pessimistically large radius of 20 arcsec of the ROSAT X-ray position. In total, 76 ROSAT sources were found to have a corresponding Chandra source. ROSAT sources R9, R16, R29, R78, R84 and R100 were off the edge of any of the ACIS-I chips, sources R98, R111 and R126 were on the very edge of a chip and sources R43, R105 and R123 were very far from the Chandra axis (, and respectively). These sources are therefore not listed in Table 5.
Of the ROSAT sources not detected by Chandra , but within the Chandra field of view (R34, R97, R108, R117, R129, R133 and R135), only R34, R117 and R129 are within of a Chandra pointing and so might perhaps be detectable. R34 was catalogued as a cluster and is clearly detected as an extended source by XMM-Newton (the XMM-Newton observations will be presented elsewhere; Mason et al., in preparation; Page et al. 2003). R117 is also easily detected by XMM-Newton. There is a hint of an extension, although it is hard to be certain, and the X-ray spectrum appears to be very soft. R129 is not detected by XMM-Newton but was detected by our (unpublished) ROSAT HRI observations, indicating variability. (The HRI source was from the original ROSAT PSPC source but not on the originally suggested identification.). Thus Chandra detects almost all of the ROSAT sources within its field of view. A small amount of variability, together with reduced sensitivity far off the Chandra axis, is sufficient to account for the rest. There is no evidence that any of the ROSAT sources were false.
Within the search radius around the ROSAT sources we expect 8 random Chandra coincidences, approximately half of which will lie beyond . Therefore the 3 sources which we note in Fig. 11 beyond are probably random coincidences and so should be removed before determining average ROSAT–Chandra offsets. For 6 ROSAT sources (R5, R17, R47, R60, R109 and R120) we detect 2 Chandra counterparts. With the exception of R120, which is noted in McHardy et al. as being a potential cluster candidate, one Chandra counterpart is considerably closer to the ROSAT centroid and only the closer counterpart to these six ROSAT sources is listed in Table 5.
We note that R23, the one relatively bright ROSAT source where Chandra finds a counterpart far off (), has 2 counterparts in our HRI image. The second counterpart (not detected by Chandra ) is associated with a NELG on the opposite side of the ROSAT errorbox, a likelihood discussed in McHardy et al. Thus the ROSAT source is confused and its centroid ended up partway between these 2 sources.
In Fig. 11 we plot the resultant ROSAT–Chandra offsets as a function of ROSAT flux. Although it makes little difference, we do not include sources which are identified with clusters or groups as our present PSF-fitting source searching, which is tuned to detect unresolved sources, is not well suited to detecting or determining centroid positions for clusters. We do, however, include sources at large Chandra off-axis angles where Chandra positional errors can themselves be significant. Similarly we include ROSAT sources at large ROSAT off-axis angles. Nonetheless the distribution of offsets, even though we retain sources at large Chandra and ROSAT off-axis angles, and probably include some non-real coincidences at large offsets, is almost exactly the same as we predicted in McHardy et al. (1998, fig. 4); eg the mean offset at the lowest ROSAT fluxes (2-3 ergs cm-2 s-1) is 7.2 arcsec (which is reduced to 6.7 arcsec if we omit the potentially spurious source with a ROSAT/Chandra offset ), with a 90 per cent value of arcsec. We therefore confirm the accuracy of the positions in our earlier ROSAT survey.
| ROS | ROSAT | Ch | Chandra | OffC | OffX | Class | Rflag | Conf | |||||
|---|---|---|---|---|---|---|---|---|---|---|---|---|---|
| Num | RA (J2000) Dec | Num | RA (J2000) Dec | (′′) | (′′) | (′) | (′) | ||||||
| 1 | 13:34:51.47 | 37:46:19.9 | 1 | 13:34:51.43 | 37:46:19.1 | 1.0 | 1.0 | 5.5 | 8.9 | MSTAR | 0.00 | * | Y |
| 2 | 13:34:41.66 | 38:00:09.1 | 10 | 13:34:41.83 | 38:00:11.4 | 3.0 | 0.2 | 4.0 | 5.5 | QSO | 0.26 | * | Y |
| 3 | 13:33:42.32 | 38:03:34.6 | 2 | 13:33:42.28 | 38:03:35.9 | 1.4 | 1.4 | 7.9 | 13.9 | QSO | 1.07 | * | Y |
| 5 | 13:34:37.72 | 37:56:05.3 | 8 | 13:34:38.08 | 37:56:03.9 | 4.6 | 0.2 | 5.4 | 1.4 | CLU | 0.57 | (*) | Y |
| 7 | 13:34:17.43 | 37:57:22.1 | 5 | 13:34:17.55 | 37:57:22.6 | 1.5 | 0.3 | 1.7 | 4.7 | QSO | 1.14 | * | Y |
| 10 | 13:34:10.64 | 37:59:55.9 | 9 | 13:34:10.63 | 37:59:56.1 | 0.3 | 0.3 | 1.3 | 7.3 | QSO | 0.38 | * | Y |
| 11 | 13:33:31.98 | 37:46:39.3 | 14 | 13:33:32.03 | 37:46:42.1 | 2.8 | 0.9 | 10.0 | 15.1 | QSO | 0.83 | * | Y |
| 13 | 13:33:58.58 | 37:59:35.8 | 7 | 13:33:58.55 | 37:59:38.5 | 2.7 | 0.4 | 3.2 | 9.0 | QSO | 1.61 | * | Y |
| 15 | 13:34:42.50 | 37:59:16.3 | 18 | 13:34:42.77 | 37:59:15.0 | 3.4 | 0.2 | 3.9 | 4.7 | QSO | 1.14 | * | Y |
| 17 | 13:34:01.03 | 37:54:01.2 | 23 | 13:34:01.04 | 37:54:05.0 | 3.7 | 0.1 | 5.5 | 7.1 | QSO | 1.64 | (*) | Y |
| 18 | 13:35:44.55 | 37:51:39.8 | 12 | 13:35:44.70 | 37:51:40.4 | 1.9 | 0.9 | 7.4 | 13.7 | QSO | 1.62 | * | Y |
| 20 | 13:35:30.06 | 37:57:51.1 | 30 | 13:35:30.35 | 37:57:49.5 | 3.8 | 0.8 | 6.0 | 11.0 | QSO | 1.39 | * | Y |
| 21 | 13:34:31.16 | 37:48:31.4 | 3 | 13:34:31.35 | 37:48:31.5 | 2.4 | 0.2 | 2.4 | 6.3 | QSO | 1.36 | * | Y |
| 23 | 13:33:44.86 | 37:57:60.0 | 29 | 13:33:44.23 | 37:57:52.5 | 10.5 | 0.8 | 6.1 | 10.9 | QSO | 0.97 | (*) | Y |
| 24 | 13:35:35.31 | 37:57:45.1 | 15 | 13:35:35.53 | 37:57:45.9 | 2.6 | 0.7 | 7.0 | 11.9 | QSO | 1.63 | * | Y |
| 27 | 13:34:09.05 | 38:03:44.5 | 25 | 13:34:08.76 | 38:03:49.4 | 6.1 | 0.4 | 5.0 | 10.7 | GSTAR | — | * | Y |
| 30 | 13:34:51.74 | 37:57:45.8 | 22 | 13:34:52.17 | 37:57:44.7 | 5.3 | 0.1 | 3.0 | 4.2 | QSO | 1.89 | * | Y |
| 31 | 13:33:55.70 | 37:52:54.7 | 17 | 13:33:55.81 | 37:52:58.5 | 4.1 | 0.3 | 5.9 | 8.3 | QSO | 2.14 | * | Y |
| 32 | 13:35:24.75 | 38:05:36.3 | 16 | 13:35:25.45 | 38:05:34.3 | 8.5 | 1.5 | 7.2 | 14.4 | NELG | 0.07 | * | Y |
| 36 | 13:34:38.20 | 38:06:20.7 | 33 | 13:34:38.51 | 38:06:26.5 | 6.8 | 0.7 | 7.9 | 11.7 | G/NELG | 0.23 | * | Y |
| 37 | 13:34:23.96 | 37:46:16.1 | 38 | 13:34:24.61 | 37:46:15.3 | 7.8 | 0.5 | 3.4 | 8.8 | QSO | 1.57 | * | Y |
| 42 | 13:35:02.90 | 37:50:00.5 | 21 | 13:35:02.85 | 37:49:56.6 | 3.9 | 14.8 | 1.2 | 7.0 | NELG | 0.37 | * | N |
| 47 | 13:35:05.42 | 37:49:54.3 | 20 | 13:35:06.21 | 37:49:52.9 | 9.4 | 0.5 | 0.9 | 7.5 | NELG | 0.36 | * | Y |
| 48 | 13:35:29.05 | 38:04:26.5 | 6 | 13:35:29.77 | 38:04:32.6 | 10.5 | 1.3 | 7.1 | 14.3 | QSO | 0.69 | * | Y |
| 49 | 13:34:46.81 | 37:47:52.2 | 11 | 13:34:46.94 | 37:47:48.5 | 4.0 | 0.2 | 5.0 | 7.2 | CLU? | 0.71 | – | Y |
| 51 | 13:34:00.15 | 37:49:10.2 | 4 | 13:33:59.91 | 37:49:12.1 | 3.4 | 24.3 | 4.1 | 9.2 | NELG | 0.06 | (*) | N |
| 55 | 13:34:47.17 | 37:59:46.5 | 13 | 13:34:47.37 | 37:59:50.1 | 4.3 | 0.5 | 2.9 | 5.5 | QSO | 1.18 | * | Y |
| 56 | 13:34:44.87 | 37:57:24.2 | 53 | 13:34:45.34 | 37:57:22.7 | 5.8 | 0.4 | 4.2 | 3.1 | QSO | 1.89 | * | Y |
| 57 | 13:33:35.51 | 37:54:11.3 | 62 | 13:33:35.61 | 37:54:00.4 | 11.0 | 13.0 | 9.1 | 12.1 | QSO | 1.52 | * | N |
| 58 | 13:34:34.00 | 37:57:03.2 | 203 | 13:34:35.00 | 37:56:50.0 | 17.6 | 15.2 | 4.5 | 2.1 | CLU | 0.31 | * | N |
| 60 | 13:34:08.86 | 37:57:05.7 | 28 | 13:34:08.82 | 37:57:06.9 | 1.3 | 0.2 | 2.1 | 6.0 | NELG? | 0.58 | Y | |
| 61 | 13:33:34.87 | 37:49:16.9 | 49 | 13:33:34.49 | 37:49:12.1 | 6.6 | 0.3 | 9.1 | 13.5 | QSO | 3.43 | * | Y |
| 62 | 13:35:09.32 | 37:48:21.7 | 100 | 13:35:09.75 | 37:48:20.2 | 5.3 | 14.3 | 2.4 | 9.1 | GP/GAL | 0.25 | * | N |
| 63 | 13:34:22.27 | 38:06:16.1 | 41 | 13:34:22.17 | 38:06:21.0 | 5.0 | 1.9 | 7.6 | 12.0 | QSO | 2.59 | * | ? |
| 64 | 13:34:14.48 | 37:51:28.2 | 81 | 13:34:14.71 | 37:51:31.3 | 4.1 | 0.2 | 2.2 | 5.5 | GSTAR | — | * | Y |
| 67 | 13:34:59.90 | 37:56:28.1 | 70 | 13:35:00.20 | 37:56:32.8 | 5.9 | 0.4 | 3.5 | 4.9 | NELG | 0.56 | * | Y |
| 72 | 13:35:15.29 | 37:58:35.6 | 83 | 13:35:15.24 | 37:58:38.4 | 2.8 | 0.4 | 3.0 | 8.5 | QSO | 2.81 | * | Y |
| 73 | 13:35:16.99 | 37:54:18.9 | 86 | 13:35:17.33 | 37:54:15.5 | 5.3 | 0.6 | 4.0 | 8.0 | G/QSO? | — | Y | |
| 74 | 13:34:07.63 | 38:06:20.2 | 60 | 13:34:08.20 | 38:06:28.5 | 10.6 | 10.2 | 7.7 | 13.0 | CLU | 0.38 | * | N |
| 75 | 13:35:17.36 | 38:02:45.7 | 32 | 13:35:17.64 | 38:02:47.3 | 3.7 | 0.3 | 4.1 | 11.3 | QSO | 1.38 | * | Y |
| 77 | 13:35:32.63 | 37:45:49.0 | 98 | 13:35:31.98 | 37:45:36.0 | 15.1 | 1.0 | 7.0 | 14.2 | GRP | 0.31 | (*) | Y |
| 80 | 13:34:11.20 | 37:47:54.6 | 66 | 13:34:11.28 | 37:47:57.5 | 3.0 | 0.4 | 2.4 | 8.5 | GAL? | 0.33 | Y | |
| 82 | 13:35:15.82 | 37:52:41.1 | 19 | 13:35:15.92 | 37:52:40.7 | 1.2 | 0.1 | 2.5 | 8.0 | QSO? | — | Y | |
| 85 | 13:34:08.40 | 37:54:42.5 | 58 | 13:34:08.54 | 37:54:41.8 | 1.8 | 4.8 | 4.4 | 5.6 | NELG | 0.30 | * | N |
| 87 | 13:33:43.02 | 37:45:18.9 | 46 | 13:33:43.28 | 37:45:11.1 | 8.4 | — | 8.6 | 14.3 | BLANK? | — | – | – |
| 88 | 13:33:37.27 | 37:47:59.7 | 73 | 13:33:37.54 | 37:47:57.3 | 3.9 | — | 8.6 | 13.6 | ? | — | – | – |
| 90 | 13:35:12.58 | 37:44:18.2 | 34 | 13:35:12.69 | 37:44:18.7 | 1.5 | 1.1 | 6.5 | 12.6 | QSO? | — | – | Y |
| 91 | 13:34:58.10 | 38:04:26.4 | 103 | 13:34:58.38 | 38:04:30.4 | 5.2 | 0.5 | 4.5 | 10.6 | QSO | 2.01 | * | Y |
| 92 | 13:34:01.00 | 37:46:52.5 | 48 | 13:34:01.16 | 37:46:47.9 | 5.0 | 0.3 | 4.7 | 10.6 | QSO | 1.59 | * | Y |
| 93 | 13:33:53.16 | 38:02:00.1 | 72 | 13:33:53.53 | 38:02:04.5 | 6.2 | 9.2 | 5.2 | 11.3 | NELG | 0.60 | * | N |
| 94 | 13:33:46.42 | 38:00:26.1 | 78 | 13:33:46.56 | 38:00:22.2 | 4.2 | 7.7 | 5.7 | 11.4 | NELG | 0.06 | * | N |
| 96 | 13:34:58.47 | 37:50:23.2 | 160 | 13:34:58.83 | 37:50:17.7 | 7.0 | 21.3 | 1.8 | 6.2 | CLU | 0.38 | (*) | N |
| 99 | 13:35:03.70 | 37:44:27.3 | 61 | 13:35:03.71 | 37:44:09.4 | 17.8 | — | 6.6 | 11.8 | BLANK | — | – | – |
| 101 | 13:34:02.50 | 37:51:29.3 | 43 | 13:34:02.56 | 37:51:29.5 | 0.8 | 0.3 | 4.0 | 7.5 | QSO | 1.35 | * | Y |
| 103 | 13:33:30.87 | 37:48:06.1 | 56 | 13:33:30.72 | 37:48:15.5 | 9.5 | 7.7 | 9.9 | 14.6 | NELG | 0.20 | * | N |
| 104 | 13:34:31.63 | 37:49:58.6 | 55 | 13:34:31.24 | 37:49:53.1 | 7.2 | 0.3 | 2.1 | 5.0 | QSO | 1.49 | * | Y |
| 107 | 13:33:51.20 | 37:49:45.7 | 128 | 13:33:50.50 | 37:49:46.9 | 8.3 | — | 5.9 | 10.4 | ? | — | – | – |
| 109 | 13:33:39.87 | 37:52:26.6 | 143 | 13:33:40.73 | 37:52:42.1 | 18.6 | 2.1 | 8.4 | 11.3 | QSO? | 2.12 | – | ? |
| ROS | ROSAT | Ch | Chandra | OffC | OffX | Class | Rflag | Conf | |||||
|---|---|---|---|---|---|---|---|---|---|---|---|---|---|
| Num | RA (J2000) Dec | Num | RA (J2000) Dec | (′′) | (′′) | (′) | (′) | ||||||
| 110 | 13:35:12.13 | 38:02:42.5 | 42 | 13:35:12.54 | 38:02:46.9 | 6.6 | 0.8 | 3.4 | 10.7 | QSO | 1.85 | * | Y |
| 112 | 13:34:35.85 | 37:54:22.7 | 94 | 13:34:35.86 | 37:54:19.0 | 3.7 | — | 5.6 | 0.5 | BLANK? | — | – | – |
| 113 | 13:34:27.64 | 37:41:35.1 | 104 | 13:34:28.58 | 37:41:27.7 | 13.4 | — | 8.3 | 13.4 | ? | — | – | – |
| 115 | 13:35:22.70 | 37:49:16.6 | 36 | 13:35:22.83 | 37:49:11.1 | 5.7 | 21.5 | 3.4 | 10.6 | MSTAR | — | * | N |
| 116 | 13:34:54.55 | 38:08:01.5 | 109 | 13:34:54.02 | 38:07:56.3 | 8.2 | — | 8.0 | 13.6 | ? | — | – | – |
| 118 | 13:34:23.88 | 37:42:57.1 | 110 | 13:34:24.02 | 37:42:57.8 | 1.8 | 0.5 | 6.7 | 12.1 | QSO | 1.00 | * | Y |
| 119 | 13:34:14.56 | 37:52:26.1 | 119 | 13:34:14.27 | 37:52:31.6 | 6.4 | 15.3 | 3.2 | 5.0 | KSTAR? | — | – | N |
| 120 | 13:35:19.35 | 37:43:06.3 | 77 | 13:35:19.35 | 37:43:18.1 | 11.8 | — | 7.8 | 14.2 | ? | — | – | – |
| 120 | 13:35:19.35 | 37:43:06.3 | 96 | 13:35:19.24 | 37:42:59.6 | 6.8 | — | 8.1 | 14.4 | ? | — | – | – |
| 121 | 13:35:17.91 | 37:55:32.6 | 155 | 13:35:18.49 | 37:55:33.2 | 6.9 | 3.2 | 5.3 | 8.2 | NELG | 0.31 | * | N |
| 122 | 13:34:13.49 | 38:07:12.9 | 88 | 13:34:13.77 | 38:07:23.0 | 10.7 | — | 8.5 | 13.4 | ? | — | – | – |
| 124 | 13:34:21.33 | 38:04:46.0 | 133 | 13:34:21.89 | 38:04:50.3 | 8.0 | — | 6.1 | 10.5 | ? | — | – | – |
| 125 | 13:33:37.15 | 37:56:37.4 | 105 | 13:33:37.05 | 37:56:29.7 | 7.8 | 1.4 | 7.8 | 11.9 | QSO | 1.68 | * | Y |
| 127 | 13:34:57.11 | 37:49:40.1 | 112 | 13:34:57.28 | 37:49:43.5 | 3.9 | 11.5 | 2.3 | 6.4 | NELG? | 0.25 | (*) | N |
| 128 | 13:34:49.84 | 38:06:54.8 | 92 | 13:34:50.74 | 38:07:05.7 | 15.3 | 22.3 | 7.4 | 12.7 | GAL? | 0.26 | – | N |
| 130 | 13:33:43.40 | 37:50:32.0 | 79 | 13:33:42.48 | 37:50:27.4 | 11.9 | — | 7.5 | 11.6 | BLANK | — | – | – |
| 131 | 13:35:19.28 | 37:58:24.8 | 101 | 13:35:20.07 | 37:58:24.1 | 9.4 | 20.3 | 3.9 | 9.2 | NELG? | 0.58 | (*) | N |
| 132 | 13:34:46.32 | 37:58:44.4 | 167 | 13:34:46.61 | 37:58:40.3 | 5.3 | 0.7 | 3.3 | 4.4 | NELG | 0.22 | * | Y |
| 134 | 13:34:01.06 | 38:01:28.5 | 84 | 13:34:00.87 | 38:01:25.0 | 4.1 | 25.1 | 3.7 | 9.8 | NELG | 0.25 | (*) | N |

6.2 Accuracy of ROSAT Identifications
In Table 5 we list the offset between the Chandra position and the position of the optical counterpart as found on the Subaru image (or APM plate for bright stars). The optical coordinate frame of our earlier CFHT CCD imaging as listed in McHardy et al. (1998) was based on FK5 stars scanned on POSS I survey plates, and the current Subaru coordinate frame is based on FK5 stars scanned on POSS II survey plates. Nonetheless the positions of unsaturated stellar objects on the CFHT and Subaru images agree to better than arcsec. The SExtractor analysis on the Subaru image, however, produces a more reliable centroid position for extended sources than did our earlier analysis. Taking into account variations due to off-axis Chandra angle, we can safely confirm any ROSAT identifications where the (Chandra - ROSAT optical position) offset is . The majority of the identifications are therefore either unambiguously correct, or incorrect. Only two sources have uncertain optical counterparts: R63 (C41) and R109 (C143). R63 is optically identified with a QSO, but is offaxis in the Chandra observation, and therefore the positional accuracy may be worse in this case. R109 is listed in McHardy et al. as being in a very confused region in the optical, and therefore X-ray source confusion may be a problem here, but is observed at from the Chandra axis which may also contribute to the larger ROSAT–Chandra offset.
There has been considerable discussion regarding the reality of the NELGs as identifications in McHardy et al. and so we consider them further here. A variety of confidence classes were assigned to identifications in McHardy et al. so let us consider the highest confidence class, designated by ‘*’. Although most of the identifications are either unambiguously correct or incorrect, there is some uncertainty regarding R43, R85 and R117. In the case of R85 there is moderately strong radio emission (Seymour et al., in preparation) from the optical NELG. However the Chandra position is too far () from the optical galaxy for it to be considered the major source of the X-rays, although it could be a lesser contributor, and so for these purposes we consider it an incorrect identification. In very preliminary analysis of the XMM-Newton observations (Mason et al., in preparation) very soft spectrum X-ray emission comes from the optical position of R117 and, in both the Chandra and XMM-Newton images, no other source of X-ray emission is detectable in the ROSAT errorbox. R117 is a large (arcsec) galaxy (see Gunn et al. 2001), with extended radio emission, and the probability is that XMM-Newton is detecting extended X-ray emission which our current Chandra source detection algorithm is not tuned to detect, in this faint source. We therefore consider it a correct identification with starburst emission being a major contributor to its X-ray emission, consistent with its very low ratio. R43 is off the Chandra field and towards the edge of the XMM-Newton field, so sensitivity is low. There is a very faint source in the XMM-Newton image, close to the proposed optical counterpart to R43, but its position cannot be determined to better than 4 arcsec. However R43 coincides with by far the brightest radio source in the ROSAT field. We therefore class R43 as probably a correct identification.
Thus of the higher confidence NELGS, 7/13 are confirmed although the lower confidence NELGs are generally not confirmed. The incorrect ROSAT identifications, of all types, mostly lie at large distances from the ROSAT centroid and so do not have the highest confidence classification. The number of chance NELG misidentifications is a little larger than initially estimated ( half as opposed to one third of the sample) but not outside of reasonable limits. The NELGS, as a class, are certainly confirmed as being significant emitters of soft X-rays although, physically, they are probably a mixture of AGN and starburst, even within the same galaxy, as we stated in McHardy et al. (1998).
We also note that not all QSOs were confirmed as the correct identification by Chandra, eg R57. Although variability is the more likely physical explanation, we should perhaps not automatically assume that every QSO that is found in an X-ray errorbox is the only source of the emission.
6.3 Differences between the Chandra and ROSAT sources
We have shown above (Section 6.1) that Chandra detects all of the ROSAT sources that one might reasonably have expected it to detect. The ROSAT survey limit of ergs cm-2 s-1 ( keV) corresponds to a flux of ergs cm-2 s-1 in the Chandra keV band, assuming an average source energy spectral index of . In our Chandra sample, the brightest 126 sources lie above this flux limit, of which 74 are detected by ROSAT. Approximately two thirds of the ‘stellar’ Chandra sources () are detected by ROSAT compared to only about a half of those sources with optically resolved () counterparts. McHardy et al. (1998) found that only 20% of the ROSAT sources showed detectable flux variability between the ROSAT AO1 and AO4 observations. Thus variability cannot be the major reason for the difference. The simplest reason for the difference is absorption in some of the Chandra sources, which would not be surprising in view of the hard spectrum of the XRB. To crudely quantify the absorption needed, an absorbing column of atoms cm-2 is equivalent to an exponential cut-off energy of 2 keV (the energy usually taken as the upper bound of the standard ROSAT PSPC band). For standard gas to dust ratios, that column is also equivalent to an optical obscuration of mag, which is sufficient to obscure optical emission from the AGN. Thus obscuration is entirely consistent with the fact that ROSAT preferentially detects objects where the point-like optical emission from the nucleus is visible. Indeed Piconcelli et al. (2002) and Mainieri et al. (2002) demonstrate the presence of absorption at approximately the required level in deep XMM-Newton surveys. Page et al. (2003) also confirm absorption in some of our present Chandra sources. A full treatment of the spectral and variability properties of the present Chandra sample, based on the XMM-Newton data, will be presented in future papers.
7 Conclusions
We detect 214 Chandra sources above a likelihood value of 25 (approximately ) above a flux of ergs cm-2 s-1 ( keV). The fluxes are typical of the sources which provide the bulk of the keV XRB. The positional accuracy of our survey has been investigated thoroughly, and quantified. For the 151 sources which lie within of a Chandra pointing axis, the positions are good to and we expect very few () chance coincidences brighter than . At larger off-axis angles the positional accuracy decreases, although the majority of the remaining sources are still expected to be correctly identified. The optical identification content of our sample is similar to that of the very deep Chandra surveys (eg Giacconi et al. 2002) to our X-ray flux limit. We do not detect, in large numbers, the very low luminosity X-ray galaxies which are detected at lower X-ray fluxes in the deepest surveys. However, owing to the larger area of our survey compared to the typical very deep survey, we provide relatively large numbers of sources with fluxes around the knee in the medium energy source counts. We briefly summarise our optical content here.
The very large majority of the X-ray sources have an optical counterpart, with the distribution peaking at . However a small number have no counterpart to . Elliptical galaxies dominate the bright () identifications (cf Mushotzky et al. 2000) but both high and low surface brightness objects are found at fainter magnitudes. A useful summary of our optical identification content is provided by Fig. 10 which combines X-ray/optical flux ratios with the simple ‘Stellarity’ optical morphological parameter. For any given X-ray flux, and particularly at fainter fluxes, there is a very large spread ( mags) in the optical magnitudes of the ‘galaxy’ counterparts (less so for the point-like identifications), indicating a wide range of emission mechanisms. For the faintest optical galaxies, absorption together with a moderate/high redshift is required to produce the observed X-ray/optical ratios. A redshift range of, very roughly, , is consistent with the observed galaxy magnitudes. and the estimated luminosities are only moderate ( ergs s-1). Although most of the Chandra counterparts are classed as galaxies or intermediate, a non-negligible number of definitely ‘stellar’ counterparts are found. Galactic stars clearly show up as having lower X-ray/optical ratios than the other stellar objects which cluster around the line of , indicating that they are probably mostly relatively unabsorbed QSOs.
Excluding the confirmed galactic stars and bright galaxies of low , there are more galaxies than stellar objects. If, as argued earlier, the galaxies are AGN in which the optical source is obscured, these results are consistent with the greater numbers of type 2, compared to type 1, Seyfert galaxies found in optical samples (Maiolino & Rieke 1995) and with spectral synthesis models of the X-ray background (eg Comastri et al. 1995; Gilli et al. 2001).
The positions of the X-ray sources from our ROSAT survey were shown to be in excellent agreement with the predictions based on the simulations in McHardy et al. (1998). Chandra detects all of the ROSAT sources that one might reasonably have expected it to detect (Section 6.1). There is no evidence that any of the ROSAT sources were false. Most of the ROSAT identifications are confirmed. In particular 7 of the 13 highest confidence identification NELGs are confirmed. The X-ray emission in the more luminous NELGs is probably dominated by AGN but the lowest luminosity NELG is starburst dominated.
If, conversely, we ask how many of the Chandra sources we would have expected ROSAT to detect then, assuming and no absorption, we expect 126 compared to 74 actually detected. Chandra sources with ‘stellar’ optical counterparts were preferentially detected by ROSAT . The different numbers, and the preferential detection of sources with ‘stellar’ counterparts is probably due to intrinsic absorption in many of the Chandra sources and is not particularly surprising in light of the ‘hard’ spectrum of the medium energy XRB. Page et al. (2003) present intial XMM-Newton spectra of our Chandra sources which confirms the existence of substantial absorption. More detailed spectra will be presented elsewhere.
The sources presented here, with fluxes near the ‘knee’ of the medium energy X-ray source counts, constitute an excellent sample on which to study the astrophysics of the contributors to the XRB and the relationship of those contributors to the dominant populations in other wavebands. Initial papers are presented by Page et al. (2003) and Gunn et al. (2003) and other are in preparation. These papers rely on the accurate optical identification of the X-ray sources, which is the main aim of the present paper.
References
- [] Alexander D. M., Brandt W. N., Hornschemeier A. E., Garmire G. P., Schneider D. P., Bauer F. E., Griffiths R. E., AJ, 2001, 122, 2156
- [] Barger A.J., Cowie L.L., Mushotzky R.F., Richards, E.A., 2001, AJ, 121, 662
- [] Barger A.J., Cowie L.L., Brandt W.N., Capak P., Garmire G.P., Hornschemeier A.E., Steffen A.T., Wehner E.H., 2002, AJ, 124, 1839
- [] Bauer F. E., Alexander D. M., Brandt W. N., Hornschemeier A. E., Vignali C., Garmire G. P., Schneider D. P., 2002, AJ, 124, 2351
- [] Bertin E., Arnouts S., 1996, A&AS, 117, 393
- [] Brandt W.N., et al., 2001a, AJ, 122, 1
- [] Brandt W.N., et al., 2001b, AJ, 122, 2810
- [] Branduardi-Raymont G., et al., 1994, MNRAS, 270, 947
- [] Browne I.W.A., Marcha M.J.M., 1993, MNRAS, 261, 795
- [] Cash W., 1979, ApJ, 228, 939
- [] Comastri A., Setti G., Zamorani G., Hasinger G., 1995, A&A, 296, 1
- [] Crawford C.S., Gandhi P., Fabian A.C., Wilman R.J., Johnstone R.M., Barger A.J., Cowie L.L., 2002, MNRAS, 333, 809
- [] Crawford C.S., Fabian A.C., Gandhi P., Wilman R.J., Johnstone R.M., 2001, MNRAS ,324, 427
- [] di Matteo T., Fabian A.C., 1997, MNRAS, 286, L50
- [] Fanson J.L., Fazio G.G., Houck J.R., Kelly T. Rieke G.H., Tenerelli D.J., Whitten M., 1998, SPIE, 3356, 478
- [] Fukugita M., Shimasaku K. and Ichikawa T., 1995, PASP, 107, 945
- [] Gendreau K.C. et al., 1995, PASJ, 47, L5
- [] Giacconi R. et al., 2001, ApJ, 551, 624
- [] Giacconi R. et al., 2002, ApJS, 139, 369
- [] Gilli R., Salvati M., Hasinger G., A&A, 2001, 366, 407
- [] Griffiths R.E., Padovani P., 1990, ApJ, 360, 483
- [] Gunn K.F. et al., 2001, MNRAS, 324, 305
- [] Gunn K. F. et al., 2003, AN, 324, 105
- [] Hasinger G., Burg R., Giacconi R., Schmidt M., Trümper J., Zamorani G., 1998, A&A, 329, 482
- [] Hornschemeier A.E. et al., 2000, ApJ, 541, 49
- [] Hornschemeier A.E. et al., 2001, ApJ, 554, 742
- [] Hornschemeier A.E., Brand, W.N., Alexander D.M., Bauer F.E., Garmire G.P., Schneider D.P., Bautz M.W. and Chartas G., 2002, ApJ, 568, 82
- [] Hogg D.W., Pahre M.A., McCarthy J.K., Cohen J.G., Blandford R., Smail I., Soifer B.T., 1997, MNRAS, 288, 404
- [] Jansen F., et al., 2001, A&A, 365, L1
- [] Koekemoer A.M. et al., 2002, ApJ 567, 657
- [] Lumb D.H. et al., 2000, SPIE, 4140, 22
- [] Maiolino R., Rieke G.H., 1995, ApJ, 454, 95
- [] Mainieri V., Bergeron J., Hasinger G., Lehmann I., Rosati P., Schmidt M., Szokoly G., Della Ceca R., 2002, A&A, 393, 425
- [] Mathews W.G., Brighent, F., 1998, ApJ, 493, L9
- [] McHardy I.M. et al., 1998, MNRAS, 295, 641
- [] Metcalfe N., Shanks T., Fong R., Jones L.R., 1991, MNRAS, 249, 498
- [] Metcalfe N., Shanks T., Campos A., McCracken H.J. and Fong R., 2001, MNRAS, 323, 795
- [] Miyazaki S., Sekiguchi M., Imi K., Okada N., Nakata F., Komiyama Y., 1998, SPIE, 3355, 363
- [] Monet D.B.A. et al., 1998, VizieR Online Data Catalog.
- [] Moretti A., Campana S., Lazzati D., Tagliaferri G., ApJ, in press (astro-ph/0301555)
- [] Mushotzky R.F., Cowie L.L., Barger A.J., Arnaud K.A., 2000, Nat, 404, 459
- [] O’Sullivan E., Forbes D.A., Ponman T.J., 2001, MNRAS, 328, 461
- [] Page M. J. et al., 2003, AN, 324, 101
- [] Piconcelli E., Cappi M., Bassani L., Fiore F., Di Cocco G., Stephen J. B., 2002, A&A, 394, 835
- [] Roberts T., Warwick R., 2000, MNRAS, 315, 98
- [] Rosati P. et al., 2002, ApJ, 566, 667
- [] Schmidt M., et al., 1998, A&A, 329, 495
- [] Setti G., Woltjer L., 1989, A&A, 224, L21
- [] Smail I., Hogg D.W., Yan L., Cohen J.G., 1995, ApJL, 449, L105
- [] Stark, A.A., Gammie, C.F., Wilson, R.W., Bally, J., Linke, R.A., Heiles, C. and Hurwitz, M., 1992. ApJS, 79, 77
- [] Stocke J.T., Morris S.L., Gioia I.M., Maccacaro T., Schild R., Wolter A., Fleming T.A., Henry J.P., 1991, ApJS, 76, 813
- [] Tozzi P. et al., 2001, ApJ, 562, 42
- [] van Altena W.F., 1999, ApJ, 525, 1282
- [] Vignali C., Bauer F. E., Alexander D. M., Brandt W. N., Hornschemeier A. E., Schneider D. P., Garmire G. P., 2002, ApJ, 580, L105
- [] Weisskopf M.C., O’Dell S.L., van Speybroeck L.P., 1996, SPIE, 2805, 2
- [] Wilman R.J., Fabian A.C., 1999, MNRAS, 309, 862
- [] Wise M.W., Davis J.E., Huenemoerder D.P., Houck J.C. and Dewey D., 2000. MARX Technical Manual
Acknowledgments
We thank the staff of the Chandra Observatory for carrying out the observations so well, including ensuring identical roll angles for all observations, and for providing final data products only 4 days after the observations. We also thank the Subaru observatory for the -band SuprimeCam image. We thank Mike Irwin for rapidly obtaining, and scanning, the second epoch Palomar plates for us. We thank Tom Shanks for providing a tabular version of K and evolutionary corrections. This work was supported by grants to a number of authors from the UK Particle Physics and Astronomy Research Council (PPARC) including PPA/G/S/1999/00102 and also by NASA grant G01-2098X. IMcH also acknowledges the support of a PPARC Senior Research Fellowship.
Appendix A Notes on sources with more than one possible counterpart
| Num | Flux | Chandra | R | OffC | OffX | FWHM | Stellar | |||||
|---|---|---|---|---|---|---|---|---|---|---|---|---|
| RA (J2000) Dec | (′′) | (′′) | (′′) | (mag) | (′) | (′) | (′′) | |||||
| 47 | 2.07 | 152.3 | 13:33:32.09 | 37:58:15.86 | -0.68 | 1.35 | 1.51 | 25.3 | 8.40 | 13.27 | 1.59 | 0.36 |
| 56 | 1.81 | 90.7 | 13:33:30.72 | 37:48:15.50 | -0.04 | -0.79 | 0.79 | 24.8 | 9.91 | 14.61 | 1.78 | 0.01 |
| 57 | 1.79 | 70.5 | 13:33:20.30 | 37:57:44.85 | -1.95 | -0.29 | 1.97 | 23.4 | 10.77 | 15.41 | 2.12 | 0.03 |
| 85 | 1.09 | 150.3 | 13:34:13.07 | 37:58:30.96 | -0.17 | -1.83 | 1.84 | 23.7 | 0.51 | 6.05 | 2.63 | 0.02 |
| 95 | 0.91 | 130.6 | 13:34:37.20 | 37:54:36.78 | -1.42 | 1.24 | 1.89 | 27.2 | 6.01 | 0.13 | 1.16 | 0.50 |
| 102 | 0.80 | 54.0 | 13:35:43.14 | 37:53:08.69 | -0.43 | -1.06 | 1.15 | 23.6 | 7.39 | 13.15 | 1.23 | 0.30 |
| 115 | 0.70 | 60.8 | 13:35:36.41 | 37:51:11.58 | 1.92 | 0.42 | 1.96 | 26.3 | 5.68 | 12.25 | 1.84 | 0.67 |
| 122 | 0.66 | 101.1 | 13:34:28.56 | 37:47:07.05 | -1.14 | 1.00 | 1.52 | 24.5 | 2.95 | 7.80 | 2.77 | 0.03 |
| 130 | 0.63 | 72.0 | 13:34:44.09 | 37:44:34.90 | -0.01 | -1.52 | 1.52 | 26.9 | 6.85 | 10.25 | 0.92 | 0.62 |
| 130 | 0.63 | 72.0 | 13:34:44.09 | 37:44:34.90 | 1.26 | -0.73 | 1.45 | 24.5 | 6.85 | 10.25 | 1.93 | 0.12 |
| 149 | 0.50 | 80.1 | 13:34:01.19 | 37:53:49.14 | -0.48 | 1.35 | 1.43 | 22.8 | 5.68 | 7.12 | — | — |
| 154 | 0.47 | 39.9 | 13:35:34.89 | 37:50:28.74 | -0.89 | 1.65 | 1.87 | 25.6 | 5.37 | 12.20 | 1.66 | 0.91 |
| 162 | 0.43 | 30.6 | 13:34:33.62 | 38:05:40.27 | -0.61 | 0.04 | 0.61 | 25.1 | 7.71 | 10.96 | 1.78 | 0.77 |
| 162 | 0.43 | 30.6 | 13:34:33.62 | 38:05:40.27 | 1.73 | -0.65 | 1.85 | 25.3 | 7.71 | 10.96 | 2.46 | 0.11 |
| 170 | 0.37 | 78.8 | 13:34:17.03 | 37:59:49.48 | 1.25 | 1.06 | 1.64 | 22.9 | 1.02 | 6.43 | 1.12 | 0.91 |
| 173 | 0.37 | 63.1 | 13:34:42.90 | 37:52:04.09 | -1.36 | -1.32 | 1.89 | 26.6 | 5.07 | 2.91 | 1.51 | 0.54 |
| 192 | 0.27 | 57.6 | 13:34:21.56 | 37:49:59.82 | -0.83 | 1.51 | 1.72 | 24.7 | 0.46 | 5.63 | 1.77 | 0.57 |
| 200 | 0.24 | 41.7 | 13:35:09.62 | 37:50:11.89 | 0.81 | -1.47 | 1.68 | 23.6 | 0.66 | 7.88 | — | — |
| 202 | 0.23 | 27.2 | 13:35:20.44 | 37:55:29.25 | 0.83 | -1.74 | 1.92 | 25.9 | 5.37 | 8.60 | 2.10 | 0.35 |
| 204 | 0.23 | 26.7 | 13:34:43.12 | 38:00:20.47 | -1.48 | 1.23 | 1.93 | 25.8 | 3.72 | 5.74 | 2.15 | 0.49 |
| 210 | 0.19 | 26.0 | 13:34:33.22 | 37:52:22.40 | -0.13 | 0.99 | 1.00 | 20.6 | 3.75 | 2.48 | 14.05 | 0.03 |
To avoid repetition below, when not clearly stated otherwise, ‘more distant/closer’ means more distant/closer to the Chandra centroid and ‘brighter/fainter than’ means ‘brighter/fainter than the primary candidate listed in Table 2. The sources are labelled either ‘U’, when the true identification is quite uncertain and ‘P’ when the primary identification is probably correct but SExtractor did pick up another, less likely, candidate within of the Chandra centroid.The primary candidate is chosen, unless stated otherwise, on the basis of being closer to the Chandra centroid and being brighter.
47 U The alternate counterpart is more distant
and 0.8mag fainter, although more stellar.
56 U The alternate counterpart is 0.7mag fainter and much more diffuse,
although closer.
57 U The alternate counterpart is 1.7mag fainter and
more distant.
Neither counterpart is particularly close to
the Chandra centroid but the source is from the Chandra axis.
85 P The alternate counterpart is 0.9mag fainter and
more distant.
95 P The alternate candidate is 3.4mag fainter and much more distant
().
102 U In this case the identification is completely uncertain.
The alternate candidate is 0.3mag brighter, but more distant,
and is less stellar.
115 U Both candidates are very faint (26mag) and so could be chance
coincidences. The alternate candidate is more distant.
122 P The alternate candidate is 0.5mag fainter, more
diffuse, and more distant.
130 U The identification may be with a cluster. The alternate candidate
is 0.2mag brigher, but more distant.
149 U The alternate candidate is 0.9mag brighter but
more distant.
154 P The alternate candidate is 1.3mag fainter, and
more distant.
162 U Both candidates are at similar distances from the Chandra
centroid. The alternate candidate is 1.3mag fainter. However
the identification may be with a cluster as other objects are nearby.
170 U The alternate candidate is more distant and 0.4mag
fainter.
173 U The alternate candidate is more distant and 3.5mag
fainter.
188 U SExtractor finds no candidate within . However
examination of the optical image shows a bright galaxy whose centre is
over 3” to the NW. That is too far to be a reasonable
identification. However to the SE, and also to the NW of the galaxy,
there are bright components. We cannot tell if these 2 components are
part of the same structure, eg a bright disc, seen edge on, or whether
they are separate objects, eg QSOs. The SE component lies very close
to the Chandra centroid and so its position is listed in
Table 2.
192 U The identification may be with a cluster. The nominally primary
candidate is closer but 1.2mag fainter.
200 U This source is almost on axis so its position will be very
accurate. Hence we list, as the primary identification, an object which
is 2mag fainter than, but closer to the Chandra centroid than,
the alternative candidate.
202 U The alternate candidate is 4mag fainter and
more distant.
204 U Both candidates have similar magnitudes but the primary candidate
is closer.
210 U There are 2 almost equally likely candidates, at similar
distances. On the basis that it is a relatively bright radio source we list
the fainter, by 2.8mag, and more stellar, as the slightly more
likely candidate.
Appendix B The Definition of
The X-ray/optical ratio has been defined, historically, as the ratio of fluxes in particular bands rather than at particular monochromatic frequencies. In addition the -band is now more widely used in deep surveys than the -band in which the ratio was originally defined. It is therefore not always easy to compare ratios quoted by different observers using different instrumentation.
The most widely used definition of is that used by Stocke et al. (1991), in conjunction with observations from the Einstein Observatory, which is
where is the Johnson magnitude, is the observed keV X-ray flux in units of ergs cm-2 s-1 and all logs are to base 10.
Here our fluxes are measured in the keV band and our optical observations were made in the Cousins band. To obtain an optical flux we use the Cousins -band (Vega) normalisation given by Fukugita et al. (1995) of and multiply by the FWHM bandwidth, given by Fukugita et al. (1995) as 0.1568. We therefore conclude that
where C=9.53, is the Cousins magnitude, is the observed keV X-ray flux in units of ergs cm-2 s-1 .
Converting the Stocke et al. relationship to fluxes in the keV band, in units of ergs cm-2 s-1 we obtain
where K=9.82 for and K=9.74 for .
Thus our relationship and that of Stocke et al. give the same value of for (assuming ) or 0.53 (assuming ). These values of are not unreasonable for extragalactic X-ray sources and so we conclude that we may use our values of , in comparison with those of Stocke et al., to make simple deductions about the nature of the X-ray sources.
We note that Giacconi et al. (2002), although measuring fluxes in the same keV band as us, define as and extrapolate their fluxes to the keV band assuming an energy spectral index, , ie a keV flux of ergs cm-2 s-1 corresponds to a keV flux of ergs cm-2 s-1 . At the latter flux, fig. 16 of Giacconi et al. gives for whereas, at ergs cm-2 s-1 ( keV) our relationship gives . This magnitude offset is not greatly changed by a steeper choice of spectral index, such as may be more appropriate to our slightly brighter sources, but may be due to a different definition of -band flux. The offset is not large, but may be borne in mind when comparing our results (Fig. 10) with those of Giacconi et al. Above a flux level of ergs cm-2 s-1 (0.5-10 keV), our distribution is very similar to that of Giacconi et al. and of the ROSAT distribution of Schmidt et al. (1998). We do not sample the fainter flux levels where Giacconi et al. find many objects of low .