email: gak@stsci.edu 22institutetext: Center for Astrophysical Sciences, Johns Hopkins University, Baltimore, MD, 21218-2686, USA 33institutetext: Mullard Space Science Laboratory, University College London, Holmbury St. Mary, Dorking, Surrey, RH5 6NT, UK 44institutetext: Kitt Peak National Observatory, National Optical Astronomy Observatories, P.O. Box 26732, 950 North Cherry Ave., Tucson, AZ, 85726-6732; rgreen@noao.edu 55institutetext: Dominion Astrophysical Observatory, National Research Council of Canada, Victoria, BC, V8X 4M6, Canada; john.hutchings@hia.nrc.ca
Multiwavelength studies of the Seyfert 1 galaxy NGC7469. I - Far UV observations with FUSE
Abstract
We obtained far-ultraviolet spectra of the Seyfert 1 galaxy NGC 7469 using the Far Ultraviolet Spectroscopic Explorer on 1999 December 6. Our spectra cover the wavelength range 990–1187 Å with a resolution of Å. We see broad emission lines of C iii, N iii, O vi, and He ii as well as intrinsic absorption lines in the O vi resonance doublet. The absorption arises in two distinct kinematic components at systemic velocities of km s-1 and km s-1. Both components are very highly ionized—no significant Ly absorption is present. The higher blueshift component is not quite saturated, and it has a total O vi column density of . It covers more than 90% of the continuum and broad-line emission. The lower blueshift component is heavily saturated and covers only % of the continuum and broad-line emission. It too has a column density of , but this is less certain due to the high saturation. We set an upper limit of on the O vi column density of this component. Its line depth is consistent with coverage of only the continuum, and thus this component may lie interior to the broad emission-line gas. The component at km s-1 has a velocity comparable to the high-ionization X-ray absorption lines seen in the XMM-Newton grating spectrum of NGC 7469, and photoionization models show that the observed column densities of O vi and H i are compatible with their formation in the same gas as that causing the X-ray absorption. The gas at km s-1 has lower ionization and column density, and no significant X-ray absorption is associated with it.
Key Words.:
Galaxies: Active – Galaxies: Individual (NGC 7469) – Galaxies: Quasars: Absorption Lines – Galaxies: Seyfert – Ultraviolet: Galaxies – X-Rays: Galaxies1 Introduction
The Seyfert 1 galaxy NGC 7469 is one of a handful of bright, nearby active galactic nuclei (AGN) that has been intensively studied at multiple wavelengths and monitored extensively in the X-ray, UV, and optical bands (Wanders et al. (1997); Nandra et al. (1998); Collier et al. (1998); Kriss et al. 2000a ). ASCA X-ray spectra (Reynolds (1997); George et al. (1998)) were modeled with absorption edges of O vii and O viii indicative of a warm absorber, and Hubble Space Telescope Faint Object Spectrograph observations show associated UV absorption lines in Ly, N v and C iv. Such X-ray and UV absorption is common in Seyfert 1s, occurring in tandem in roughly half the population (Reynolds (1997); George et al. (1998); Crenshaw et al. (1999)). The X-ray and UV absorbing gas components thus appear to be related, but it is not yet clear whether this is the consequence of a more general phenomenon linking the gas visible at both wavelengths, or if the absorption arises in the same gas with identical physical conditions in both the X-ray and the UV. At high resolution, both the X-ray and the UV absorption is kinematically complex (Kaastra et al. (2001); Kaspi et al. (2000); Kaspi et al. (2002); Crenshaw et al. (1998); Crenshaw et al. (1999); Mathur et al. (1999); Kriss et al. 2000b ). Generally only some of the UV absorption lines have velocities and physical conditions similar to those seen in the X-ray.
The locations of both the X-ray and the UV absorbing media are also highly uncertain. If the outflowing gas originates in the accretion disk, then it may be relatively close to the central engine (e.g., Königl & Kartje (1994); Murray et al. (1995)) and interior to the broad emission-line region. On the other hand, if the absorbing gas is a thermal wind driven off the obscuring torus (Krolik & Kriss (1995); Krolik & Kriss (2001)), then it will lie at distances of roughly 1 pc, be external to the broad-line region, but probably interior to the narrow-line region. Studies of the X-ray absorption variability (NGC 3516; Netzer et al. (2002)) show that at least some of the gas does lie at distances approaching 1 pc. Variability of UV absorption in NGC 4151 suggests distances of tens of parsecs for the absorbing gas (Espey et al. (1998)), and even greater distances for the associated UV absorption seen in some quasars (Hamann et al. (1995); Hamann et al. (1997)).
Using the Far Ultraviolet Spectroscopic Explorer (FUSE), we obtained high-resolution UV spectra below 1200 Å covering the O vi resonance doublet and the high-order Lyman lines. The O vi doublet provides a key link to the X-ray band since high energy transitions from the same ion can be viewed with XMM-Newton. This permits us to directly compare the kinematics and the column densities measured in both wavelength regions as a crucial test for establishing the link between X-ray and UV absorbing gas in Seyferts. XMM-Newton observations of NGC 7469 are discussed in a companion paper (Blustin et al. (2003)).
2 Observations
FUSE observes the far-ultraviolet wavelength range from 912–1187 Å using four independent optical channels. In each channel a primary mirror gathers light for a Rowland-circle spectrograph. Two-dimensional photon-counting detectors record the dispersed spectra. Two of the optical trains use LiF coatings on the optics to cover the 990–1187 Å wavelength range. The other two channels cover shorter wavelengths down to 912 Å using SiC-coated optics. See Moos et al. (2000) for a full description of FUSE and its in-flight performance.
We observed NGC 7469 with FUSE on 1999 December 6 through the 30′′-square low-resolution apertures. Data were obtained on 22 consecutive orbits for a total integration time of 37,803 s. Unfortunately the SiC channels were not properly aligned; the only detectable flux was in the LiF channels. The time-tagged data were processed using v1.8.7 of the FUSE calibration pipeline. Sahnow et al. (2000) describe the standard FUSE data processing steps. We added an additional customized step to normalize and subtract a flat background image from each detector segment. The resulting extracted spectra were merged into a linearized spectrum with 0.05 Å bins. While this rebinning process introduces some correlated error, since each of these bins holds original pixels, the resulting bins are more than 80% statistically independent. Poisson errors and data quality flags are propagated through the data reduction process along with the science data.
To firmly establish the zero-point of our wavelength scale, we compare the positions of low-ionization Galactic absorption lines from species such as Ar i, Fe ii, O i and to the Galactic 21 cm H i velocity as measured by Murphy et al. (unpublished). This requires a shift of Å to be applied to our wavelengths to place them in a heliocentric reference frame. We estimate that the flux scale is accurate to 10%, and that wavelengths are accurate to 15 km s-1.
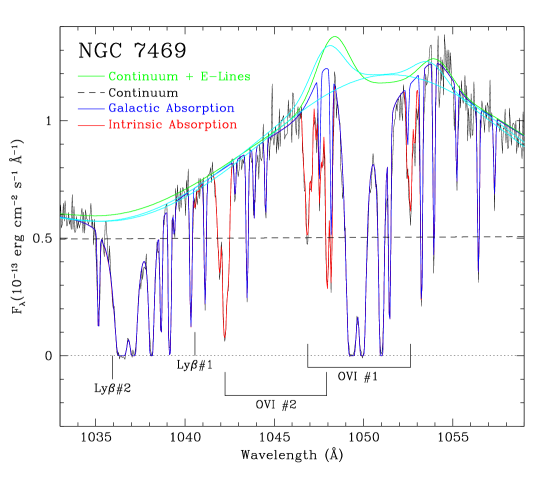
The full merged spectrum is shown in the top panel of Fig. 1. Numerous Galactic absorption features obscure much of the spectrum, so we have constructed a simple model of the interstellar absorption to remove them from the spectrum. We assume a Galactic H i column of at a heliocentric velocity of km s-1 with a Doppler width of 10 km s-1. Heavy elements are included at solar abundances following the depletion pattern typical of warm gas toward Oph (Savage & Sembach (1996)). Matching the molecular hydrogen absorption requires one component with gas at 50 K and a column density of , and a second component with a temperature of 300 K and a total column density of . We show the spectrum of NGC 7469 corrected for this foreground absorption in the lower panel of Fig. 1. Strong, broad O vi emission dominates the spectrum. Weaker broad emission lines of C iii 977, N iii 991, and He ii are also visible, as well as several unidentified emission features. The low broad bump on the red wing of O vi is also present in the FUSE spectrum of Mrk 509 (Kriss et al. 2000b ) as well as in the spectra of low-redshift quasars observed using the Hubble Space Telescope (Laor et al. (1995)). Based on FUSE observations of a large sample of low-redshift AGN, Kriss et al. (2003) have identified this as blended emission due to S iv .

At the high resolution of FUSE, absorption features intrinsic to NGC 7469 are also discernible. Fig. 2 shows the Ly and O vi region of the spectrum in 0.05 Å bins. Here one can see two absorption systems due to the O vi 1032,1038 resonance doublet in the blue wing of the broad O vi emission line. The Ly absorption associated with these systems is weak, if present at all, and severely blended with foreground Galactic absorption. Similarly, no Ly or C iii 977 absorption is visible at shorter wavelengths.
3 Analysis
To measure the emission and absorption line properties of NGC 7469, we model the spectrum using the IRAF task specfit (Kriss (1994)). We use a reddened power law in to describe the continuum emission. For extinction, we use a Cardelli et al. (1989) curve with and E(BV)=0.069 (Schlegel et al. (1998)). To model the continuum, we use regions of the spectrum free of both emission and absorption lines covering the full observed wavelength range. The best-fit, extinction-corrected continuum has the form .
To model the O vi emission and absorption, we fix the continuum parameters as determined above and restrict our subsequent fits to the 1033.0–1060.3 Å wavelength range. As one can see from the models shown in Fig. 2, the O vi emission line profile requires both broad and narrow components. We model these with Gaussian line profiles. The narrow component is only cleanly visible near the peak of the red component of the O vi doublet; strong foreground Galactic absorption obscures the corresponding feature near the blue peak. Although we can only clearly see part of the red portion of the narrow doublet, our baseline model assumes that they are optically thin with a 2:1 intensity ratio. (Tests using other assumptions are described in our discussion of the absorption line fits below.) The broad component is also treated as a doublet with two blended Gaussians having a 2:1 intensity ratio. For each narrow and broad doublet, we require the widths to be identical and the wavelengths to have the same ratio as their laboratory values. The C iii , N iii , S iv , and He ii emission lines are all modeled as single Gaussian emission lines. The two components of the S iv doublet have identical widths, a fixed flux ratio of 1:1, and wavelengths fixed at the ratio of their laboratory value. In addition, we include a single Gaussian emission line at the location of the unidentified emission feature at 1031 Å. Table 1 gives the best-fit parameters for these emission lines.
| Line | Fluxa | Velocityb | FWHM | |
|---|---|---|---|---|
| (Å) | ||||
| C III | 977.02 | |||
| N III | 991.58 | |||
| Unknown | 1014.86 | |||
| O VI broad | 1031.93 | |||
| O VI broad | 1037.62 | |||
| O VI narrow | 1031.93 | |||
| O VI narrow | 1037.62 | |||
| S IV | 1062.66 | |||
| S IV | 1072.97 | |||
| HeII | 1085.15 |
-
a
Observed flux in units of .
-
b
Velocity is relative to a systemic redshift of de Vaucouleurs et al. (1991).
We model absorption lines in the NGC 7469 spectrum using Voigt profiles. For the intrinsic absorbers, we permit the absorption to partially cover the source. That is, for a covering fraction , the transmittance at a given wavelength, , has the form , where is the optical depth at that wavelength. The intrinsic absorption lines are clustered into two complexes that we designate as #1 (at a relative systemic velocity of ) and #2 (at velocity ). Each of these complexes is modeled with four separate blended absorption lines. The O vi lines in each component are treated as doublets with their wavelengths fixed at the ratio of their laboratory values, their optical depths fixed at a 2:1 ratio, and their velocity widths forced to be the same. For the corresponding Ly lines, we fix their wavelengths at the ratio of their laboratory values to those of the O vi lines and force them to have the same velocity widths. Covering fractions vary freely within each complex. The individual O vi lines within a complex are forced to have the same velocity widths and the same covering fractions. (This assumption is relaxed below in an alternative model for the absorption.) Since Ly absorption is not even unambiguously detectable, we fix the relative optical depths of the lines within each complex to be the same as the ratios observed for O vi. However, we permit the overall optical depth for each Ly complex to vary freely. Table 2 gives the best-fit parameters for this model of the absorption lines. Parameters in the table with error bars of zero had their values linked to another parameter in the fit.
| Feature | Comp | FWHM | |||||
|---|---|---|---|---|---|---|---|
| # | (Å) | (Å) | () | () | |||
| Ly | 2a | 1025.72 | 0.05 | ||||
| Ly | 2a | 1025.72 | |||||
| Ly | 2a | 1025.72 | |||||
| Ly | 2a | 1025.72 | |||||
| Ly | 1a | 1025.72 | 0.03 | ||||
| Ly | 1b | 1025.72 | |||||
| Ly | 1c | 1025.72 | |||||
| Ly | 1d | 1025.72 | |||||
| OVI | 2a | 1031.93 | |||||
| OVI | 2b | 1031.93 | |||||
| OVI | 2c | 1031.93 | |||||
| OVI | 2d | 1031.93 | |||||
| OVI | 1a | 1031.93 | |||||
| OVI | 1b | 1031.93 | |||||
| OVI | 1c | 1031.93 | |||||
| OVI | 1d | 1031.93 |
-
a
Equivalent widths are integrated over all components of each spectral feature. Upper limits are .
-
b
Velocity is relative to a systemic redshift of de Vaucouleurs et al. (1991).
Since much of the peak of the O vi emission-line profile is obscured by foreground Galactic absorption, we have explored the effects that this uncertainty in the true emission-line profile might have on our characterization of the absorption lines. We consider a wide range of models:
A. This is our baseline model, described in detail above. The narrow emission lines have line ratios fixed at an optically thin value of 2:1, and we assume that this narrow line emission is obscured at the same covering fraction as the continuum and broad emission line. Individual O vi lines within a complex have the same velocity widths and covering fractions.
B. In this model the narrow emission lines are treated the same as in “A”, but the velocity widths and the covering fractions of individual O vi lines within a complex are all permitted to vary freely. In these fits, the strongest, deepest absorption line in each complex has parameters typical of those found in our baseline model. The weaker adjacent lines retain similar widths in these fits, but their best-fit covering fractions do change. However, the individual covering fractions are not well constrained. Their error bars are typically %, and the new values lie within one error bar of the best-fit value in the baseline model.
C. This variation has the narrow emission line fluxes fixed at an optically thick ratio of 1:1. The emission is obscured with the same covering fraction as the continuum and broad emission line. As in the baseline model, individual O vi lines within a complex have the same velocity widths and covering fractions. In a pattern that repeats with each of the subsequent variations below, the best-fit O vi column densities in this model are slightly lower, but not more than twice the values of the error bars shown in Table 2. While this model significantly changes the overall emission-line profile, since the O vi absorption is so highly blueshifted, little of the intrinsic absorption falls in the region of the line profile with the most dramatic changes. Thus the overall optical depth of the absorption lines is roughly the same as in the baseline model.
D. We also considered a model with no narrow emission-line component. As in the baseline model, individual O vi lines within a complex have the same velocity widths and covering fractions. This model provides a significantly worse fit than the baseline, but the measured O vi column densities and covering fractions are the same as the baseline model to within the error bars in Table 2.
E. This model has narrow-line emission with line ratios fixed at 2:1, but here we assume that the intrinsic absorption does not obscure the narrow-line emission at all. As in the baseline model, individual O vi lines within a complex have the same velocity widths and covering fractions. Again the O vi column densities are lower, but they are not significantly different from those of the baseline model.
F. In this model we also assume that the intrinsic absorption does not absorb the narrow-line emission, but we fix that emission at a ratio of 1:1. As in the baseline model, individual O vi lines within a complex have the same velocity widths and covering fractions. Again we find no significant variation from the results of our baseline model.
The overall properties of these various emission-line profile models are summarized in Table 3. For the O vi components 1 and 2 we list the total column density from the fit, the velocity of the strongest feature in each component, the best-fit widths of the absorption lines, and the best-fit covering fractions. The comparative summary for component #1 is listed first in the table, followed by the summary for component #2.
| Model/Component | FWHM | ||||
|---|---|---|---|---|---|
| () | () | ||||
| A/1 | 604.0/344 | ||||
| B/1 | 596.9/332 | ||||
| C/1 | 613.1/344 | ||||
| D/1 | 747.5/344 | ||||
| E/1 | 622.1/344 | ||||
| F/1 | 616.1/344 | ||||
| A/2 | 604.0/344 | ||||
| B/2 | 596.9/332 | ||||
| C/2 | 613.1/344 | ||||
| D/2 | 747.5/344 | ||||
| E/2 | 622.1/344 | ||||
| F/2 | 616.1/344 |
-
a
Velocity is relative to a systemic redshift of de Vaucouleurs et al. (1991).
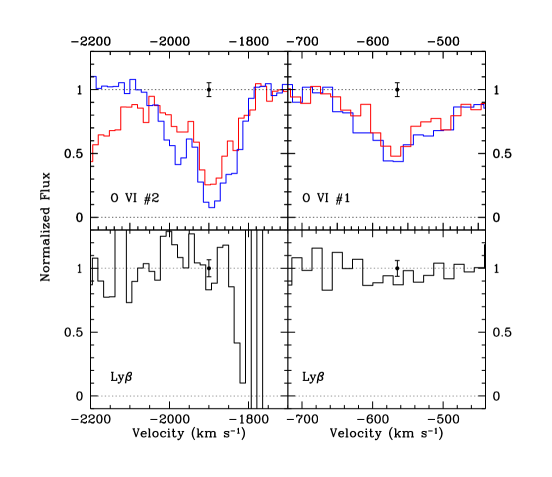
Fig. 2 graphically illustrates our best fit to the O vi and Ly region of the FUSE spectrum. Using our model for the underlying emission and the foreground Galactic absorption, we divide this into the data to produce a normalized spectrum that is corrected for the effects of foreground Galactic absorption. This normalized spectrum is shown in velocity space surrounding the two absorption line complexes in O vi and Ly in Fig. 3. Since the relative oscillator strengths of the blue and red lines in the O vi doublet have roughly a 2:1 ratio, one would expect the red line to have a depth that is half that of the blue line in optically thin gas, and an equal depth in optically thick gas. From the normalized spectrum it is readily apparent that the equal depths of the red and blue lines in Component #1 imply that the absorption is heavily saturated. However, since the line cores are not black at their centers, we also can see that the absorbing gas does not fully cover the underlying emission. The covering fraction is only %. Our fits may underestimate the total column density in this absorption complex. The lack of visible damping wings on the line profile permits us to set an upper limit of on the O vi column of this component. This upper limit is reflected in the error bar that we assign to the strongest line in Component #1 in Table 2. The relative depths of the red and blue lines in Component #2 are not quite equal, but they also are not at an optically thin ratio. This component is approaching saturation, but is not yet optically thick, and so its total column density is better determined.
4 Discussion
As typical for Seyfert 1 galaxies viewed at high spectral resolution in the far-ultraviolet, we see complex, multiple absorption lines from highly ionized O vi. Although Ly absorption in the FUSE spectrum is weak or absent, there are Ly absorption lines in the FOS spectrum of NGC 7469 obtained in 1996 at systemic velocities of and (Kriss et al. 2000a ), very close to the velocities of Components #1 and #2, so there is some minimal neutral hydrogen column. The high O vi to H i column-density ratios for both components imply very highly ionized gas consistent with those typical of X-ray warm absorbers and similar to the highest ionization component in Mrk 509 (Kriss et al. 2000b ). However, only Component #1 has velocities comparable to those of higher ionization states of O vii and O viii () as seen in the XMM-Newton grating spectrum of NGC 7469 (Blustin et al. (2003)). The upper limit on the O vi column density measured in the XMM-Newton grating spectrum of is consistent with the column densities measured in the FUSE spectrum.
| 6.0a | 20.55 | ||||||
| Observed: | … | … | |||||
| 0.2b | 18.58 | ||||||
| Observed: | … | … | |||||
| 0.08c | 18.58 |
-
a
This model is our best match to Component #1.
-
b
This model is our best match to Component #2.
-
c
This model corresponds to Component #2 at the epoch of the 1996 FOS observations.
-
d
For a Doppler width of 100 km s-1, the blue line in the doublet would have an equivalent width of 0.20 Å.
-
e
For a Doppler width of 100 km s-1, the blue line in the doublet would have an equivalent width of 0.16 Å.
To test whether the same gas is responsible for both the UV and the X-ray absorption in component #1, we computed photoionization models similar to those used by Krolik & Kriss (1995, 2001). These models cover a grid in total column density ranging from to , and in ionization parameter from to 10.0, where is the ratio of ionizing photons in the Lyman continuum to the local electron density. For the illuminating spectrum in our models, we used two different spectral energy distributions. The first, SED1, is the same as that described by Kriss et al. (2000a), which is based on the simultaneous IUE, FOS, and RXTE observations of NGC 7469 performed in 1996. We show SED1 as a solid line in Fig. 4. The second spectral energy distribution, SED2, is based on the current FUSE spectrum presented in this paper and the XMM-Newton spectrum from Blustin et al. (2003). At long wavelengths we assume , as in SED1. At 2500 Å, this breaks to to match the FUSE spectrum. At X-ray energies, we use the energy index of 0.7 from the XMM-Newton spectrum to span the 0.5 keV to 100 keV. At higher energies we use a steeper index of 2.0 to prevent divergence in the total ionizing flux. From 50 eV to 0.5 keV, the steep is a reasonable match to the soft excess seen in the XMM-Newton data. The FUSE and XMM-Newton data were not obtained simultaneously, and so we normalize the X-ray continuum relative to the UV continuum by choosing , the same value used by Kriss et al. (2000a) based on the 1996 simultaneous observations. SED2 is the dashed line shown in Fig. 4. For comparison, we show the absorption-corrected UV and X-ray fluxes at 2120 Å and 2 keV, respectively, as observed with XMM-Newton (Blustin et al. (2003)). These data have , and they are consistent with SED2.

After examining the results of our modeling, we find that none of the models using SED1 achieves sufficiently high ratios of O vi, O vii, and O viii relative to H i to match the values observed in our spectra. For SED2, we do find a solution that is compatible with our observations. This model has U = 6.0 and log = 20.55. The predicted column densities for ions of interest are summarized in Table 4, where we compare them to the observed column densities. Note that C iv and N v are virtually invisible in this model, and, indeed, no absorption from these ions was seen by Kriss et al. (2000a) in the 1996 FOS spectrum at the velocity of component #1.
For Component #2, the required column density and ionization level is substantially lower. We obtain a reasonable match to the observed O vi and H i column densities for and = 18.58, as also shown in Table 4. The predicted column densities for C iv and N v in this model are also rather low, although easily detectable. We note that the UV continuum in the current FUSE observation is a factor of brighter than that observed with the FOS in 1996. If we assume that any variations since then are simply due to changes in flux with a constant column density of absorbing gas, then we would have expected the gas in 1996 to be responding to an ionization parameter of . This would then predict C iv and N v column densities of and , respectively, with corresponding equivalent widths of the blue components of each doublet (for optically thin gas) of 0.2 Å and 0.16 Å. While these are still lower than the observed values in the FOS spectrum, ( and Å for C iv and N v, respectively) given the uncertainties in the spectral energy distribution and other potentially variable factors, we find the agreement quite good.
The covering fraction and line depth of Component #1 is consistent with its absorbing only the continuum flux and none of the emission-line flux in NGC 7469. Its high ionization parameter, and its likely identification with the same gas responsible for the X-ray absorption suggests that it is much higher ionization than Component #2. Taken together, these points imply that Component #1 lies very close to the central engine, possible interior to the broad emission line region. This would favor its association with an accretion disk wind, rather than a thermally driven wind emanating from the obscuring torus. In constrast, the high covering fraction of Component #2 clearly places it exterior to both the BLR and continuum regions as would be expected for the thermally driven winds of Krolik & Kriss (1995; 2001). Overall, in this one object we may be seeing absorption from both a torus wind and a disk wind.
5 SUMMARY
Our high-resolution far-ultraviolet spectrum of NGC 7469 obtained with FUSE shows broad emission lines of C iii, N iii, O vi, and He ii, as well as possible emission from S iv . Intrinsic absorption in the O vi resonance doublet arises in two distinct kinematic components at systemic velocities of km s-1 (Component #1) and km s-1 (Component #2). Both components are very highly ionized with no significant Ly absorption detected at either velocity. Component #2, although highly ionized, has a lower total column density than Component #1, and it is consistent with having no associated X-ray absorption. It covers more than 90% of both the continuum and broad-line emission. Component #1 at km s-1 is the best match in velocity to the highly ionized X-ray absorbing gas detected in the XMM-Newton grating spectrum of NGC 7469 (Blustin et al. (2003)) at a blueshift of . Photoionization models for Component #1 show that for a total column density of and an ionization parameter of , the column densities of H i, O vi, O vii, and O viii in the FUSE and the XMM-Newton spectra can all be reproduced. Component #1 also has an extraordinarily low covering fraction of 0.5, and is consistent with covering only the continuum emission and none of the broad-line emission. This suggests that it might arise in an accretion disk wind interior to the broad line region.
Acknowledgements.
This work is based on data obtained for the Guaranteed Time Team by the NASA-CNES-CSA FUSE mission operated by the Johns Hopkins University. Financial support to U. S. participants has been provided by NASA contract NAS5-32985. The U. K. authors acknowledge the support of the Particle Physics and Astronomy Research Council. G. Kriss acknowledges additional support from NASA Long Term Space Astrophysics grant NAGW-4443.References
- Blustin et al. (2003) Blustin, A., Branduardi-Raymont, G., Behar, E., et al. 2003, A&A, submitted
- Cardelli et al. (1989) Cardelli, J., Clayton, G., & Mathis, J. 1989, ApJ 345, 245
- Collier et al. (1998) Collier, S., Horne, K., Kaspi, S., et al. 1998, ApJ 500, 162
- Crenshaw et al. (1999) Crenshaw. D. M., Kraemer, S. B., Boggess, A., et al. 1999, ApJ 516, 750
- Crenshaw et al. (1998) Crenshaw, D. M., Maran, S. P., & Mushotzky, R. F. 1998, ApJ 496, 797
- de Vaucouleurs et al. (1991) de Vaucouleurs, G., de Vaucouleurs, A., Corwin, H. G., et al. 1991, Third Reference Catalogue of Bright Galaxies (Springer, New York)
- Espey et al. (1998) Espey, B.R., Kriss, G.A., Krolik, J. H., et al. 1998, ApJ 500, L13
- George et al. (1998) George, I. M., Turner, T. J., Netzer, H., et al. 1998, ApJS 114, 73
- Hamann et al. (1995) Hamann, F., Barlow, T. A., Beaver, E. A., Burbidge, E. M., & Cohen, R. D. 1995, ApJ 443, 606
- Hamann et al. (1997) Hamann, F., Barlow, T. A., & Junkkarinin, V. 1997, ApJ 478, 87
- Kaastra et al. (2001) Kaastra, J. S., Mewe, R., Liedahl, D. A., Komossa, S., & Brinkman, A. C. 2000, A&A 354, L83
- Kaspi et al. (2000) Kaspi, S., Brandt, W. N., Netzer, H., et al. 2000, ApJ 535, L17
- Kaspi et al. (2002) Kaspi, S., Brandt, W. N., George, I. M., et al. 2002, ApJ 574, 643
- Königl & Kartje (1994) Königl, A., & Kartje, J. F. 1994, ApJ 434, 446
- Kriss (1994) Kriss, G. A. 1994, in Astronomical Data Analysis Software and Systems III, ASP Conf. Ser. 61, ed. D. R. Crabtree, R. J. Hanisch, & J. Barnes, (San Francisco: ASP), 437
- (16) Kriss, G. A., Peterson, B. M., Crenshaw, D. M., & Zheng, W. 2000a, ApJ 535, 58
- (17) Kriss, G. A., Green, R. F., Brotherton, M., et al. 2000b, ApJ 538, L17
- Kriss et al. (2003) Kriss, G. A., Green, R. F., Brotherton, M., et al. 2003, ApJS, to be submitted
- Krolik & Kriss (1995) Krolik, J. H., & Kriss, G. A. 1995, ApJ 447, 512
- Krolik & Kriss (2001) Krolik, J. H., & Kriss, G. A. 2001, ApJ 561, 684
- Laor et al. (1995) Laor, A., Bahcall, J. N., Jannuzi, B. T., Schneider, D. P., & Green, R. F. 1995, ApJS 99, 1
- Mathur et al. (1999) Mathur, S., Elvis, M., & Wilkes, B. 1999, ApJ 519, 605
- Moos et al. (2000) Moos, H. W., Cash, W. C., Cowie, L. L. et al. 2000, ApJ 538, L1
- Murray et al. (1995) Murray, N., Chiang, J., Grossman, S. A., & Voigt, G. M. 1995, ApJ 451, 498
- Nandra et al. (1998) Nandra, K., Clavel, J., Edelson, R. A., et al., 1998, ApJ 505, 594
- Netzer et al. (2002) Netzer, H., Chelouche, D., George, I. M., et al. 2002, ApJ 538, L1
- Reynolds (1997) Reynolds, C. S. 1997, MNRAS 286, 513
- Sahnow et al. (2000) Sahnow, D. J., Moos, H. W., Ake, T. B., et al. 2000, ApJ 538, L7
- Savage & Sembach (1996) Savage, B. D., & Sembach, K. S. 1996, ARAA 34, 279
- Schlegel et al. (1998) Schlegel, D. J., Finkbeiner, D. P., & Davis, M. 1998, ApJ 500, 525
- Wanders et al. (1997) Wanders, I., Peterson, B. M., Alloin, D., et al. 1997, ApJS 113, 69