Evolution and morphology of bars 11institutetext: Observatoire de Marseille, 2 Place Le Verrier, 13248 Marseille cedex 04, France
Angular momentum redistribution and the evolution and morphology of bars
Abstract
Angular momentum exchange is a driving process for the evolution of barred galaxies. Material at resonance in the bar region loses angular momentum which is taken by material at resonance in the outer disc and/or the halo. By losing angular momentum, the bar grows stronger and slows down. This evolution scenario is backed by both analytical calculations and by -body simulations. The morphology of the bar also depends on the amount of angular momentum exchanged.
1 Introduction
Bars are common features of disc galaxies. De Vaucouleurs (GdV ), using a classification based on images at optical wavelengths, found that roughly one third of all disc galaxies are barred (family SB), while yet another third have small bars or ovals (family SAB). Observations in the near infrared have shown that galaxies that had been classified as non-barred from images at optical wavelengths may have a clear bar component when observed in the near infrared. Thus Eskridge et al. (Eskr-2000 ) classified more than 70% of all disc galaxies as barred, while Grosbøl, Pompei & Patsis (GPP ) found that only of all disc galaxies are definitely non barred.
Bars come in a large variety of strengths, lengths, masses, axial ratios and shapes. Great efforts have been made in order to obtain some systematics on bar structure and important advances have been made. Elmegreen & Elmegreen (E+E ) have shown that earlier type bars are relatively longer (i.e. relative to the disc diameter) on average than bars in later type galaxies. They also find that early type bars have flat intensity profiles along the bar major axis, while late type bars have exponential-like profiles. A correlation has been found (EA.LM , Martin ) between the length of bars and the size of bulges. This is in good agreement with the trend found in E+E , since earlier type galaxies have larger bulges than late types. Important differences between early and late type bars are also found with the Fourier decomposition of the surface density. Indeed the relative = 2 and 4 components are much stronger in early than in late type bars. Moreover, the higher order components ( = 6 and 8), which for the late type bars are negligible, are still important for early types. Finally, the shape of the bar isodensities differ and Athanassoula et al. (AMW+ ), using a sample of strongly barred early type galaxies, showed that their bar isophotes are rectangular-like, particularly in the region near the end of the bar.
The first trials of -body simulations (e.g. MPQ ) show that bars grow spontaneously and are long-lived. Yet it is only recently that simulations have achieved sufficient quality to provide information on the morphology of -body bars and on the mechanisms that govern bar formation and bar evolution. I will here discuss some of the latest results of -body simulations. I will argue that it is the exchange of angular momentum within the galaxy that will determine the bar strength and the rate at which the pattern speed decreases after the bar has formed, as well as the bar morphology.
2 Angular momentum exchange and bar evolution
Exchange of energy and angular momentum between stars at resonance with a spiral density wave has been first discussed by Lynden-Bell & Kalnajs (LBK ). Using linear perturbation theory, these authors showed that, for a steady forcing, stars emit, or absorb, angular momentum only if they are at resonance. Stars at the inner Lindblad resonance (hereafter ILR) lose angular momentum, while stars at the outer Lindblad resonance (hereafter OLR) gain it. This ground-braking work has to be extended in order to be applied to bars in general and -body bars in particular. HI observations, basically starting with Bosma , have now established that, if Newton’s law of gravity is valid, then disc galaxies are embedded in a dark matter component, called the halo, whose mass exceeds that of the disc. This component should now be taken into account as an extra partner in the angular momentum exchange process. Furthermore, bars are strongly non-linear features, since they contain a large fraction of the mass in the inner parts of the disc and a considerable part of the total disc mass. Thus any linear theory should be thought of as a guiding line, to be supplemented by and tested against adequate -body simulations. It is obvious that such simulations should be fully self-consistent, since rigid components can not exchange energy and angular momentum.
In EA.Jmom I extended the analytical work of LBK to include spheroidal components, like a halo and/or a bulge, and also supplemented it with fully self-consistent -body simulations. In the analytical part I showed that, if the distribution function of the spheroidal component is a function only of the energy, then at all resonances the halo and bulge particles can only gain angular momentum. Also, since the bar is a strongly nonlinear feature, higher multiplicity resonances should be taken into account. Thus angular momentum is emitted by particles (stars) at the resonances in the inner disc, mainly the ILR, but also the inner -1:m resonances nearer to corotation (hereafter CR). It is absorbed by disc particles (stars) at the OLR, or the outer 1:m resonances, outside corotation, or by the resonant particles in the halo and/or bulge components. Since the bar is a negative angular momentum perturbation (LBK ), by losing angular momentum it will grow. This clearly outlines a scenario for the evolution of barred galaxies.
3 The effect of the halo on bar evolution
As the bar loses angular momentum, it grows stronger. This, however, can only happen if there are absorbers that can absorb the angular momentum that the bar region emits. Thus the existence of a massive halo component, whose resonances can absorb considerable amounts of angular momentum, will help the bar grow. At first sight this may be thought to go against old claims that haloes stabilise bars. In fact, a more precise wording is necessary. Indeed, the halo slows down the bar growth in the initial stages of the evolution. At later stages, however, the situation can be reversed, since the halo may absorb the angular momentum emitted by the bar, and thus it may allow the latter to grow further. Thus bars that grow in halo-dominated discs can be stronger than bars that grow in disc-dominated surroundings. This effect was not seen till recently, since the older studies were either 2D (e.g. Toomre , EA.JAS ), or 3D but with few particles (e.g. Ostr.Peeb ), or had rigid haloes. In all these cases the halo was denied from the onset its destabilising influence. Its effect becomes clear in fully self-consistent -body simulations, with an adequate particle number and resolution. Thus EA.AM showed that stronger bars can grow in cases with more important halo components.
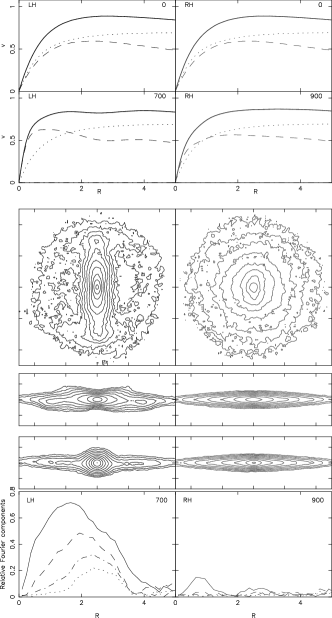
The influence of the halo is also illustrated in Fig. 1, where I compare the results of two -body simulations. Initially their disc is exponential, with unit mass and scale-length ( = 1, = 1) and its parameter (ToomQ ) is independent of radius and equal to 1.2. Since = 1, taking the mass of the disc equal to 5 M⊙, and its scale-length equal to 3.5 kpc implies that the unit of velocity is 248 km/sec and the unit of time is 1.4 yrs. This calibration is reasonable, but is not unique, so in the following I will give all quantities in computer units. The reader can then convert the values to astronomical units according to his/her needs. The halo component is spherical, non-rotating and has an isotropic velocity distribution. It follows a pseudo-isothermal radial density profile (hernq ) and has a total mass = 5, a core radius = 0.5 and a cutoff radius of = 10. Its density is truncated at 15 disc scale-lengths, i.e. at a radius containing more than 96% of its mass. In building the initial conditions I loosely followed hernq and EA.AM , and the simulations were run on the Marseille GRAPE-5 systems (for a description of the GRAPE-5 boards see Kawai ). The only difference between the initial conditions of the two simulations is that for simulation LH, illustrated in the left panels, the halo is live and represented by roughly particles, while for simulation RH, illustrated in the right panels, it is rigid, i.e. represented by an analytical potential and thus can neither emit nor absorb angular momentum. Although their initial conditions are so similar, the two simulations evolve in a very different way. After some initial multi-spiral episodes, LH forms a bar which grows stronger with time. Its morphology at = 700 is shown in the left panels. The bar is long and strong and has ansae-type features near the end of its major axis. It is surrounded by a ring, which can be compared to the inner rings often observed in barred galaxies. The bar formation entails considerable redistribution of the disc matter, both radially and azimuthally. On the other hand the disc in simulation RH stays close to axisymmetric, except for some multi-armed spirals which die out with time. Only at the latest stages of the evolution does it form an oval distortion, and even that is weak and short and is confined to the innermost parts of the disc, as can be seen for = 900 in the right panels of Fig. 1. I show this simulation at a later time than that for simulation LH because at earlier times there is very little structure visible.
Seen edge-on with the bar seen side-on (i.e. with the line of sight along the bar minor axis), simulation LH exhibits a very strong peanut, which is totally absent from simulation RH (fourth row of panels). Seen edge-on with the bar seen end-on (i.e. with the line of sight along the bar major axis), the peanut in LH resembles a bulge (left panel on fifth row). This underlines the hazards involved in classifying edge-on galaxies, since the classifier may in such cases easily misinterpret the bar for a bulge.
A useful way of quantifying the bar strength is with the help of the Fourier components of the mass, or density. These can be defined as
| (1) |
where
| (2) |
and
| (3) |
For runs LH and RH, these components for = 2, 4, 6 and 8 are shown in the lower panels of Fig. 1. For run LH all four components are important, due to the strength of the bar. Their amplitude decreases with increasing , while the location of the maximum shifts outwards. On the other hand, for model RH only the = 2 component stands out from the noise, but its amplitude is rather small, smaller than e.g. that of the = 8 for model LH.
Since the only difference between the initial conditions of models LH and RH is that the halo of the one is responsive, while that of the other is rigid, we can conclude that the halo response is crucial for determining the evolution of barred galaxies.
4 Bar slow-down

I ran a large number of simulations similar to those described in the previous sections. I noted that, as it loses angular momentum, the bar grows longer, and more massive, thus stronger. Angular momentum loss, however, is not only linked to an increase in the bar strength. It is also linked to a slow-down, i.e. to a decrease of the bar pattern speed with time. Such a slow-down has indeed been seen in a number of simulations and has also been predicted analytically (TW , W , LC1 , LC2 , HW , EA.Buta , DS1 , DS2 ). It can also be seen in Fig. 2, which shows the run of the bar pattern speed with time for simulation LH, whose morphology at time = 700 is shown in the left panels of Fig. 1. Note that the bar slows down considerably with time.
5 Resonances

In order for haloes to be able to absorb angular momentum, they need to have a considerable fraction of their mass at resonance. This was shown to be true in (EA.ApJL ). I will illustrate it here for model LH. The procedure is the same as that followed in EA.ApJL . I calculate the potential from the mass distribution in the disc and halo component at time = 800, by freezing all motion except for the bar, to which I assign bulk rotation with a pattern speed equal to that found in the simulation at that time. I then pick at random 100 000 disc and 100 000 halo particles and, using their positions and velocities as initial conditions, I calculate their orbits for 40 bar rotations. Using spectral analysis (BS , Laskar ), I then find the principal frequencies of these orbits, i.e. the angular velocity , the epicyclic frequency and the vertical frequency . An orbit is resonant if there are three integers , and , such that
| (4) |
Orbits on planar resonances fulfill
| (5) |
The ILR corresponds to = –1 and = 2, CR to = 0, and OLR to = 1 and = 2.
The upper panels of Fig. 3 show, for time = 800, the mass per unit frequency ratio of particles having a given value of the frequency ratio as a function of this frequency ratio111See EA.Jmom for more information on and on how it is derived.. The distribution is not uniform, but has clear peaks at the location of the main resonances, as was already shown in EA.ApJL and EA.Jmom . The highest peak for the disc component is at the ILR, followed by and CR. In all simulations with strong bars the ILR peak is strong. The existence of peaks at other resonances as well as their importance varies from one run to another and also during the evolution of a given run. For example the CR peak is, in many other simulations, much stronger than in the example shown here. For the spheroidal component the highest peak is at CR, followed by peaks at the ILR, OLR and .
The lower panels show the angular momentum exchanged. For this I calculated the angular momentum of each particle at time 800 and at time 500, as described in EA.Jmom , and plotted the difference as a function of the frequency ratio of the particle at time 800. It is clear from the figure that disc particles at ILR and at the resonance lose angular momentum, while those at CR gain it. There is a also a general, albeit small, loss of angular momentum from particles with frequencies between CR and ILR. This could be partly due to particles trapped around secondary resonances, and partly due to angular momentum taken from particles which are neither resonant, nor near-resonant, but can still lose a small amount of angular momentum because the bar is growing. The corresponding panel for the spheroid is, as expected, more noisy, but shows that particles at all resonances gain angular momentum. Thus this plot, and similar ones which I did for other simulations, confirm the analytical results of EA.Jmom , and show that the linear results concerning the angular momentum gain or loss by resonant particles, qualitatively at least, carry over to the strongly nonlinear regime.
6 What determines the strength of bars and their slow-down rate?
I have shown in the previous sections that the halo can take angular momentum from the bar, thus making it stronger and slower. However, for this effect to be important, the amount of angular momentum exchanged must be considerable. For the latter to happen the halo must
-
•
be sufficiently massive in the regions containing the principal resonances.
-
•
not be too hot, i.e. not have too high velocity dispersion. Indeed, hot haloes can not absorb much angular momentum, even if they are massive (e.g. EA.Jmom ).
Thus the length and the slow-down rate of bars are naturally limited by the mass and velocity distribution of the halo. Examples of this can be found in EA.Jmom .
7 Trends and correlations

In EA.Jmom I found trends and correlations between the angular momentum absorbed by the spheroid (i.e. the halo plus, whenever existent, the bulge), the bar strength and the bar pattern speed. They are based on a set of simulations analogous to those described in the previous sections. Such plots are given also in Fig. 4, based on a somewhat larger sample of simulations. About three quarters of them were run with the Marseille GRAPE-5 systems, and roughly one quarter was run on PCs using Dehnen’s treecode (D1 , D2 ). Each point represents one simulation and the trends are the same as those found in EA.Jmom . The upper panels show the results for the whole sample, the middle panels contain only simulations where the halo has a small core radius (), = 5 and does not extended beyond 15 disc scale-lengths, and the lower ones contain only simulations where the halo has a large core radius (), = 5 and again does not extended beyond 15 disc scale-lengths.
The right panel shows that there is a correlation between the angular momentum of the spheroid and the bar strength. This correlation holds also when I restrict myself to simulations with large (or small) core radii as seen in the second and third row. A trend also exists between the spheroid angular momentum and the bar pattern speed. In this case, however, simulations with large core radii behave differently from those with small radii. Indeed, for simulations with a small core radius (i.e. centrally concentrated halos) I find a very strong correlation between the spheroid angular momentum and the pattern speed, particularly if I restrict myself to one value of . In such simulations the angular momentum is exchanged primarily between the bar region and the spheroid, thus accounting for the very tight correlation. Simulations with large cores behave differently (lower middle panel). They show only a rough trend, except for simulations with a hot disc, which show a tight correlation. This is easily explained in the scenario of evolution via angular momentum exchange. The outer parts of hot discs absorb only little angular momentum, so that the exchange is basically between the bar region and the spheroid, thus accounting for the tight correlation. On the other hand, if the outer disc is cold, then it can participate more actively in the exchange. Since the angular momentum absorbed by the spheroid (plotted in Fig. 4) is not the total angular momentum exchanged, but only a fraction of it, I find only a trend.
8 Comparing the morphology of -body and of real bars
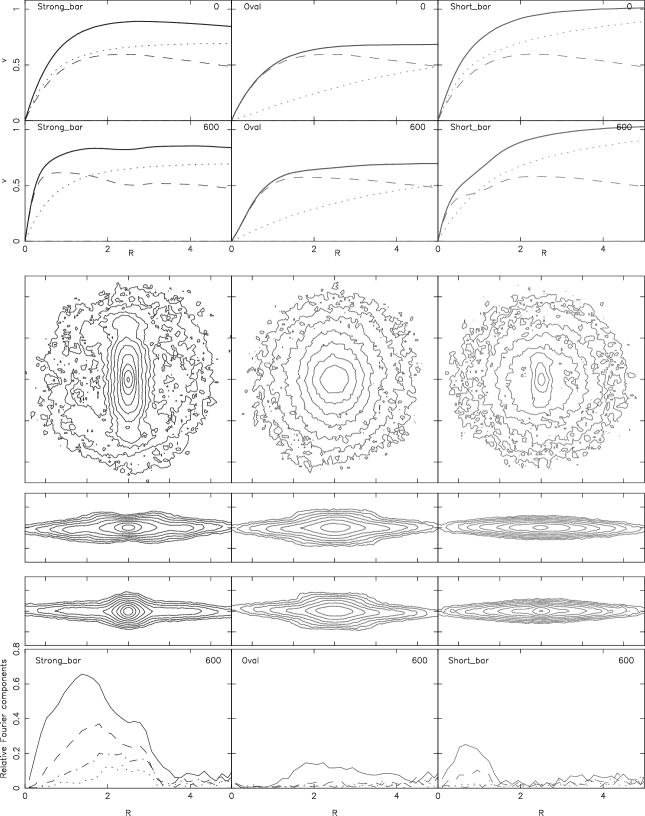

The correlations discussed in section 7 show clearly that models that have exchanged more angular momentum have stronger bars than models that have exchanged little. By examining the results of the individual simulations, I could see that, in cases where large amounts of angular momentum have been exchanged, the bars are long, relatively thin and have rectangular-like isodensities, particularly in their outer parts. A typical example of such a case is given in the left panels of Fig. 5 (see also EA.AM ). Note also the existence of ansae at the ends of the bar, a feature sometimes observed in early type barred galaxies. On the other hand, models that have exchanged little angular momentum have less homogeneous properties. For example they can have either ovals, or short bars. Typical examples of such cases are given in the middle and right panels of Fig. 5, respectively. The model in the left panel has exchanged about 15 percent of the disc angular momentum by the time shown in Fig. 5, while the other two models only of the order of a percent.
The edge-on morphology also is strongly influenced by the amount of angular momentum exchanged. The strong bar, when seen edge-on, displays a clear peanut morphology, as often observed. On the other hand the oval has a boxy edge-on appearance, while the small bar has not changed significantly the edge-on morphology of the galaxy.
The difference in bar strength is also illustrated in the lower panels of Fig. 5, which show the relative Fourier components of the density for = 2, 4, 6 and 8 for the three simulations. The simulation that exchanged a lot of angular momentum has a very strong = 2 component, with a secondary maximum roughly at the position of the ansae. The remaining components, even the = 6 and 8 ones, are also important. The location of their maximum moves outwards with increasing . The oval has much lower Fourier components, and only the = 2 stands out from the noise. For small radii all components are nearly zero, which means that the oval must be nearly axisymmetric in its innermost parts. On the other hand, the = 2 amplitude drops slowly with radius in the outer parts, thus extending to large radii. The small bar has Fourier components which drop rapidly with radius, i.e. they are noticeable only in the central region, as expected since the bar is confined there. Only the = 2 and 4 components stand out from the noise.
The radial rearrangement of the disc material due to the bar can be inferred by comparing the initial with the current circular velocity curves, given in the first and second rows of panels. The strong bar has entailed a substantial radial rearrangement, the final disc mass distribution being considerably more centrally concentrated than the initial one. On the other hand, in the other two simulations, and particularly in the one producing the oval, there is very little radial rearrangement of the disc material. Since there is also hardly any radial rearangement of the halo material (EA.AM , EA.Puebla , OV.AK ), this means that the disc-to-halo mass ratio changes most in the simulations where more angular momentum has been exchanged.
Quantitative comparison of the bar form of the three models is given in Fig. 6. The values of the bar semi-major and semi-minor axes ( and , respectively) and of the shape parameter () were obtained by fitting generalised ellipses of the form
| (6) |
to the bar isodensities. The shape parameter is 2 for ellipses, larger than 2 for rectangular-like generalised ellipses, and smaller than 2 for diamond-like ones. From this figure one can note that both the strong and the short bar are thin, and in general see how their axial ratios vary with the semi-major axis. The shape parameter is given in the lower panels. We see that both the strong and the short bar have rectangular-like isodensities in the outer regions of the bar, while the oval has a shape very close to elliptical. In fact the strong bar has axial ratios and shapes very similar to those found in AMW+ by applying the same type of analysis to a sample of early type barred galaxies.
Plotting the run of the density along the bar major axis (EA.AM ) I find for the strong bar a profile which is rather flat within the bar region, similar to what was found in E+E for early type bars.
It is thus clear that the amount of angular momentum exchanged influences the morphology of the bar. In my first example, where a lot of angular momentum was transferred from the bar to the outer halo (mainly), the result is a long, strong bar, with some rectangular-like isophotes and ansae at its ends. The examples where little angular momentum was exchanged have a very different morphology, one forming an oval and the other a short bar. What determines which one of the two it will be? In the examples shown here, and in a rather large sample of similar cases, the oval was formed in an initially hot disc, while the short bar grew in a hot halo. The existing theoretical framework, however, gives no predictions on this point and work is in progress to elucidate this further.
9 Summary
In this paper I reviewed evidence that shows that angular momentum is exchanged between the bar region in the one hand, and the outer disc and the spheroid on the other. This exchange determines the slow-down rate of the bar, as well as its strength and its overall morphology.
Acknowledgments. I thank the organisers for inviting me to this interesting conference. I thank M. Tagger, A. Bosma, W. Dehnen, A. Misiriotis, C. Heller, I. Shlosman, F. Masset, J. Sellwood, O. Valenzuela, A. Klypin and P. Teuben for many stimulating discussions. I thank J. C. Lambert for his help with the GRAPE software and with the administration of the simulations and W. Dehnen for making available to me his tree code and related programs. I also thank the INSU/CNRS, the University of Aix-Marseille I, the Region PACA and the IGRAP for funds to develop the GRAPE and Beowulf computing facilities used for the simulations discussed in this paper and for their analysis.
References
- (1) E. Athanassoula: ‘Evolution of bars in isolated and in interacting disk galaxies’. In Barred Galaxies, eds. R. Buta, D. Crocker and B. Elmegreen (Astron. Soc. of the Pacific Conference series, 91), pp. 309–321 (1996)
- (2) E. Athanassoula: Astrophys. J. 569, L83 (2002)
- (3) E. Athanassoula: ‘Formation and Evolution of Bars in Disc Galaxies’. In Disks of Galaxies: Kinematics, Dynamics and Perturbations, eds. E. Athanassoula, A. Bosma, R. Mujica (Astron. Soc. of the Pacific Conference Series, 275) pp. 141–152 (2002)
- (4) E. Athanassoula: Mon. Not. R. Astron. Soc., in press (2003)
- (5) E. Athanassoula, L. Martinet: Astron. Astrophys. 87, L10 (1980)
- (6) E. Athanassoula, A. Misiriotis: Mon. Not. R. Astron. Soc. 330, 35 (2002)
- (7) E. Athanassoula, S. Morin, H. Wozniak, et al.: Mon. Not. R. Astron. Soc. 245, 130 (1990)
- (8) E. Athanassoula, J. A. Sellwood: Mon. Not. R. Astron. Soc. 221, 213 (1986)
- (9) J. Binney, D. Spergel: Astrophys. J. 252, 308 (1982)
- (10) A. Bosma: Astron. J., 86, 1825 (1981)
- (11) G. de Vaucouleurs: Astrophys. J. Suppl. 8, 31 (1963)
- (12) V. P. Debattista, J. A. Sellwood: Astrophys. J. 493, L5 (1988)
- (13) V. P. Debattista, J. A. Sellwood: Astrophys. J. 543, 704 (2000)
- (14) W. Dehnen: Astrophys. J. 536, L39 (2000)
- (15) W. Dehnen: J. Comp. Phys. 179, 27 (2002)
- (16) B. G. Elmegreen, D. M. Elmegreen: Astrophys. J. 288, 438 (1985)
- (17) P. B. Eskridge, J. A. Frogel, R. W. Pogge, et al.: Astron. J., 119, 536 (2000)
- (18) P. Grosbøl, E. Pompei, P. Patsis: ‘Spiral Structure Observed in Near-Infrared’. In Disks of Galaxies: Kinematics, Dynamics and Perturbations, eds. E. Athanassoula, A. Bosma, R. Mujica (Astron. Soc. of the Pacific Conference Series, 275) pp. 305–310 (2002)
- (19) L. Hernquist: Astrophys. J. Suppl. 86, 389 (1993)
- (20) L. Hernquist, M. D. Weinberg: Astrophys. J. 400, 80 (1992)
- (21) F. Hohl: Astrophys. J. 168, 343 (1971)
- (22) A. Kawai, T. Fukushige, J. Makino, M. Taiji: Pub. Astron. Soc. Japan 152, 659 (2000)
- (23) J. Laskar: Icarus, 88, 266 (1990)
- (24) B. Little, R. G. Carlberg: Mon. Not. R. Astron. Soc. 250, 161 (1991a)
- (25) B. Little, R. G. Carlberg: Mon. Not. R. Astron. Soc. 251, 227 (1991b)
- (26) D. Lynden-Bell, A. J. Kalnajs: Mon. Not. R. Astron. Soc. 250, 161 (1972)
- (27) P. Martin: Astron. J. 109, 2428 (1995)
- (28) R. H. Miller, K. H. Prendergast, W. J. Quirk: Astrophys. J. 161, 903 (1979)
- (29) K. Ohta: ‘Global Photometric Properties of Barred Galaxies’. In Barred Galaxies, eds. R. Buta, D. A. Crocker, B. G. Elmegreen (Astron. Soc. of the Pacific Conference Series, 91) pp. 37–43, (1996)
- (30) K. Ohta, M. Hamabe, K. Wakamatsu: Astrophys. J. 357, 71 (1990)
- (31) J. P. Ostriker, P. J. E. Peebles: Astrophys. J. 186, 467 (1973)
- (32) A. Toomre: Astrophys. J. 139, 1217 (1964)
- (33) A. Toomre: ‘What amplifies the spirals’ In: The Structure and Evolution of Normal Galaxies, ed. S. M. Fall, D. Lynden-Bell (Cambridge University Press) pp. 111–136 (1981)
- (34) S. Tremaine, M. D. Weinberg: Mon. Not. R. Astron. Soc. 209, 729 (1984)
- (35) O. Valenzuela, A. Klypin: in preparation (2003)
- (36) M. D. Weinberg: Mon. Not. R. Astron. Soc. 213, 451 (1985)