VLT observations of the highly ionized nebula around Brey2††thanks: Based on observations collected at the European Southern Observatory, Cerro Paranal, Chile (ESO No. 68.C-0238(A,B)).
We present the first high resolution He ii 4686 images of the high excitation nebula around the WR star Brey 2 in the LMC. This nebula presents a striking morphology: a small arc-like feature some 3.6 pc in radius is particularly prominent in the He ii 4686 line. We further discover a previously unknown faint He ii emission that extends over an area of 2217 pc2. An even fainter He ii emission is apparently associated with the interstellar bubble blown by the progenitor of Brey2. The total He ii flux corresponds to an ionizing flux of 41047 photons s-1. H, [O iii], and He i 5876 images and long-slit spectra are also examined in this letter, enabling us to investigate the detailed physical properties at various locations of the nebula.
Key Words.:
Stars: individual: Brey2 - ISM: bubbles - ISM: abundances - ISM: supernova remnants1 Introduction
Except for Planetary Nebulae, high excitation features, such as nebular He ii emission, are not expected in H ii regions. Indeed, normal O stars do not emit enough hard UV photons to produce detectable nebular He ii emission. However, in the last two decades, seven objects of the Local Group were found to harbour such nebular He ii emission (Garnett et al. gar91 (1991)). Wolf-Rayet (WR) stars are the ionizing sources of five of them. These stars are hot, evolved massive stars that possess strong winds, but until then they were generally believed to be unable to excite such highly ionized nebulae. Nebular He ii emission was also discovered farther away, in star-forming galaxies (e.g. I Zw 18, see French fre (1980)) and WR stars were again thought to be responsible for it (Schaerer sch (1996)). This type of emission thus seems intimately linked to WR stars in most cases, and the analysis of these peculiar highly ionized objects can help us put tighter constraints on the poorly known extreme UV ionizing fluxes of these stars (Crowther cro (2002)). Only the He ii nebulae of the Local Group are situated close enough to enable a detailed study.
We study here the nebula associated with Brey2 (or BAT99-2 in Breysacher et al. bat (1999)), a WN2b(h) star in the Large Magellanic Cloud (Foellmi et al. foe (2003)). This WR star has blown a small bubble whose expansion velocity reaches 16 km s-1 (Chu et al. chu (1999)). Moderate chemical enrichment was detected in this bubble (Garnett & Chu gar (1994)). Using this result, Chu et al. (chu (1999)) suggested that the circumstellar bubble was probably currently merging with the interstellar bubble blown by the progenitor of the WR. Nebular He ii emission near Brey2 was first detected by Pakull (pak (1991)). Imaging of the nebula in the He ii lines is crucial in establishing the distribution of the emission in detail, in order to evaluate the total flux, and to better understand the origin of the ionization. To date, only low resolution, low signal/noise He ii images exist (Melnick & Heydari-Malayeri mel (1991)). Thanks to observations made with the Very Large Telescope (VLT), we present here the first high resolution He ii 4686 images and a detailed spectral analysis of this peculiar highly ionized nebula.
2 Observations
We obtained CCD images of Brey2 and its associated nebula with the FORS instrument installed on the 8 m VLT-UT3 in 2002 January. The images were taken through seven filters (H, [O iii], He i 5876, He ii 4686, plus three continuum filters centered on 4850, 5300, and 6665 Å) for exposure times of 3100s, 3100s, 9400s, 9400s, 960s, 960s, and 3100s, respectively. The seeing was 1″. The data were reduced with iraf using standard methods for overscan and bias subtraction and flatfielding. Stellar sources were removed using the photometric and astrometric information obtained from the continuum images (details are reported by Nazé et al., in preparation). The few remaining faint stars were either removed individually or not considered for flux determinations. Fig. 1 presents a three color image of the whole field; while Fig. 2 shows a close-up on Brey2 in the four nebular filters.
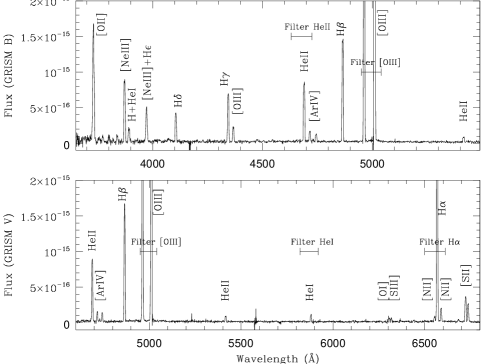
During the same observing run, we also obtained long-slit spectra of Brey2 with the same instrument. We used the 600B and 600V grisms to obtain a blue spectrum covering 3700-5600 Å () and a red spectrum covering 4500-6850Å (), respectively. The 1.3″6.8′ slit was tilted by 45∘ and centered on Brey2. The spatial resolution was 1.2″ and the spectral resolution, as mesured from the FWHM of the calibration lines, 7Å. The spectra were reduced and calibrated in a standard way using iraf. For flux calibration, we observed several standard stars from Oke (oke (1990)) and used the mean atmospheric extinction coefficients for CTIO reduced by 15%. Sky subtraction was done using a small region of the spectra where the nebular emission is the lowest. Only a few residuals remained for the brighter sky lines (e.g. [O i] 5577Å).
3 The high excitation nebula surrounding Brey2
3.1 Morphology
As seen in Fig. 1, the nebula surrounding Brey2 is quite complex. The bubble blown by the WR star is visible to the NW of the star as a small, quite bright arc(and arrow)-like structure, of external radius 15″. To the south of the star, a large shell, 100′′ in radius, may in fact be the interstellar bubble blown by the progenitor of Brey2 (Garnett & Chu gar (1994)). Though with a low S/N, the He i image appears well correlated with H, at least for the brightest features. But the [O iii] image seems less filamentary than the H image at the SNR’s position (see below) and at the SE of the field-of-view. It also shows several additional features compared to the H image. All H features on the eastern side of the nebula possess a lower [O iii]/H ratio than the central nebulosities surrounding Brey2. BSDL 49 (Bica et al. bic (1999)), an oval-shaped structure 160″ west of Brey2 and 140″100″ in size, presents an extremely low [O iii]/H ratio. These low ratios suggest that the regions are not ionized by early O or WR stars but most probably by cooler stars, e.g. late O or early B stars.
In contrast, the He ii image appears strikingly different (see Fig. 2). The arc-like structure emits strongly in He ii, and a fainter halo 90″70″ in size surrounds the star. These He ii emissions appear well centered on Brey2. The shell directly south of the star also emits He ii, but rather faintly. This shell may represent the limit of the He ii Strömgren sphere. Since the density south of Brey2 appears much lower than in the other directions, some He ii ionizing photons could escape the direct surroundings of Brey2 and ionize this shell. Finally, note that the very faint halo seems to extend to the bright H regions visible at the lower left of Fig. 1. However, since we do not have spectra of this region, we can not confirm that the nebular emission actually comes from He ii, and not from other nebular lines, e.g. [Ar iv].
We used the calibrated long-slit spectra to get the ADU-flux conversion factor of the images. The total He ii emission archalo is about 510-13 erg cm-2 s-1, or a luminosity of 3 1035 erg s-1 at the distance of the LMC (50 kpc), and after a reddening correction of (see §3.2). This corresponds to a flux of 41047 He+ ionizing photons s-1. Comparing to the models of Smith et al. (smi (2002)), this flux is compatible with a 90-100 kK WR star, consistent with the WN2 classification of Brey2.
To the NW of Brey2, a SNR was diagnosed by its high-velocity motions and confirmed through nonthermal radio emission and its high [S ii]/H ratio (Chu et al. chu (1999)). Between BSDL 49 and the features associated with Brey2, filamentary structures, characteristic of SNRs (Chen et al. che (2000)), prove the presence of this SNR candidate. Two rather bright H filaments seem to delineate the SNR to the north and south. They form a region some 50″ in radius. Our long-slit spectra taken at that position show clear indications of an enhanced [S ii]/H ratio, typical of SNRs (see below), and a lower [O iii]/H ratio.
3.2 Spectrophotometry
The Balmer decrement H/H was used to derive the interstellar extinction, assuming the theoretical case B decrement at and (Storey & Hummer sto (1995)). Some faint stars sometimes affected the nebular spectra. In such cases, we correct the measured emission line strengths by a 2 Å equivalent width for the Balmer absorptions (McCall et al. mcc (1985)) before estimating the reddening. To deredden the line ratios, we used the extinction law from Cardelli et al. (car (1989)) with . Spectra were extracted from five regions of interest for detailed analysis (Fig. 1): the first one includes the arrow of the arc-like structure (12″ long without the star); the second and third ones explore the eastern and western He ii halos (34″ and 22″ long, respectively); the fourth examines the eastern part of the large southern shell (40″ long); and the fifth investigates the properties of the SNR candidate situated to the NW of the star (44″ long). The extinction-corrected line ratios for these regions are listed in Table 1.
Using the nebular package under iraf
(Shaw & Dufour sha (1995)), we then derived temperatures, densities
and abundances in these regions (see Table 2). To get Helium
abundances, we used the emissivities computed by Benjamin et al.
(ben (1999)) for He i and by Storey & Hummer (sto (1995)) for
H and He ii. The presence of He ii suggests that higher ionization
states than O2+ exist as well. This can actually explain the slightly
smaller [O iii]/H ratio of the arc-like structure compared to
its direct surroundings. Following Garnett & Chu (gar (1994)),
we derived the total oxygen abundance using :
Compared to the LMC abundances (Russell & Dopita rus (1990)), no
sign of enrichment in helium can be detected for the He ii nebula.
But its oxygen abundance is slightly lower (max 35%), and its N/O ratio
slightly higher (min 30%) than the LMC’s trend. This is compatible
with what might be expected for a nebula enriched by a stellar wind.
Using a closer background for analysing the spectrum of the arc does not
change this conclusion. On the other hand, the
SNR shows rather low helium and oxygen abundances, but a normal N/O
ratio.
| Line | Arc | Halo E | Halo W | S shell | SNR | |
|---|---|---|---|---|---|---|
| [O ii] 3727 | 1.54 | 132 (14) | 268 (28) | 225 (23) | 344 (36) | 853 (89) |
| [Ne iii] 3868 | 1.50 | 69 (7) | 96 (10) | 93 (9) | 85 (8) | 84 (8) |
| H8 + He i 3889 | 1.50 | 17 (2) | 19 (2) | 19 (5) | 17 (2) | |
| [Ne iii] + H 3967 | 1.47 | 38 (4) | 42 (4) | 44 (4) | 31 (3) | 23 (2) |
| H | 1.43 | 30 (3) | 30 (3) | 30 (3) | 28 (3) | 27 (3) |
| H | 1.35 | 50 (4) | 52 (4) | 51 (4) | 50 (4) | 52 (4) |
| [O iii] 4363 | 1.34 | 16 (1) | 16 (1) | 16 (1) | 13 (1) | 28 (2) |
| He i 4471 | 1.30 | 3.6 (0.3) | ||||
| He ii 4686 | 1.22 | 56 (4) | 21 (01) | 24 (2) | 8.1 (0.6) | |
| [Ar iv] 4711a | 1.21 | 8.2 (0.6) | 3.8 (0.3) | |||
| [Ar iv] 4740 | 1.20 | 6.9 (0.5) | 3.8 (0.3) | |||
| H | 1.16 | 100. | 100. | 100. | 100. | 100. |
| [O iii] 4959 | 1.13 | 234 (17) | 313 (22) | 318 (23) | 272 (20) | 165 (12) |
| [O iii] 5007 | 1.12 | 691 (49) | 945 (67) | 944 (67) | 804 (58) | 489 (35) |
| He ii 5412 | 1.02 | 4.5 (0.4) | 2.1 (0.2) | |||
| He i 5876 | 0.93 | 5.2 (0.5) | 10 (1) | 9.6 (0.8) | 11 (1) | 9.1 (0.8) |
| [O i] 6300 | 0.86 | 3.1 (0.3) | 4.9 (0.5) | 7.3 (0.7) | 25 (2) | |
| [S iii] 6312 | 0.86 | 2.6 (0.3) | 3.7 (0.4) | 3.0 (0.3) | ||
| [O i] 6364 | 0.85 | 2.4 (0.2) | 8.8 (0.8) | |||
| [N ii] 6548 | 0.82 | 3.4 (0.3) | 7.9 (0.8) | 5.5 (0.6) | 10 (1) | 17 (2) |
| Hb | 0.82 | 279 (28) | 279 (28) | 279 (28) | 279 (28) | 270 (27) |
| [N ii] 6583 | 0.82 | 10 (1) | 22 (2) | 19 (2) | 30 (3) | 54 (5) |
| He i 6678 | 0.80 | 1.7 (0.2) | 2.7 (0.3) | 2.9 (0.3) | 4.3 (0.5) | |
| [S ii] 6716 | 0.79 | 16 (2) | 31 (3) | 29 (3) | 40 (4) | 93 (10) |
| [S ii] 6731 | 0.79 | 12 (1) | 22 (4) | 21 (2) | 29 (3) | 68 (7) |
| (H) (erg cm-2 s-1) | 1.16e-14 | 1.30e-14 | 1.93e-14 | 1.25e-14 | 7.47e-15 | |
| (mag) | 0.65 (0.22) | 0.70 (0.22) | 0.72 (0.22) | 0.62 (0.22) | 1.06 (0.22) |
a The small pollution due to He i 4713 was corrected using the
strength of He i 5876 and the theoretical He i ratios from Benjamin
et al. (ben (1999)).
b Pollution due to He ii 6560 negligible.
| Prop. | Arc | Halo E | Halo W | S shell | SNR |
|---|---|---|---|---|---|
| [O iii] (K) | 16100750 | 14300600 | 14100650 | 14000600 | 298002700 |
| [S ii] (cm-3) | 350 | 310 | 280 | ||
| [Ar iv] (cm-3) | 950-4000 | 3200-7000 | |||
| He+/H | 4.440.30 | 7.780.53 | 7.700.40 | 10.30.7 | 7.170.62 |
| He2+/H | 4.910.26 | 1.800.13 | 2.190.12 | 0.700.05 | |
| He/H | 9.350.40 | 9.580.55 | 9.890.42 | 11.00.7 | 7.170.62 |
| O0+/H | 1.260.12 | 2.800.27 | 4.470.31 | 2.530.17 | |
| O+/H | 0.900.09 | 2.640.27 | 2.320.24 | 3.630.38 | 3.250.34b |
| O2+/H | 0.610.03 | 1.120.05 | 1.170.05 | 1.020.05 | 0.130.01 |
| O/H | 1.510.09 | 1.730.08 | 1.860.08 | 1.480.06 | 0.480.01b |
| N+/H | 0.690.05 | 1.950.14 | 1.540.11 | 2.640.19 | 1.380.10 |
| ( N/O)a | 7.660.98 | 7.390.93 | 6.640.84 | 7.290.92 | 4.240.53b |
| S+/H | 2.440.19 | 5.700.45 | 5.510.41 | 7.720.59 | 6.070.44 |
| S2+/H | 1.170.11 | 2.360.23 | 2.010.19 | ||
| Ar3+/H | 4.310.23 | 2.930.16 | |||
| Ne2+/H | 1.550.15 | 3.010.30 | 3.040.30 | 2.850.28 | 0.500.05 |
a Assuming
b To consider with caution : the calculation of the [O i] abundance was made at 20 000 K.
4 Conclusion
We have presented the first high resolution images of the nebula around Brey2, one of the 7 He ii nebulae of the Local Group. He ii is particularly emitted by a small arc-like structure, some 15″ in radius, that surrounds the star. This arc corresponds to the bubble blown by the WR star. Fainter He ii emission is present in a surrounding halo, and still fainter He ii emission is detected in the large interstellar bubble blown by the progenitor of Brey2 towards the south of the star. We derived an He+ ionizing flux of 41047 photons s-1, which appears consistent with the latest theoretical models for very early WN stars. We also confirm the results of Garnett & Chu (gar (1994)) regarding the composition of the nebula: with a larger N/O ratio and a slightly smaller O abundance, the small nebula associated with Brey2 shows only modest enrichment by stellar winds. We have also identified the SNR in the FORS images, and have analysed its spectrum. The bright - thus dense - H region situated between Brey2 and the SNR may be the result of the compression of the ISM between these two expanding structures.
Acknowledgements.
We acknowledge support from the PRODEX XMM-OM and Integral Projects and through contracts P4/05 and P5/36 ‘Pôle d’Attraction Interuniversitaire’ (Belgium).References
- (1) Benjamin,R.A., Skillman, E.D., & Smits, D.P. 1999, ApJ, 514, 307
- (2) Bica,E.L.D.,Schmitt,H.R.,Dutra,C.M.,&Oliveira,H.L.1999,AJ,117,238
- (3) Breysacher, J., Azzorpardi,M., & Testor,G. 1999, A&AS, 137, 117
- (4) Cardelli, J.A., Clayton, G.C.,& Mathis, J.S. 1989, ApJ,345,245
- (5) Chen, C.-H.R., Chu, Y.-H., Gruendl, R.A.,& Points, S.D. 2000, AJ, 119, 1317
- (6) Chu, Y.-H., Weis, K., & Garnett, D.R. 1999, AJ, 117, 1433
- (7) Crowther, P.A. 2002, in “Interacting Winds from Massive Stars”, ASP Conf. Ser. 260, eds. Moffat & St-Louis, 119
- (8) Foellmi, C., Moffat, A.F.J., & Guerrero, M.A. 2003, MNRAS, in press
- (9) French, H.B. 1980, ApJ, 240, 41
- (10) Garnett, D.R., Kennicutt, R.C. Jr, Chu, Y.-H., & Skillman, E.D. 1991, PASP, 103, 850
- (11) Garnett, D.R. & Chu, Y.-H. 1994, PASP, 106, 626
- (12) McCall,M.L., Rybski, P.M., & Shields, G.A. 1985, ApJS,57,1
- (13) Melnick, J. & Heydari-Malayeri, M. 1991, IAUS, 143, 409
- (14) Oke, J.B. 1990, AJ, 99, 1621
- (15) Pakull, M.W. 1991, IAUS 143, 391
- (16) Russell, S.C. & Dopita, M.A. 1990, ApJS, 74, 93
- (17) Schaerer D. 1996, ApJ, 467, L 17
- (18) Shaw, R.A. & Dufour, R.J. 1995, PASP, 107, 896
- (19) Smith,L.J.,Norris,R.P.F.,&Crowther,P.A. 2002,MNRAS,337,1309
- (20) Storey, P.J. & Hummer, D.G. 1995, MNRAS, 272, 41