Discovery of Two Distant Type Ia Supernovae in the Hubble Deep Field North with the Advanced Camera for Surveys
Abstract
We present observations of the first two supernovae discovered with the recently installed Advanced Camera for Surveys (ACS) on the Hubble Space Telescope (HST). The supernovae were found in Wide Field Camera images of the Hubble Deep Field North taken with the F775W, F850LP, and G800L optical elements as part of the ACS guaranteed time observation program. Spectra extracted from the ACS G800L grism exposures confirm that the objects are Type Ia supernovae (SNe Ia) at redshifts and . Follow-up HST observations have been conducted with ACS in F775W and F850LP and with NICMOS in the near-infrared F110W bandpass, yielding a total of 9 flux measurements in the 3 bandpasses over a period of 50 days in the observed frame. We discuss many of the important issues in doing accurate photometry with the ACS. We analyze the multi-band light curves using two different fitting methods to calibrate the supernovae luminosities and place them on the SNe Ia Hubble diagram. The resulting distances are consistent with the redshift-distance relation of the accelerating universe model, although evolving intergalactic grey dust remains as a less likely possibility. The relative ease with which these SNe Ia were found, confirmed, and monitored demonstrates the potential ACS holds for revolutionizing the field of high-redshift SNe Ia, and therefore of testing the accelerating universe cosmology and constraining the “epoch of deceleration.”
To appear in The Astrophysical Journal, 2003 June 1
1 Introduction
The discovery of an apparent acceleration in the universal expansion (Riess et al. 1998; Perlmutter et al. 1999) using Type Ia supernovae (SNe Ia) has been one of the prime motivations for the recent dramatic shift in the prevailing cosmological paradigm. The formerly favored, spatially flat, matter-dominated Einstein-deSitter model has given way to the new, observationally mandated “concordance model” possessing a higher expansion rate, a lower matter density consistent with long-standing indications from cluster and large-scale structure studies, and a mysterious dark energy component usually identified with Einstein’s cosmological constant . Like the deposed paradigm, the new one is also spatially flat with a total energy density equal to the critical density, as required by cosmic microwave background (CMB) analyses (e.g., Jaffe et al. 2001; Pryke et al. 2002), but the ratio of dark energy to matter at the present epoch is roughly 2:1.
While a dark energy component is the favored explanation for the unexpected faintness of distant SNe Ia, other possibilities include luminosity evolution and grey dust obscuration. In their simplest form, these alternative models predict that SNe Ia should continue to grow fainter with respect to a fiducial universe having constant expansion. On the other hand, dark energy models predict that SNe Ia should become differentially brighter at redshifts as a result of past deceleration. So far, only the uniquely distant SN 1997ff at has provided evidence for past deceleration (Gilliland et al. 1999; Riess et al. 2001), and this object was never spectroscopically confirmed as Type Ia (although its host and colors indicate it was). Only further high-quality data on SNe Ia at can confirm the cosmological explanation and eliminate the competing astrophysical ones. Such data will also help in pinning down precise values of the cosmological parameters, which are now only weakly constrained without the inclusion of external information, such as from the CMB.
Fortunately, the hunt for high redshift supernovae is becoming easier. Large format CCD mosaic cameras can efficiently search over a much wider area of the sky and spectra of faint SNe Ia candidates can now be obtained using 8-meter class telescopes. Another recent development expected to benefit the field of high- SNe Ia research is the installation of the new Advanced Camera for Surveys (ACS) (Ford et al. 1998) on the Hubble Space Telescope (HST). ACS has roughly twice the field of view, higher resolution, and nearly five times the sensitivity of WFPC2 at 8000 Å; this combination promises to increase the discovery efficiency of HST by an order of magnitude.
Here, we present observations of the first two SNe Ia discovered with ACS. The objects were found serendipitously in images of the Hubble Deep Field North (HDFN) taken by the Instrument DevelopmentTeam (IDT) as part of the ACS guaranteed time observation (GTO) program. The following section describes our discovery and follow-up observations, extraction of the grism spectra, and photometric measurements. Section 3 presents the SNe Ia light curves, the inferred distance moduli, and the updated Hubble diagram. Section 4 then discusses the implications of our results for cosmology and the prospects of ACS for the high- SNe Ia search field.
2 Observations and Data Reductions
2.1 Imaging Data
The Hubble Deep Field North (HDFN) was observed with the ACS Wide Field Camera (WFC) as part of the GTO program, proposal number 9301. The observations were conducted on 2002 May 11 in the F775W (SDSS ) and G800L (grism) bandpasses for two and three orbits, respectively, and on 2002 May 21 in F850LP (SDSS ) for three orbits. A complete description of the GTO program will be given in a future paper; here we concentrate on our measurements of the two supernovae that were found in these data.
The images were initially processed through the STScI CALACS pipeline (Hack 1999), which performs the bias and dark subtraction, flat-fielding, and conversion of the counts to electrons. Further reduction was done through the “Apsis” GTO data pipeline, described in detail by Blakeslee et al. (2002). Apsis measures offsets, rejects cosmic rays (CRs) and detector defects, and combines the images to a single geometrically corrected one using the drizzle method (Fruchter & Hook 2002). We used the default “square” kernel (bilinear interpolation) with an output scale of 005/pix for the drizzling. The resulting full width at half maximum (FWHM) of the point spread function (PSF) was about 0104 in F775W and 0110 in F850LP. While alternate kernels or output scales could reduce the PSF FWHM, this approach allows us to apply directly the aperture corrections from the ACS photometric calibration program (Sirianni et al. 2003).
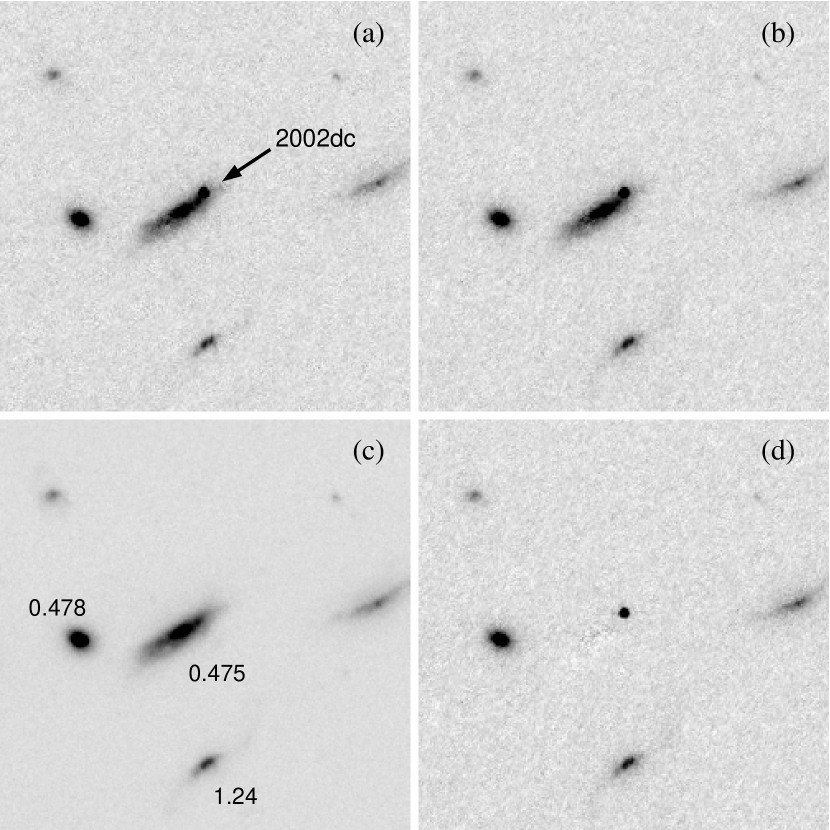
Inspection of the reduced images revealed two bright point sources that were not present in the original 1995 HDFN images. Figures 1 and 2 show subsections of the F775W and F850LP ACS images centered on these objects, as compared to the same regions taken from the 1995 WFPC2/F814W images. The first object, designated SN2002dc (Magee et al. 2002), is located at , (J2000), where our coordinates are on the system of the Fernández-Soto et al. (1999) catalogue. SN2002dc is 084 from the center of its apparent host galaxy, which is number 2-264.1 in the Williams et al. (1996) HDFN Catalog and has a measured redshift (Cohen et al. 1996).
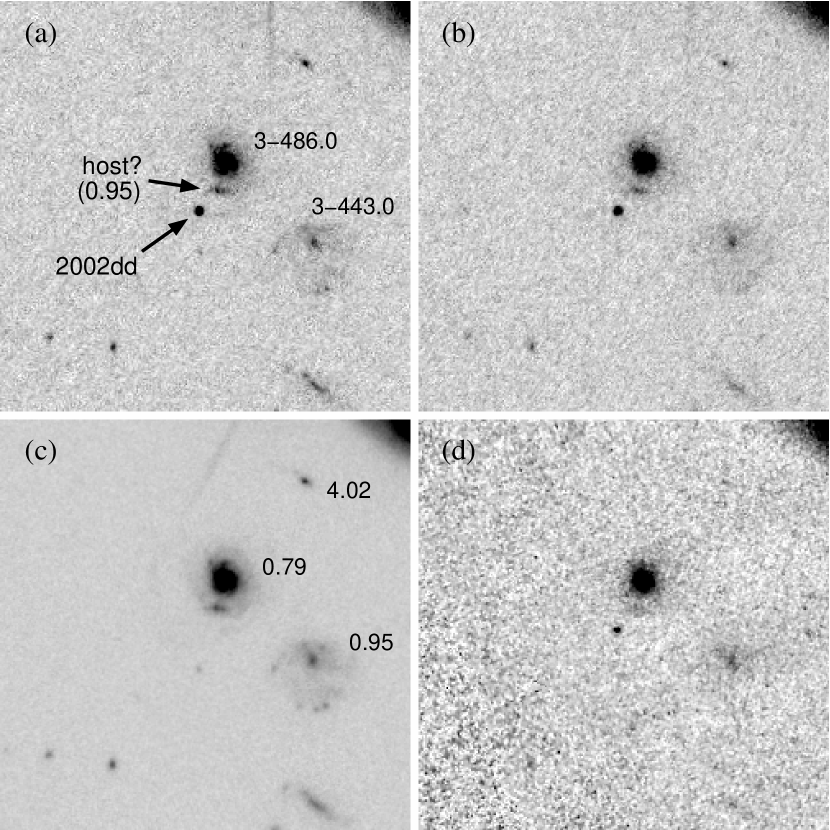
The second object, SN2002dd (Tsvetanov et al. 2002), was originally identified by its spectrum; it has coordinates , (J2000). It is located 164 from the center of the HDFN Catalog galaxy 3-486.0; however, this is not the host since it has a redshift (Cohen et al. 1996), whereas the SN2002dd spectrum (see below) places it at (note that the 11% higher redshift from the discovery telegram was based on the rough ground-based calibration of the ACS grism). Interestingly, the diffuse galaxy 3-443.0 has (Cohen et al. 2000) and is centered 36 away (projected separation kpc). In addition, there is a fainter, uncatalogued object 087 (4.7 kpc) from SN2002dd projected between it and 3-486.0 (see Figure 2). This object’s grism spectrum is consistent with a starburst galaxy at (see the following section), and there is some indication of faint luminosity (possibly a spiral arm) arching from it towards SN2002dd. We consider this the most likely host galaxy.
Because the ACS grism spectra indicated that these objects were both SNe Ia near maximum luminosity, we reobserved this field on 13 June under HST GO proposal #9352 for one ACS orbit split between F775W and F850LP and one orbit with Camera 2 of the recently revived NICMOS instrument in the F110W bandpass (SN2002dd only). Two additional single-orbit ACS observations done under GTO proposal #9301 on 24 June (split between F775W and F850LP), and 30 June (F850LP). These follow-up images were processed in the identical manner as the original HDFN GTO data, except that they were CR-split and CALACS performed the CR rejection. The NICMOS images were processed through the STScI CALNIC software and then combined using drizzle.
2.2 Grism Spectra
Preliminary discussions of the ACS G800L grism performance are given by Walsh et al. (2002) and Ford et al. (2002). The spectral dispersion for WFC grism exposures is 40 Å pix-1 on average, but varies with position by %. The resolution is typically 90 Å. Spectra of the two HDFN supernovae were extracted from the reduced ACS/WFC grism images using the aXe software (Pirzkal et al. 2002), which also performs the wavelength and flux calibrations. The on-orbit wavelength calibration is accurate to 10 Å, or 0.001 in redshift, and has been discussed in detail by Pasquali et al. (2002). We subtracted a polynomial fit to the sky in the cross-dispersion direction in the 2-d image before aXe extraction. For SN2002dc, we also needed to fit and remove the contribution from the host galaxy, so we masked the region of extraction and fit a polynomial to the very close background, interpolating over the masked region. The resulting local background was very flat.
We cross-correlated the extracted spectra against a database of high-signal-to-noise spectra of 27 different SNe Ia, most of which had data from multiple different dates. We determine the redshift from each template that gave a significant and unambiguous correlation peak, taking the rms dispersion in redshift values as an estimate of the uncertainty. We also performed cross-correlations against spectral templates for other supernovae types (Filippenko 1997), but none of these yielded an acceptable fit to either of the spectra. For SN2002dc, we find excellent matches with normal SNe Ia such as SN1995D, SN1994ae, SN1995E, and SN1994S. These overlap more than half of the rest-frame spectral range and give cross-correlation values (Tonry & Davis 1979) of 16 or more. The best consistency is for an age days past maximum, and the best-fit redshift is , with a total range from 0.45 to 0.49. This is in excellent agreement with the redshift for the host galaxy from Cohen et al. (1996, 2000).
![[Uncaptioned image]](/html/astro-ph/0302402/assets/x3.png)
ACS grism spectra transformed to the rest frame for SN2002dc at and SN2002dd at are compared with ground-based spectra from two redshift zero SNe Ia near maximum luminosity. The SN2002dc spectrum closely resembles that of SN1981B in the galaxy NGC 4536, including the Si ii absorption at 6150 Å, which is the defining feature of SNe Ia. This is the first time this feature has been seen at . The spectrum of SN2002dd appears intermediate between those of SN1981B and SN1990N in NGC 4639. In particular, it shows the deep Ca ii trough at 3750 Å and numerous other features due to Si ii and Fe ii common to SNe Ia.
![[Uncaptioned image]](/html/astro-ph/0302402/assets/x4.png)
Observed ACS grism spectrum of the SN2002dd candidate host galaxy (see Fig. 2). The 1- error region is delineated by the gray area. The dark curve is a spectrum of a nearby starburst galaxy from Calzetti et al. (1994) that has been redshifted to , smoothed to the resolution of the ACS grism extraction, and rescaled for comparison purposes. The broad line near 7200 Å in the grism spectrum aligns well with the [O ii] emission in the comparison spectrum for this redshift.
For SN2002dd, we find good spectral matches with SN1995D, SN1990O, SN1981B, SN1972E, SN1990N, and SN1994ae, among others. The range of acceptable ages is fairly broad, 7 to 9 days past maximum. The best-fit redshift is , with a total range of 0.90–0.97. These results rule out the galaxy 16 away as a possible host, but are consistent with the redshift of the galaxy 36 away (our grism spectra for both these galaxies support the results from Cohen et al.). We note that a number of spectral templates, including SN1989B, SN1992a, SN1994m, and SN1996x, produced formally acceptable fits, but with . In fact, many of the templates have some correlation peak at this redshift, but these fits are all of significantly lower quality than the best fits with . In addition, the photometric data for SN2002dd is completely incompatible with . While the correct redshift is clear in this case, we wish to caution that SNe Ia cross-correlation results in general depend critically on the wavelength coverage and the set of spectral templates used.
Figure 2.2 shows the calibrated, rest-frame spectra of the supernovae with a 5-pixel (2–2.5 times the FWHM) extraction aperture, and compares them to smoothed spectra of two nearby “standard” SNe Ia at maximum luminosity. Both SN2002dc and SN2002dd display many of the standard spectral characteristics of SNe Ia, which have been discussed in detail by Coil et al. (2000) for SNe Ia at these redshifts. In particular, we note that SN2002dc shows the Si ii absorption trough at rest Å, which is considered the defining feature of SNe Ia and thus confirms the Type Ia identification. This is the first time the complete feature has been unambiguously seen at . It is nearly impossible to observe from the ground at these redshifts, being an absorption feature in a faint spectrum at Å.
While the SN2002dd spectrum does not extend to the Si ii feature, its general characteristics easily rule out all other types of supernovae except the rare luminous Type Ic (see Clocchiatti et al. 2000). However, as discussed by Riess et al. (1998), Type Ic supernovae tend to lack the very deep Ca ii absorption with strong recovery to the peak at 4000 Å. In addition, only SNe Ia spectra show the notch in this peak due to Si ii . Clearly, SN2002dd shares these characteristic of SNe Ia. We therefore regard both objects as spectroscopically confirmed SNe Ia having redshifts consistent with the host or neighboring galaxies.
Finally, Figure 2.2 presents the grism spectrum of the faint candidate host galaxy identified in Figure 2, and compares it to that of the starburst galaxy NGC 3049 from Calzetti et al. (1994)111http://www.stsci.edu/ftp/catalogs/nearby_gal/sed.html. The starburst spectrum has been redshifted to and smoothed to the resolution of the grism spectrum. The feature at 7200 Å in the candidate host’s spectrum matches the [O ii] line at this redshift. The continuum shape is also a reasonable match, although this varies considerably among starburst galaxies. We suggest that SN2002dd lies in the outskirts of this faint galaxy, which in turn is a dwarf companion of the larger galaxy.
2.3 Photometry
We measured the fluxes of the two supernovae in each bandpass at each epoch using the Vista “psf” routine, which derives the scale factors between faint point sources and brighter PSF template stars using an implementation of the DoPhot (Shechter et al. 1993) “wingy Gaussian” fitting function. Seven different high signal-to-noise (S/N) stars in the field were used as psf templates for the F850LP images, and five of these were also used as templates for the F775W photometry (the two brightest were just saturated in the first epoch F775W image). The aperture flux of the faint source is derived from the aperture flux of the high-S/N template times the fitted scale factor. The total flux was then derived using the bandpass-dependent aperture corrections of Sirianni et al. (2003), plus small adjustments for the color-dependence of the F850LP aperture correction (Gilliland & Riess 2002). We experimented with several different aperture sizes for the PSF stars but always derived consistent total magnitudes at the 1% level after applying these aperture corrections. In the end, we chose an aperture of radius 05 as affording the best compromise between systematic and random error. Although the F850LP correction becomes very sensitive to color at small radii for extremely red objects, the adjustment from Gilliland & Riess for objects with the colors of the SNe and PSF stars is only 0.01 mag for this aperture. The adopted aperture corrections are then 0.077 mag in F775W and 0.116 in F850LP.
For SN2002dc, it was necessary to subtract the host galaxy. We used the very deep WFPC2/F814W image remapped to the scale and orientation of the ACS frames and rescaled the galaxy flux to minimize the residuals upon subtraction of the galaxy from each of the F775W and F850LP discovery images. The flux ratios were determined after smoothing the ACS images to the WFPC2 resolution, but the photometric measurements were done after subtracting the rescaled galaxy from the original (unsmoothed) ACS images. Figure 1 illustrates our F850LP subtraction. Scaling of the flux to the later (shorter) observations was done according to the exposure time. We varied the derived scale factors by % (about twice the uncertainty of the flux ratio determinations) and repeated the SN2002dc flux measurements. The results differed by less than 0.05%, primarily because the psf routine always subtracts a locally determined sky value. Therefore, the host galaxy subtraction is not a significant source of error.
We empirically determined the magnitude errors and biases via Monte Carlo experiments. We constructed a composite PSF star for each bandpass and added 50-100 cloned versions of this star scaled to the measured magnitudes of each of the two supernovae. We then recovered these artificially introduced stars, measured their magnitudes with the psf routine described above, and compared to the true magnitude. We repeated this procedure 10 times at each epoch for both F775W and F850LP. The errors determined in this way agreed closely with the errors we estimated from first principles based on all sources of noise, including the scatter in the results arising from different PSF templates. The estimated and measured errors differed on average by about 0.01 mag, and never by more than 0.02 mag. We found some small biases in the fitted scale factors, ranging between zero and 0.06 mag (typically half the measured 1- error or less), and corrections for these were applied. We also tested our approach against results obtained using DAOPHOT (Stetson 1987), and again found agreement at the 0.01 mag level.
For the single-epoch NICMOS/F110W observation of SN2002dd, we took a slightly different approach. The small field of view encompassed essentially no good PSF comparison stars. So, instead, we created ten PSFs for this camera using Tiny Tim (Krist & Hook 2001) and added them to each calibrated image after determining the offsets but prior to drizzle combination. We then determined the relative scale between SN2002dd and these artificial PSFs in the drizzled image using both DAOPHOT and the Vista/DoPhot PSF-fitting approach.
The ACS instrumental magnitudes were then transformed to the AB system using the latest calibrations. This is the same as derived from the header photometric keywords for F775W, but we anticipate a correction of 0.064 mag to the current (2002 December) F850LP header calibration (Sirianni et al. 2003). The adopted zero points for 1sec-1 are then 25.654 (F775W) and 24.850 (F850LP)222The 2003 February photometric recalibration of ACS differs from these zero points by 0.013 mag in F775W and 0.006 mag in F850LP. These differences are too small to affect any of our conclusions.. For the light curve analysis, we require Vega magnitudes, and use AB to Vega conversions of (F775W) and (F850LP). For the NICMOS/F110W data, we calibrated directly to the Vega system using the preliminary post-servicing mission zero point for camera 2, which is about % more sensitive than for cycle 7 (M. Dickinson & M. Rieke, priv. comm.). Because of the still-tentative nature of this calibration, we have added a conservative 0.07 mag in quadrature to the F110W measurement error to get the final uncertainty.
Finally, because the photometric record is most complete in F850LP but the first F850LP observation (“epoch 2”) occurred 10 days after the first F775W and G800L observations (“epoch 1”), we derived a first epoch F850LP magnitude from the grism spectrum and F775W magnitude. To do this, we used the extracted count spectrum, divided out the G800L response function, integrated the result across the filter bandpasses, and applied the AB zero points to derive a color directly from the grism spectrum, . Because of aperture and other effects, this will not exactly correspond to the colors measured from the direct images. However, we plotted the epoch 2 F850LP magnitudes against the epoch 1 F775W measurements for all isolated, unsaturated point sources having AB mag 25. The result is shown in Figure 2.3.
A total of 21 point sources were used to define the linear relation in Figure 2.3, which has a slope of 0.98 and a scatter of 0.045 mag. The residuals about the relation show no correlation with color. Forcing a slope of unity increases the scatter by 0.009 mag. Both supernovae lie 0.2 mag above the relation, indicating that they each faded by about this amount in the 10 day interval. One other relatively faint object (shown with an open circle in Figure 2.3) appears to have faded by a similar amount and was excluded from the fit, being a - outlier, although including it does not significantly change the results. We use the fitted relation to “predict” the epoch 1 F850LP magnitudes of the SNe Ia, and include a 0.05 mag error in quadrature to allow for the scatter about the fit. Our final set of photometric measurements transformed to the Vega system are presented in Table 1.
![[Uncaptioned image]](/html/astro-ph/0302402/assets/x5.png)
Derivation of the first epoch F850LP SNe Ia magnitudes. Top: Second-epoch F850LP aperture magnitudes are plotted against the difference of the first-epoch F775W aperture magnitudes and color measured by integration of the grism spectra. Magnitudes are on the AB system. The solid line was fitted to the 21 solid points and is used to estimate what the F850LP magnitudes of the two supernovae would have been at the first epoch; the offset of the supernovae above the relation indicates that they both faded by about 0.2 mag in the 10 day interval between epochs. One other object, shown by the open circle, appears to have gotten fainter by a similar amount and was not used in the fit. Bottom: Magnitude residuals about the fit. The scatter of the solid points is 0.045 mag.
3 Light Curves and Distances
From the multicolor light curves defined by Table 1, we can calibrate the SNe Ia luminosities, and so infer their distances. Several different methods exist for doing this, including the decline rate parameterization (Phillips 1993), template fitting (Hamuy et al. 1995, 1996), multi-color light curve shape (MLCS) (Riess et al. 1996, 1998), stretch (Perlmutter et al. 1997), and best average template (BAT) (Tonry et al. 2003) methods. Here we employ both the MLCS and BAT methods to estimate the distances to SN2002dc and SN2002dd and place them on the Hubble diagram. BAT, while less developed than MLCS, does not assume a single-parameter family of objects, and therefore we can use it to test for consistency between two significantly different approaches to measuring SNe Ia distances.
3.1 -corrections
All methods for estimating SNe Ia distances depend on how well the data on the distant program objects and the calibrating set of local SNe Ia can be transformed to a common reference frame and photometric system for comparison. This can be achieved either by transforming the magnitudes of the distant objects to the closest-matching rest-frame bandpass in which the calibrating sample have been measured, or equivalently, through redshifting the photometric record of the calibrators and transforming to the bandpasses in which the distant SNe Ia were measured. In either case, the systematic error is minimized if the observed and template bandpasses match as closely as possible after shifting to the common reference frame. We note that the MLCS and BAT methods used in the analysis below take the opposite approaches as far as redshifting/blueshifting the calibrator/program objects.
Because the observation and comparison bandpasses will not match perfectly even after redshifting to a common frame, it is necessary to apply “-corrections” to convert the observed magnitudes to the template bandpasses. The problem of -corrections has been discussed in the context of SNe Ia by Hamuy et al. (1993); Kim et al. (1996); Schmidt et al. (1998); and Nugent et al. (2002), among others. We calculate the -corrections in a manner similar to Riess et al. (1998) and Tonry et al. (2003), except we use the model spectral energy distributions (SEDs) from Nugent et al. (2002). However, we force the models to agree with the average SNe Ia light curve from Jha (2002), which is based on extensive empirical multi-color data.
For each day that the model and template light curve data are tabulated, we integrate the model SEDs through the bandpasses, fit a spline to the differences with respect to the empirical light curve, multiply the result into the SED, and iterate to convergence. Once the model SED colors have converged to the observed light curve colors for every date, they can be used for the -correction calculation. In this way, we preserve both the detailed spectral features of the models and the general continuum shape defined by the empirical light curves. We include an allowance for mag error in the -corrections based on the scatter derived from individual SNe Ia near maximum-light (B. Schmidt, priv. comm.). This method ensures consistency with previous SNe Ia distance analyses while allowing us to obtain reliable -corrections for our rest-frame -band data. We note that if there is significant uncertainty in the redshift, this should also be included in the error analysis, but the -correction near maximum is not highly sensitive to the precise redshift. Also, in the present case, we believe that the SNe Ia redshifts are accurate to 0.01 (better for SN2002dc), based on a combination of the SNe Ia and galaxy spectra. Table 1 gives the F850LP -corrections used in the MLCS analysis.
3.2 Distances
We estimate the SNe Ia distances using both the MLCS method described in detail by Riess et al. (1996) and developed further by Riess et al. (1998), and the BAT method described by Tonry et al. (2003). Both methods use libraries of multiband SNe Ia light curves. The main difference is that MLCS parameterizes the light curve shape as a continuous 1-parameter function of the luminosity excess , whereas BAT determines the SNe Ia luminosity from a weighted average among the best-matching comparison light curves and uses the scatter in its error estimate. Both methods fit for the time of maximum and yield estimates of the extinction based on the color difference between model and observations. The distance is then inferred from the calibrated light curve after applying the derived rest-frame extinction correction. This should not be confused with the extinction correction of mag (Schlegel et al. 1998) that we apply first to the observed magnitudes prior to either method.
Table 2 lists the results of our MLCS and BAT analyses. The columns are: (1) SNe Ia designation; (2) redshift; (3) MLCS luminosity parameter (mag); (4) MLCS estimated distance modulus; (5) MLCS fitted -band extinction (mag); (6) best-matching SNe Ia light curve template from the BAT method; (7) BAT estimated distance modulus; (8) BAT fitted -band extinction (mag). The sense of the parameter from the MLCS fit is that SN2002dc is found to be underluminous by 0.1 mag, while SN2002dd is overluminous by 0.4 mag (i.e., systematic errors of these sizes would be made in assuming that SNe Ia were perfect standard candles). The light curve fits for SN2002dd were done both with and without the F775 data, corresponding to the rest-frame band. The two methods produce very similar results in each case, well within the quoted 1- fit errors. Although SN2002dc is nearer and brighter, the estimated errors from both methods are larger for this object because it is found to have significantly higher extinction, which adds to the distance uncertainty. The extinction is consistent with the presence of SN2002dc within the disk of its host galaxy.
![[Uncaptioned image]](/html/astro-ph/0302402/assets/x6.png)
Light curves and fitted MLCS model for SN2002dc in the rest-frame and bands. The model includes: luminosity parameter , which determines the shape of the curves; reddening, which sets the extinction; time of maximum; and the distance. All points were used in deriving the fit.
![[Uncaptioned image]](/html/astro-ph/0302402/assets/x7.png)
Light curves and fitted MLCS model for SN2002dd. Only
the F850LP and F110W measurements (rest-frame and , respectively)
were used in deriving this fit. The rest-frame data (observed F775W)
points were not used, but are shown in comparison to the light
curve of the fitted model. The model appears to decline more rapidly
than the data in , which could be due to metallicity or
other effects that become much more pronounced in the ultraviolet,
or due to insufficient -band template data.
The light curve fits for SN2002dc and SN2002dd from the MLCS method are shown in Figures 3.2 and 3.2, respectively. Overall, the fits look quite good. For SN2002dc, the observed F775W and F850LP observations are transformed to rest-frame and , which provide the best matches at this redshift. The results are basically unchanged if the transformation is instead done to and , which is an indication of the consistency of the -corrections. The -band light curve (observed F850LP) shows a hint of the late-time ingress of flux at red wavelengths, a common characteristic of SNe Ia.
For SN2002dd, the F850LP and F110W bandpasses transform most readily to rest-frame and , which are the most commonly used bandpasses for fitting SNe Ia light curves. The empirical library of -band light curve data is much less complete. Moreover, the shape of the UV continuum becomes sensitive to the metallicity (e.g., Höflich et al. 1998), which can cause systematic errors in the fits. These problems are compounded by the dust obscuration being greater in , so the peculiar systematic effects of this poorly constrained bandpass can unduly drive the fitted extinction values. For these reasons, rest-frame UV data have not in the past been used for light curve fitting, and our results omitting the F775W data may be more reliable; however, the analysis is not overly sensitive to their inclusion. Figure 3.2 shows the MLCS model from the fit to the F850LP and F110W data alone, but compares to the full data set. The agreement is reasonably good in , indicating that SN2002dd is not particularly abnormal in the UV, although the data appear to decline more slowly than the model, possibly due to the effects mentioned above. A better understanding and more extensive UV light curve data sets are needed to take full advantage of optical observations of SNe Ia at .
3.3 The Hubble Diagram
Figure 3 places the new SNe Ia distance measurements on the differential Hubble diagram of published SNe Ia. The distances are relative to a fiducial “coasting,” or “empty,” universe (), thus removing from consideration. The published data are binned as in Riess et al. (2001) with the extreme SN1997ff point represented by its upper limit. The data are compared to expectations from various models, including Einstein-deSitter (), an open universe model (, ), a flat -dominated model (, ), and some simplistic intergalactic “dust” models (described below). We use the MLCS distances for this comparison because the published data in the figure are largely from the MLCS method or have been homogenized to remove any mean offset from MLCS. The data point for SN2002dc would be offset fainter by 0.17 mag using the BAT result, while the SN2002dd point would be virtually unchanged.
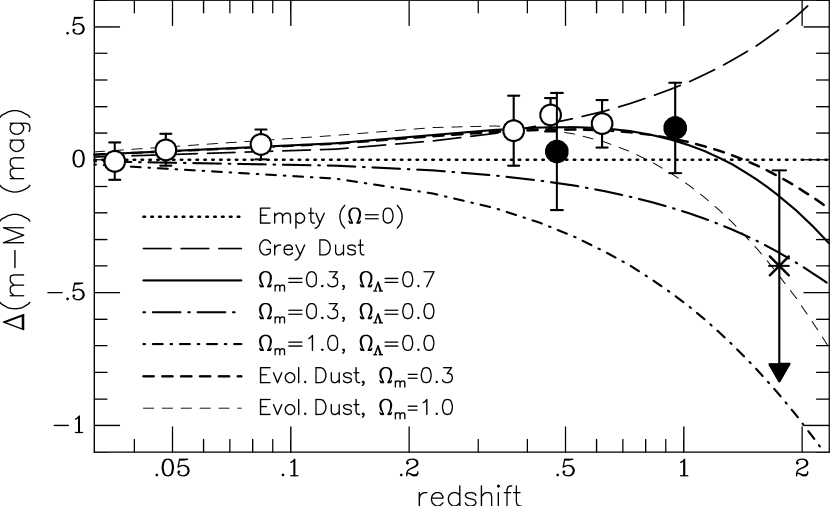
SN2002dc, like most individual SNe Ia at similar redshifts, is consistent with any of these models except without dust. SN2002dd at favors the -dominated or dust models, but SN1997ff at remains the sole indicator of past deceleration. A constrained fit to the binned data (open symbols) gives ; adding the two new MLCS distances and performing, purely for illustrative purposes, a hybrid binned/unbinned fit results in . If we replace the MLCS distances with our BAT results, the value becomes , or if the SN2002dd distance including the rest -band data is used. Thus, our data are fully consistent with the findings of Riess et al. (1998) and Perlmutter et al. (1999) favoring an accelerating universe.
However, Aguirre (1999) has argued that a uniform distribution of intergalactic dust can explain the faintness of intermediate redshift SNe Ia without invoking cosmic acceleration. Such dust might be expected to have grey scattering properties because only large grains (m) would likely survive the extreme conditions required for ejection into the intergalactic medium and the high temperatures believed to prevail there. While the observed brightness of the SN1997ff argues against the simplest, non-evolving, grey dust model and in favor of cosmological deceleration beyond (Riess et al. 2001), Goobar et al. (2002) show that models with an evolving dust density can accommodate SN1997ff.
In Figure 3, the model labeled “grey dust” is very similar to the one considered by Riess et al. (2001), with the optical depth directly proportional to redshift to approximate a fixed comoving density of dust, except here we calculate it for the open model, rather than for . However, the behavior of this non-evolving grey dust model is fairly insensitive to . The normalization of the extinction is adjusted to match the observed SNe Ia data near . The “evolving dust” models shown in the figure use the same cosmology, as well as , but have constant spatial densities of dust, to approximate continual injection of dust at a high enough rate to compensate for the dilution effect of the expansion; thus the comoving density decreases to higher redshift.
These two types of dust model essentially reproduce the behavior of the Goobar et al. (2002) models A and B, which those authors admit are not necessarily plausible in themselves but provide “useful limiting cases.” The plotted “dust” curves can therefore be taken to mark the approximate range of high-redshift behavior for decelerating models which invoke grey intergalactic dust. Of course, perfectly grey dust does not exist in reality, and efforts to detect a wavelength dependence of the SNe Ia dimming have not found any (e.g., Riess et al. 2000). Moreover, a direct upper limit on the density of intergalactic dust derived from the absence of a detectable X-ray scattering halo around a single distant quasar is well below that needed to explain the dimming of SNe Ia (Paerels et al. 2002). Therefore, cosmic acceleration seems the most natural and compelling explanation, although only further observations of high- SNe Ia over a large wavelength range can definitively rule out the challenge posed by these dust models.
3.4 Systematic Effects
Various systematic effects on high- SNe Ia distances such as extinction, gravitational lensing, and selection bias have been discussed in detail by Riess et al. (1998), Perlmutter et al. (1999), and several subsequent works. In our case, the objects were not found as part of any well-defined search effort, and so a statistical correction for selection bias is not possible. However, because they were both found well above the detection limit (the statistical error at the discovery epoch being only 0.01–0.02 mag), this bias would be minimal. We note that previous high- SNe Ia searches have not used such corrections.
Two issues are worth noting, however. First, the fitted extinction for SN2002dc, although fairly modest in Galactic terms, is large compared to most other high- SNe Ia previously measured. It is higher than for the great majority of objects in both the Riess et al. (1998) and Tonry et al. (2003) samples (most of which have fitted extinctions consistent with zero), as well as most objects from Perlmutter et al. (1999). On the other hand, the uncertainty in the extinction is fairly large, mag from MLCS and mag from BATM. This is the dominant source of distance uncertainty for SN2002dc (the extinction error for SN2002dd is about 0.16 mag from both methods). Still, it may be that seeing effects in ground-based data tend to select against SNe Ia deep inside galaxies that would have higher extinction values. Therefore, the quality of highly extincted SNe Ia distances has not been thoroughly tested. Further, there are no external checks of the extinction estimate, which depends critically on the assumption that the reddening law in the host is the same as that for the interstellar medium of our Galaxy, but variations are known to occur (Cardelli et al. 1989; Falco et al. 1999).
Another effect worth considering is weak gravitational lensing. Stochastic lensing by large-scale structure will tend to demagnify distant SNe Ia because the clustering of galaxies causes the typical line of sight to be underdense (e.g., Kantowski et al. 1996; Wambsganss et al. 1997). Both Riess et al. (1998) and Perlmutter et al. (1999) concluded that this effect was negligible for SNe Ia in the redshift range 0.5–1.0. However, certain SNe Ia may be significantly magnified if their line of sight is near massive foreground objects. In other words, although the magnification probability function peaks at a value less than unity, it is asymmetric with a tail towards higher magnification. In the case of SN1997ff at , which is projected near several bright –0.9 galaxies, the magnification has recently been estimated at mag (Benítez et al. 2002), which would bring it very close to the “empty” model in Figure 3.
We performed the same analysis for the two new SNe Ia as done by Benítez et al. (2002) for SN1997ff. The magnification derived for SN2002dc at is negligible. However, we find a magnification of mag for SN2002dd, with the largest contributions coming from galaxies 381 and 345 in the Fernandez-Soto et al. (1999) catalogue (3-486.0 and 3-610.1̄, respectively, from Williams et al. 1996). This would mean that SN2002dd is 10% more distant than inferred above. Such a high magnification at would have a probability of 0.5%, based on the -CDM galaxy-lensing model of Holz (1998), and an even lower probability according to the nearest equivalent model from Wambsganss et al. (1997). However, it is only significant at the 2- level, and this analysis does not account for the demagnification tendency of large-scale structure, which is very difficult to estimate for individual objects. Thus, our magnification estimate is biased high at some level.
To explore this issue, we repeated the analysis for 1000 random lines of sight in the HDFN and found an average magnification of mag, with 1.8% of them yielding values as high as for SN2002dd. If the average is taken as a zero point offset, the magnification for SN2002dd becomes mag. Of course, any given estimate may have systematic errors from the uncertain mass-to-light ratios of the foreground galaxies and the shapes of their potentials. Magnification corrections have not been applied to other SNe Ia at , and although we also choose not to apply this correction, we note it is probable that SN2002dd is magnified and the effect in Figure 3 would be to move this data point upward by perhaps 0.2 mag.
4 Discussion and Summary
Our analysis has added two additional high- points to the SNe Ia Hubble diagram, the first that have been found with the new ACS instrument on HST. Both objects were spectroscopically confirmed as SNe Ia near maximum-light by ACS grism spectra. SN2002dd at has a higher redshift than any other spectroscopically confirmed SNe Ia with a published distance. For instance, SN1997ck at (Garnavich et al. 1998) had neither spectroscopic confirmation nor useful color information; SN1997ff at also lacks spectroscopic confirmation, has an uncertain redshift, and all the photometry was transformed to the -band, so there was no constraint on extinction; SN1999fv at is the most distant SNe Ia with published confirmation (Tonry et al. 1999; Coil et al. 2000), but has insufficient light curve data with no color information, and thus only a weakly constrained distance (Tonry et al. 2003). However, with the already heavy use of ACS by the SNe Ia community, we expect that this circumstance will not last for very long.
Taken at face value, our distance for SN2002dd is most consistent with the -dominated cosmology favored by the analyses of the larger samples of ground-based SNe Ia in the –0.9 range by Riess et al. (1998) and Perlmutter et al. (1999). Within the context of such flat models dominated by a cosmological constant, the transition from acceleration to deceleration occurs at the “coasting point” redshift (Turner & Riess 2002). A reliable measurement of this redshift would therefore provide a strong constraint on . Although the transition occurs at for models with , the redshift of SN2002dd is still too low to yield any clear evidence for deceleration; in particular, it remains consistent with the simplest grey dust model. Moreover, we estimated that SN2002dd may be magnified by 0.2 mag due to the lensing effect of foreground galaxies, and this would push it further into agreement with the range of low- dust models. A larger sample of similar quality data on SNe Ia reaching to is needed to explore fully the systematic effects, definitively test the alternatives to acceleration, and constrain the expansion history of the universe.
In our view, the most encouraging aspect of the present work is the relative ease with which the observations were accomplished. Two supernovae were found serendipitously in a single ACS frame without even the usual search technique of image subtraction (the more distant one was found because of its grism spectrum; later searching by image subtraction turned up no additional bright candidates). Both were confirmed from their spectra as Type Ia near maximum-light and were followed with a relatively small expense of time, primarily with ACS. We have also shown, using an empirical relationship, how ACS grism data can be used to derive accurate colors and improve light-curve coverage. Moreover, now that NICMOS is again functional, it is possible to sample the rest-frame visual light of SNe Ia, as we have done for SN2002dd. This all bodes well for systematic searches for high- SNe Ia using ACS; indeed such a program has already shown extraordinary promise (Giavalisco et al. 2002; Riess et al. 2002), and we have every expectation that ACS will continue to deliver on this promise.
References
- Benitez et al. (2002) Benítez, N., Riess, A. G., Nugent, P. E., Dickinson, M. E., Chornock, R., & Filippenko, A. V. 2002, ApJ, 577, L1
- Blakeslee et al. (2002) Blakeslee, J. P., Anderson, K. R., Meurer, G. R., Benitez, N., & Magee, D. 2002, in ASP Conf. Ser., Astronomical Data Analysis Software and Systems XII, ed. H. Payne, R. Jedrzejewski, R. Hook, in press (astro-ph/0212362)
- Calzetti, Kinney, & Storchi-Bergmann (1994) Calzetti, D., Kinney, A. L., & Storchi-Bergmann, T. 1994, ApJ, 429, 582
- Cardelli, Clayton, & Mathis (1989) Cardelli, J. A., Clayton, G. C., & Mathis, J. S. 1989, ApJ, 345, 245
- Clocchiatti et al. (2000) Clocchiatti, A. et al. 2000, ApJ, 529, 661
- Cohen et al. (1996) Cohen, J. G., Cowie, L. L., Hogg, D. W., Songaila, A., Blandford, R., Hu, E. M., & Shopbell, P. 1996, ApJ, 471, L5
- Cohen et al. (2000) Cohen, J. G., Hogg, D. W., Blandford, R., Cowie, L. L., Hu, E., Songaila, A., Shopbell, P., & Richberg, K. 2000, ApJ, 538, 29
- Coil et al. (2000) Coil, A. L. et al. 2000, ApJ, 544, L111
- Falco et al. (1999) Falco, E. E. et al. 1999, ApJ, 523, 617
- Fernández-Soto, Lanzetta, & Yahil (1999) Fernández-Soto, A., Lanzetta, K. M., & Yahil, A. 1999, ApJ, 513, 34
- Filippenko (1997) Filippenko, A. V. 1997, ARA&A, 35, 309
- Ford et al. (1998) Ford, H. C. et al. 1998, Proc. SPIE, 3356, 234
- Ford et al. (2002) Ford, H. C. et al. 2002, Proc. SPIE, 4854, in press
- Fruchter & Hook (2002) Fruchter, A. S. & Hook, R. N. 2002, PASP, 114, 144
- Garnavich et al. (1998) Garnavich, P. M. et al. 1998, ApJ, 493, L53
- Giavalisco et al. (2002) Giavalisco, M. et al. 2002, IAU Circ., 7981
- Gilliland et al. (2001) Gilliland, R. L., Nugent, P. E., & Phillips, M. M. 1999, ApJ, 521, 30
- Gilliland & Riess (2002) Gilliland, R. L. & Riess, A. G. 2002, HST Calibration Workshop
- Goobar, Bergström, & Mörtsell (2002) Goobar, A., Bergström, L., & Mörtsell, E. 2002, A&A, 384, 1
- hack (1999) Hack, W.J. 1999, CALACS Operation and Implementation, ISR ACS-99-03 (Baltimore: STScI)
- Hamuy et al. (1993) Hamuy, M., Phillips, M. M., Wells, L., & Maza, J. PASP, 105, 787
- Hamuy et al. (1995) Hamuy, M., Phillips, M. M., Maza, J., Suntzeff, N. B., Schommer, R. A., & Avilés, R. 1995, AJ, 109, 1
- Hamuy et al. (1996) Hamuy, M., Phillips, M. M., Suntzeff, N. B., Schommer, R. A., Maza, J., Smith, R. C., Lira, P., & Avilés, R. 1996, AJ, 112, 2438
- Hoeflich et al. (1998) Höflich, P., Wheeler, J. C., & Thielemann, F. K. 1998, ApJ, 495, 617
- Jaffe et al. (2001) Jaffe, A. H. et al. 2001, Physical Review Letters, 86, 3475
- Jha (2002) Jha, S. 2002, PhD Thesis, Harvard University
- Kantowski, Vaughan, & Branch (1995) Kantowski, R., Vaughan, T., & Branch, D. 1995, ApJ, 447, 35
- Kim et al. (1996) Kim, A., Goobar, A., & Perlmutter, S. 1996, PASP, 108, 190
- Krist & Hook (2001) Krist, J. E. & Hook, R. N. 2001, The Tiny Tim User’s Guide, Version 6.0 (Baltimore: STScI) (http://www.stsci.edu/software/tinytim/)
- Magee et al. (2002) Magee, D. et al. 2002, IAU Circ., 7908
- Nugent et al. (2002) Nugent, P., Kim, A., & Perlmutter, S. 2002, PASP, 114, 803
- Paerels, Petric, Telis, & Helfand (2002) Paerels, F., Petric, A., Telis, G., & Helfand, D. J. 2002, American Astronomical Society Meeting, 201,
- Pasquali et al. (2002) Pasquali, A., Pirzkal, N., & Walsh, J.R. 2002, HST Calibration Workshop, eds. S. Arribas, A. Koekemoer, B. Whitmore (Baltimore: STScI) (astro-ph/0211651)
- Perlmutter etal (1997) Perlmutter, S. et al. 1997, ApJ, 483, 565
- Perlmutter etal (1999) Perlmutter, S. et al. 1999, ApJ, 517, 565
- Phillips (1993) Phillips, M. M. 1993, ApJ, 413, L105
- Pirzkal et al. (2002) Pirzkal, N., Pasquali, A., Walsh, J., & Hook, R. N. 2002, aXe User Manual (Garching: ST-ECF) (http://www.stecf.org/software/axe/)
- Pryke et al. (2002) Pryke, C., Halverson, N. W., Leitch, E. M., Kovac, J., Carlstrom, J. E., Holzapfel, W. L., & Dragovan, M. 2002, ApJ, 568, 46
- Riess et al. (1996) Riess, A. G., Press, W. H., & Kirshner, R. P. 1996, ApJ, 473, 88
- Riess et al. (1998) Riess, A. G. et al. 1998, AJ, 116, 1009
- Riess et al. (1999) Riess, A. G. et al. 1999, AJ, 117, 707
- Riess et al. (2000) Riess, A. G. et al. 2000, ApJ, 536, 62
- Riess et al. (2001) Riess, A. G. et al. 2001, ApJ, 560, 49
- Riess et al. (2002) Riess, A., Grogin, N., Hornschemeier, A., Lucas, R., & Richardson, M. 2002, IAU Circ., 8012
- Schechter et al. (1993) Shechter, P. L., Mateo, M., & Saha, A. 1993, PASP, 105, 1342
- Schlegel et al. (1998) Schlegel, D. J., Finkbeiner, D. P., & Davis, M. 1998, ApJ, 500, 525
- Schmidt et al. (1998) Shmidt, B. P. et al. 1998, ApJ, 507, 46
- Sirianni et al. (2003) Sirianni, M. et al. 2003, in preparation
- Stetson (1987) Stetson, P. B. 1987, PASP, 99, 191
- Tonry & Davis (1979) Tonry, J. & Davis, M. 1979, AJ, 84, 1511
- Tonry (1999) Tonry, J., et al. 1999, IAU Circ., 7312
- Tonry (2003) Tonry, J. L. et al. 2003, in preparation
- Tsvetanov et al. (2002) Tsvetanov, Z., Blakeslee, J., Ford, H., Magee, D., Illingworth, G., & Riess, A. 2002, IAU Circ., 7912
- Turner & Riess (2002) Turner, M. S. & Riess, A. G. 2002, ApJ, 569, 18
- Walsh et al. (2002) Walsh, J., Pasquali, A., & Pirzkal, N. 2002, Proc. SPIE, 4854, in press
- Wambsganss, Cen, Xu, & Ostriker (1997) Wambsganss, J., Cen, R., Xu, G., & Ostriker, J. P. 1997, ApJ, 475, L81
- Williams et al. (1996) Williams, R. E. et al. 1996, AJ, 112, 1335
| Epoch | JDaaJulian Date2,452,000 | F775WbbVega magnitude. | F850LPbbVega magnitude. | F110WbbVega magnitude. | cc-correction used in transforming the observed F850LP (-band) magnitude to rest-frame (SN2002dc) or (SN2002dd). |
|---|---|---|---|---|---|
| SN2002dc | |||||
| 1 | 405.4 | ddReconstructed from the F775W magnitude and G800L spectrum at this epoch. See text. | … | 0.86 | |
| 2 | 415.2 | … | … | 0.85 | |
| 3 | 438.1 | … | 0.92 | ||
| 4 | 449.4 | … | 0.89 | ||
| 5 | 455.2 | … | … | 0.86 | |
| SN2002dd | |||||
| 1 | 405.4 | ddReconstructed from the F775W magnitude and G800L spectrum at this epoch. See text. | … | 1.30 | |
| 2 | 415.2 | … | … | 1.34 | |
| 3 | 438.1 | 1.45 | |||
| 4 | 449.4 | … | 1.55 | ||
| 5 | 455.2 | … | … | 1.57 | |
| MLCS | BAT | ||||||
|---|---|---|---|---|---|---|---|
| SN | aaAbsolute distance moduli for a zero point with km sMpc-1. | Templ. | aaAbsolute distance moduli for a zero point with km sMpc-1. | ||||
| 2002dc | 0.475 | 0.10 | 0.18 | 1998aq | 0.29 | ||
| 2002dd | 0.950 | 0.40 | 0.10 | 1995al | 0.10 | ||
| 2002dd, no bbResults omitting the F775W data (rest-frame band).… | 0.950 | 0.42 | 0.11 | 1990N | 0.09 |