A Star-Forming Galaxy at in the Chandra Deep Field-South
Abstract
We report the discovery of a luminous star-forming galaxy in the Chandra Deep Field South. This galaxy was selected as an “-drop” from the GOODS public survey imaging with HST/ACS (object 3 in Stanway, Bunker & McMahon 2003, astro-ph/0302212). The large colour of indicated a spectral break consistent with the Lyman- forest absorption short-ward of Lyman- at . The galaxy is very compact (marginally resolved with ACS with a half-light radius of 0.08 arcsec, so kpc). We have obtained a deep (5.5-hour) spectrum of this galaxy with the DEIMOS optical spectrograph on Keck, and here we report the discovery of a single emission line centred on Å detected at with a flux of . The line is clearly resolved with detectable structure at our resolution of better than 55 km s-1, and the only plausible interpretation consistent with the ACS photometry is that we are seeing Lyman- emission from a galaxy. This is the highest redshift galaxy to be discovered and studied using HST data. The velocity width () and rest-frame equivalent width ( Å) indicate that this line is most probably powered by star formation, as an AGN would typically have larger values. The starburst interpretation is supported by our non-detection of the high-ionization N V 1240 Å emission line, and the absence of this source from the deep Chandra X-ray images. The star formation rate inferred from the rest-frame UV continuum is (, ). This is the most luminous starburst known at . Our spectroscopic redshift for this object confirms the validity of the -drop technique of Stanway, Bunker & McMahon (2003) to select star-forming galaxies at .
keywords:
galaxies: evolution – galaxies: formation – galaxies: starburst – galaxies: individual: SBM03#3 – galaxies: high redshift – ultraviolet: galaxies1 Introduction
A key question in modern cosmology is the star formation rate of galaxies in the young Universe. In the past few years, the Lyman break technique (Steidel, Pettini & Hamilton 1995) has proved very successful in identifying star-forming galaxies at , through their rest-frame UV continuum absorbed by the Lyman- forest of the intergalactic medium at Å (e.g., Steidel et al. 1996; Steidel et al. 1999). In a recent paper (Stanway, Bunker & McMahon 2003) we have pushed this technique to even earlier epochs, using the latest public data from the ‘Great Observatories Origins Deep Survey’ (GOODS; Dickinson & Giavalisco 2002), taken with the new Advanced Camera for Surveys (ACS; Ford et al. 2002) on the Hubble Space Telescope (HST). By selecting on extreme colours between the F775W and F850LP filters, we identify galaxies in the Chandra Deep Field-South (CDF-S) with which are likely to be at redshifts . In this Letter we report on our spectroscopic confirmation with Keck/DEIMOS of one of our candidates – object 3 in Stanway, Bunker & McMahon (2003), hereafter called SBM03#3. We show that this galaxy has Lyman- emission at a redshift of , and does indeed lie within the expected redshift range. This confirms the validity of -drop technique of Stanway, Bunker & McMahon (2003).
2 Observations and Data Reduction
We observed SBM03#3 (, ; Stanway, Bunker & McMahon 2003) on the nights of U.T. 2003 January 8 & 9, using the new Deep Imaging Multi-Object Spectrograph (DEIMOS; Davis et al. 2002, Phillips et al. 2002) at the Cassegrain focus of the 10-m Keck II Telescope. DEIMOS has 8 MIT/LL CCDs with m pixels and an angular pixel scale of 0.1185 arcsec pix-1. We used a slitmask to target various objects in the CDF-S over the arcmin DEIMOS field, as part of an ongoing program to obtain spectra of objects with extreme optical/near-infrared colours (to be reported elsewhere). Each slitlet was 1 arcsec wide, and the slit containing SBM03#3 was at the extreme edge of the field, so although the slit was 100 arcsec long, the target was only 3 arcsec from the slit edge. The observations were obtained using the Gold 1200 line mm-1 grating in first order blazed at Å, producing a dispersion of Å pixel-1. The grating was tilted to sample the wavelength range Å, corresponding to a rest-frame wavelength of Å at the redshift of SBM03#3 (, see Section 3.1). A small region in the middle of the wavelength range Å is unobserved as it falls in the gap between two CCDs. We used the OG550 order-blocking filter to remove all light at wavelengths short-ward of 5500 Å, so we should not be affected by second-order light.
The spectral resolution was measured to be Å from the sky lines and those of reference arc lamps (, a resolving power of ). As the seeing disk (typically 0.7 arcsec FWHM) was smaller than the slit width of 1.0 arcsec, the true resolution is somewhat better for a source which does not fill the slit.
The observations spanned an airmass range of . The PA of slits on the mask was 6 deg, chosen to be close North–South (0 deg, the parallactic angle) as the field was observed during meridian transit. A total of 20 ksec of on-source integration was obtained, and this was broken into individual exposures each of duration 2400 s to enable more effective cosmic ray rejection. We dithered the telescope 1.5 arcsec along the slit between integrations. The spectrophotometric standard star HZ 44 (Massey et al. 1988; Massey & Gronwall 1990) was observed to determine the sensitivity function. The flux calibration was checked with the spectra of the five alignment stars of known broad-band photometry ( mag), used to position the CDF-S mask through alignment boxes.
The data reduction followed standard procedures using IRAF. Each frame first had the bias subtracted, determined from the overscan region appropriate to that CCD. Contemporaneous flat fields were obtained with a halogen lamp immediately after the science exposures, and these internal flats were normalized through division by the extracted lamp spectrum, and corrected for non-uniform illumination of the slit by comparison to twilight sky and dome spectral flat fields. Wavelength calibration was obtained from NeArHgKr reference arc lamps, and a cubic fit to the centroids of arc lines for each CCD created a wavelength solution with rms residuals of 0.02 Å. The wavelength calibration was checked with the centroids of prominent sky lines. The spectrum was then rectified (straightening the sky lines), and sky subtraction was performed by a fifth-order polynomial fit to each rectified detector column (parallel to the slit), excluding from the fit those regions occupied by sources.
3 Results
3.1 The redshift of SMB03#3
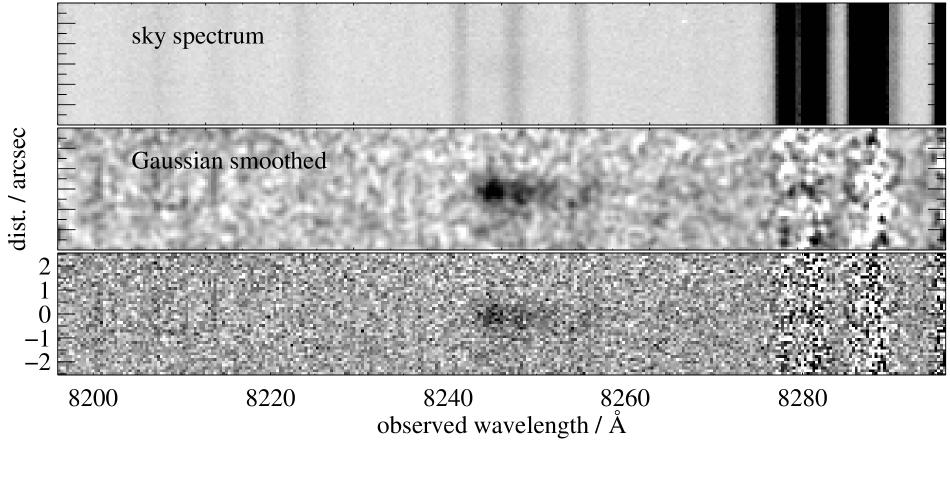
The combined 5.5-hours of DEIMOS spectroscopy showed a clear emission line detected at at the location in the slit corresponding to the expected position of galaxy SBM03#3. The peak of the line emission is at Å, and the integrated flux is within 30 per cent of , extracting over 17 pixels (2 arcsec) and measuring between the zero-power points ( Å). This is actually a lower limit on the line flux because of possible slit losses if the emission line is spatially extended, although this is probably negligible since the galaxy is very compact (Fig. 1). The flux measurement is consistent over both nights. The emission line is not seriously contaminated by residuals from strong OH lines but does straddle a weak complex of sky lines. Fig. 2 shows the combined 2-dimensional long-slit spectrum around this emission line.
Single-line redshifts are often open to question, but the most probable identification of this solo emission line is Lyman- 1215.8 Å at , given that this galaxy was pre-selected as an -drop to have a photometric redshift of . We briefly consider (and rule out) other possible redshift assignations. This line emission is extremely unlikely to be H 4861.3 Å or [O III] 5006.8,4958.9 Å at as we do not detect the other nearby lines in this complex. If this line emission were [O II] 3726.1,3728.9 Å at , we would expect to resolve comfortably the [O II] doublet with our spectral resolution of , as demonstrated by Davis et al. (2002) using DEIMOS in the same configuration. The most probable interpretation is that we are seeing Lyman- 1215.8 Å at . The only plausible alternative to high-redshift Lyman- is H 6562.8 Å at : however, the H interpretation would not produce the large flux decrement observed between the -band and -band. Hence we conclude that Lyman- emission at , associated with the -drop galaxy SBM03#3, is by far the most probable identification of the line (see Stern et al. 2000 for a discussion of one-line redshift determinations for high- galaxies).
3.2 Spectral Profile of the Lyman- Emission
The Lyman- line is clearly resolved spectrally at this resolution, with significant velocity structure evident (Fig. 2). There appears to be a weak second peak of emission slightly to the red of the main Lyman- emission, around 8256 Å, and there is more marginal evidence for narrow absorption at the core of the main emission line.

The spectral width of the Lyman- line is pixels FWHM, excluding second peak at 8256 Å. This is equivalent to a velocity width of after deconvolution with the instrumental width. The line width is similar to those of other galaxies (e.g., Rhoads et al. 2003; Kodaira et al. 2003; Lehnert & Bremer 2003). The Lyman- profile is asymmetric, with a pronounced red wing but a sharper decline in flux density on the blue side (Fig. 2). This appears to be a common feature in high- starbursts with Lyman- in emission (e.g., Dey et al. 1998; Lowenthal et al. 1997; Bunker, Moustakas & Davis 2000; Ellis et al. 2001), and is most likely due to an outflow of neutral hydrogen, where we only see the back-scattered Lyman- from the far side of the expanding nebula – only the photons on the red side of the resonant Lyman- emission-line profile can escape, with the blue wing being absorbed by neutral gas (within the galaxy and in the Lyman- forest). The P Cygni-like profile of Lyman- is consistent with this outflow model. Hence the profile of Lyman- is skewed to the red, so the systemic redshift determined from the peak of the emission may be overestimated. Near-infrared spectroscopy by Pettini et al. (2001) of the rest-frame optical forbidden lines and Balmer lines in galaxies shows a redshifting of the Lyman- relative to the nebular emission lines.
The velocity dispersion of inferred from the line-width of Lyman- is likely to be a lower limit, as the line profile is truncated. However, the velocity width of Lyman- cannot be reliably used to estimate the galaxy mass as it is unlikely to be representative of the true velocity dispersion, since resonant scattering will broaden the spectral profile of the escaping photons (e.g., Binette et al. 1993).
3.3 AGN or Starburst?
Careful inspection of the spectrum did not reveal any lines at other wavelengths in the same spatial location as the Lyman- emission. The only other significant line which should fall within our spectral coverage (although close to the gap between the CCDs) is the high-ionization rest-UV doublet N V 1238.8,1242.8 Å, which is usually prominent in active galactic nuclei (AGN). Our flux limits at 8402 & 8429 Å are (), conservatively assuming the lines are extended and that half the light is lost in gap between the CCDs at Å. Our lower limit of () compares with the typical line ratios from composite QSO spectra of (Osterbrock 1989). Hence, the non-detection of N V 1240 Å favours the interpretation that the Lyman- arises from the Lyman continuum flux produced by OB stars, rather than the harder UV spectrum of a QSO. The velocity width of Lyman- ( FWHM) is also significantly narrower than seen in the broad-line regions of AGN, even after correcting for the self-absorbed blue wing (§ 3.2), again suggesting a starburst rather than an AGN. SBM03#3 is undetected in the Chandra X-ray map of the CDF-S (Giacconi et al. 2002) to limits of and in the soft (0.5–2 keV) and hard (2–10 keV) X-ray bands respectively. We note that several other Lyman- emitters at high redshift are also undetected in X-rays (Malhota et al. 2003).
3.4 Continuum Shape and Lyman- Equivalent Width
We do not have a significant detection of the the continuum in the Keck/DEIMOS spectroscopy, but the flux measurement of from the HST/ACS F850LP -band image –which encompasses the redshifted Lyman- line at its blue end– enables us to determine the equivalent width of this line and the continuum flux density ( at Å, where we assume and throughout). The emission line has a luminosity and accounts for only per cent of the -band flux and per cent of the -band flux, and once the effect of this line contamination of the broad-band magnitudes is removed, the equivalent width of the line is Å in the observed frame, assuming that there is negligible continuum flux below 8245 Å (short-ward of Å, the Lyman- line) due to absorption by the Lyman- forest.
The rest-frame equivalent width at is Å which is within the realm of what is observed in in star forming galaxies. From stellar synthesis models of star-forming regions (e.g., Charlot & Fall 1993), the theoretical Lyman- equivalent width for a young region of active star formation is Å. However, the observed Lyman- emission from star-forming galaxies is invariably much weaker, typically Å (e.g., Steidel et al. 1996; Warren & Møller 1996), or even in absorption. The rest-frame equivalent width for SBM03#3 lies at the upper end of this observed range and is similar to the narrow-band selected galaxies at (Hu, McMahon & Cowie 1999; Hu et al. 2002; Kodaira et al. 2003).
From the -band, the UV continuum implies an unobscured star formation rate of (Stanway, Bunker & McMahon 2003). The star formation rate inferred from the Lyman- emission would be times less than this, probably due to selective extinction of this line through resonant scattering. SBM03#3 has the highest UV luminosity (i.e., the largest unobscured star formation rate) of any starburst yet found at .
We obtained 10 ksec of near-infrared imaging with a filter (, equivalent to Å) using the WIRC camera on the Las Campanas 2.5-m du Pont telescope on the night of 2003 February 20 U.T. The seeing was 0.7 arcsec, oversampled by the 0.1 arcsec pixels of the Rockwell HgCdTe array. The galaxy SBM03#3 was undetected, with a limiting magnitude of (Vega magnitudes). If the spectrum long-ward of Lyman- is a power law, we can contrain the slope to be (where ) from ().
Knowing the redshift and the contamination of the broad-band magnitudes by the line emission, the continuum depression as inferred from the colour may be used to make a direct estimate of , the absorption due to intervening cosmological H I clouds at . Outflowing neutral hydrogen intrinsic to the source may also play a significant role in absorbing the blue-wing of Lyman-. Formally, the continuum break (Oke & Korycansky 1982) is defined as
| (1) |
(e.g., Schneider, Schmidt & Gunn 1991; Madau 1995). The HST/ACS F775W -band samples the rest-frame at Å, and the measured magnitude is (Stanway, Bunker & McMahon 2003). After correcting for the fraction of the - and -filters which lie above the redshifted 1216 Å break, we calculate assuming an intrinsic spectral shape of , the average for the Lyman break galaxies (Meurer et al. 1997). This is consistent with the values derived from SDSS quasars at similar redshifts by Fan et al. (2001).
3.5 The size of SBM03#3
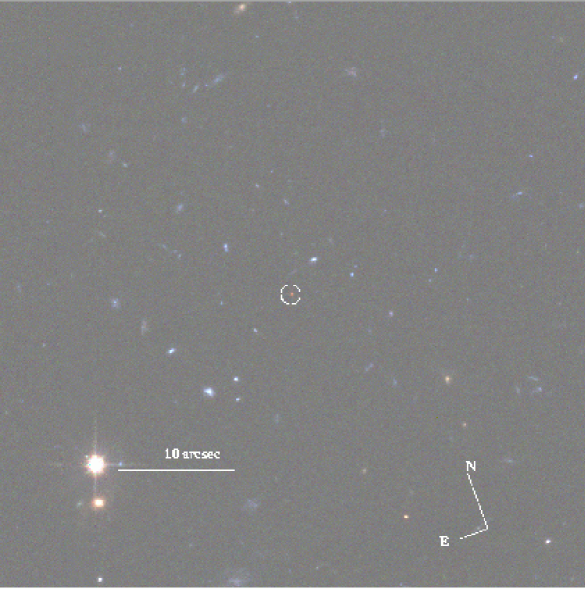
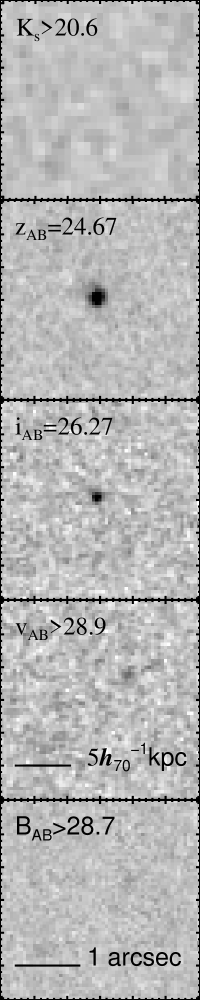
The galaxy SBM03#3 is very compact in the HST images (Fig. 1) – in the highest S/N ACS -image it is only marginally resolved with a half-light radius of arcsec (Stanway, Bunker & McMahon 2003), compared to arcsec for unsaturated stars in the ACS image. Hence, the half-light radius of the star-forming region at must be kpc. This is very compact, and corresponds the the physical size of dwarf spheroidals at lower redshift. SBM03#3 is more compact than typical Lyman-break galaxies at : Lowenthal et al. (1997) find a median kpc and a range kpc. We have also compared the spatial extent of the line emission with a cross-cut of an alignment star in the same slitmask (i.e., identical seeing and airmass): the Lyman- line has a very compact spatial extent, unresolved in arcsec FWHM seeing, so this seems not to be one of the cases where the Lyman- emission line morphology is significantly more extended than the continuum (e.g., Steidel et al. 2000; Bunker, Moustakas & Davis 2000).
4 Conclusions
We have obtained deep spectroscopy with Keck/DEIMOS of SBM03#3, an -drop in the Chandra Deep Field-South photometrically-selected from HST/ACS images to lie at . We discover a single emission line with peak intensity at 8245 Å, consistent with Lyman- emission form a galaxy at . The spectrally-resolved profile of the emission line is asymmetric (as high- Lyman- tends to be) with a P Cygni-like profile and a sharp cut-off on the blue wing. The line flux is . The equivalent width inferred from the -band photometry from HST/ACS is Å , which is within the range seen in high- star-forming galaxies. The galaxy is undetected in X-rays by Chandra, and the velocity width of the Lyman- is comparatively narrow () and we do not detect the high-ionization line N V 1240 Å, all of which support the view that this line emission is powered by star formation rather than an AGN. Our spectroscopic redshift for this object confirms the validity of the -drop selection technique of Stanway, Bunker & McMahon (2003) to select star-forming galaxies at .
The relatively bright rest-frame UV continuum flux and Lyman- line luminosity of SBM03#3 and the recent WMAP results which indicate the epoch of reionization to lie at (Kogut et al. 2003) bodes well for searches for UV luminous star-forming galaxies at such as those which will be possible using the narrow-band near-IR imaging system DAZLE (the Dark Ages ‘Z’ Lyman Explorer; McMahon et al. in preparation), HST/WFC3 and NGST.
Acknowledgements
We are extremely grateful for the help and support we received while observing at Keck, and in particular thank Greg Wirth, Bob Goodrich and Chuck Sorenson. We used Drew Phillips’ extremely useful “dsimulator” software for slitmask design. We have had useful discussions on the reduction of optical slitmask spectroscopy with Daniel Stern, Adam Stanford and Alison Coil. Some of the data presented herein were obtained at the W. M. Keck Observatory, which is operated as a scientific partnership among the California Institute of Technology, the University of California and the National Aeronautics and Space Administration. The Observatory was made possible by the generous financial support of the W. M. Keck Foundation. This paper is based on observations made with the NASA/ESA Hubble Space Telescope, obtained from the Data Archive at the Space Telescope Science Institute, which is operated by the Association of Universities for Research in Astronomy, Inc., under NASA contract NAS 5-26555. We are grateful to the GOODS team for making their reduced images public. ERS acknowledges a Particle Physics and Astronomy Research Council (PPARC) studentship supporting this study.
References
- [Binette et al. 1993] Binette, L., Wang, J. C. L., Zuo, L., Magris C. G. 1993, AJ, 105, 797
- [Bunker, Moustakas & Davis 2000] Bunker, A. J., Moustakas, L. A., Davis, M. 2000, ApJ, 531, 95
- [Charlot & Fall 1993] Charlot, S., Fall, S. M. 1993, ApJ, 415, 580
- [Davis et al. 2002] Davis, M., et al. 2002, preprint (astro-ph/0209419)
- [Dey et al. 1998] Dey, A., Spinrad, H., Stern, D., Graham, J. R., Chaffee, F. H. 1998, ApJ, 498, L93
- [Dickinson & Giavalisco 2002] Dickinson, M., Giavalisco, M. 2002, in Bender, R., Renzini, A., eds., ESO Astrophysics Symposia Series, “The Mass of Galaxies at Low and High Redshift”, Springer-Verlag, Berlin, p. 324
- [Ellis et al. 2001] Ellis, R., Santos, M. R., Kneib, J.-P., Kuijken, K. 2001, ApJ, 560, L119
- [Fan 2001] Fan, X., et al. 2001, AJ, 122, 2833
- [Ford et al. 2002] Ford, H. C, et al. 2002, BAAS, 200.2401
- [Giacconi et al. 2002] Giacconi, R., et al. 2002, ApJS, 139, 369
- [Hu, McMahon & Cowie 1999] Hu, E. M., McMahon, R. G., Cowie, L. L. 1999, ApJ, 522, L9
- [Hu et al. 2002] Hu, E. M., Cowie, L. L., McMahon, R. G., Capak, P., Iwamuro, F., Kneib, J.-P., Maihara, T., Motohara, K., 2002, ApJ, 568, L75
- [Kodaira et al. 2003] Kodaira, K., et al. 2003, PASJ, 55, L17
- [Kogut et al. 2003] Kogut, A., et al. 2003, preprint (astro-ph/0302213)
- [Lehnert & Bremer 2003] Lehnert, M. D., Bremer, M. 2003, preprint (astro-ph/0212431)
- [Lowenthal et al. 1997] Lowenthal, J. D, Koo, D. C., Guzman, R., Gallego, J., Phillips, A. C., Faber, S. M., Vogt, N. P., Illingworth, G. D., Gronwall, C. 1997, ApJ, 481, 673
- [Madau 1995] Madau, P. 1995, ApJ, 441, 18
- [Massey et al. 1988] Massey, P., Strobel, K., Barnes, J. V., Anderson, E. 1988, ApJ, 328, 315
- [Massey & Gronwall 1990] Massey, P., Gronwall, C. 1990, ApJ, 358, 344
- [Malhotra 2003] Malhotra, S., Wang, J. X., Rhoads, J. E., Heckman, T. M., Norman, C. 2003, ApJ, 585, L25
- [Meurer et al. 1997] Meurer G, R., Heckman T. M., Lehnert M. D., Leitherer C., Lowenthal J. 1997, AJ, 114, 54
- [Oke & Korycansky 1982] Oke, J. B., Korycansky, D. G. 1982, ApJ, 255, 11
- [Osterbrock 1989] Osterbrock, D. E. 1989, “Astrophysics of Gaseous Nebulæ and Active Galactic Nuclei”, University Science Books
- [Pettini 2001] Pettini, M., Shapley, A., Steidel, C. C., Cuby, J.-G.Dickinson, M., Moorwood, A. F. M., Adelberger, K. L., Giavalisco, M. 2001, ApJ, 554, 981
- [Phillips et al. 2002] Phillips, A. C., Faber, S., Kibrick, R., Wallace, V., DEIMOS Team 2002, BAAS, 203, 137.02
- [Rhoads et al. 2003] Rhoads, J. E., Dey, A., Malhotra, S., Stern, D., Spinrad, H., Jannuzi, B. T., Dawson, S., Brown, M. J. I., Landes, E. 2003, AJ, 125, 1006
- [Schneider, Schmidt, & Gunn 1991] Schneider, D. P., Schmidt, M., Gunn, J. E. 1991, AJ, 101, 2004
- [Stanway, Bunker & McMahon 2003] Stanway, E. R., Bunker, A. J., McMahon, R. G. 2003, MNRAS, 342, 439
- [Steidel. Pettini & Hamilton 1995] Steidel, C. C., Pettini, M., Hamilton, D. 1995, AJ, 110, 2519
- [Steidel et al. 1996] Steidel, C. C., Giavalisco, M., Pettini, M., Dickinson, M. E., Adelberger, K. L. 1996, ApJL, 462, 17
- [Steidel et al. 1999] Steidel, C. C., Adelberger, K. L., Giavalisco, M., Dickinson, M. E., Pettini, M. 1999, ApJ, 519, 1
- [Steidel et al. 2000] Steidel, C. C., Adelberger, K. L., Shapley, A., Pettini, M., Dickinson, M. E., Giavalisco, M. 2000, ApJ, 532, 170
- [Stern et al. 2000] Stern, D., Bunker, A., Spinrad, H., Dey, A. 2000, ApJ, 537, 73
- [Warren & Møller 1996] Warren, S. J., Møller, P. 1996, A&A, 311, 25