The 3-D kinematics of water masers around the semiregular variable RT Virginis
Abstract
We report observations of water masers around the semiregular variable RT Virginis (RT Vir), which have been made with the Very Long Baseline Array (VLBA) of the National Radio Astronomy Observatory (NRAO) at five epochs, each separated by three weeks of time. We detected about 60 maser features at each epoch. Overall, 61 features, detected at least twice, were tracked by their radial velocities and proper motions. The 3-D maser kinematics exhibited a circumstellar envelope that is expanding roughly spherically with a velocity of 8 km s-1. Asymmetries in both the spatial and velocity distributions of the maser features were found in the envelope, but less significant than that found in other semiregular variables. Systematic radial-velocity drifts of individual maser features were found with amplitudes of 2 km s-1yr-1. For one maser feature, we found a quadratic position shift with time along a straight line on the sky. This apparent motion indicates an acceleration with an amplitude of 33 km s-1yr-1, implying the passage of a shock wave driven by the stellar pulsation of RT Vir. The acceleration motion is likely seen only on the sky plane because of a large velocity gradient formed in the accelerating maser region. We estimated the distance to RT Vir to be about 220 pc on the basis of both the statistical parallax and model-fitting methods for the maser kinematics.
1 Introduction
Understanding the dynamics of mass loss flows in circumstellar envelopes of evolved stars is one of the most important areas of research in the overall mass devolution of stars and the cycling of the interstellar medium. Fundamentally, material on the surface of an evolved star gets colder and forms dust while it is moving into interstellar space. The newly formed dust is accelerated by the stellar radiative pressure and forms an expanding envelope. However, such processes are complicated because the related phenomena occur in a dynamically and physically unstable region. Maser emission produced from silicon monoxide (SiO), water vapor (H2O), and hydroxyl (OH) molecules are commonly found in many circumstellar envelopes (e.g., Reid & Moran 1981; Elitzur 1992). Because of the compactness (down to 0.1 AU) of individual maser features, or probably physical gas clumps (e.g., Colomer et al. 1992; Imai et al. 1997), they are good tracers for investigating the kinematics of the envelopes using very long baseline interferometry (VLBI). Multi-epoch observations of SiO masers around Mira variables, which are located closer to a stellar surface than other masers, using the Very Long Baseline Array (VLBA) suggest that circumstellar envelopes of Mira variables are not necessarily spherically symmetric, very likely due to anisotropic mass ejection on the stellar surface (e.g., Diamond & Kemball 1999). On the other hand, shock waves are also expected simultaneously, which are driven by the periodic variation in stellar radiative pressure to the dust in the envelopes. These shock waves caused by stellar pulsation are formed near the stellar surface and transported to larger distances from the star.
The gas dynamics of circumstellar envelopes can also be studied with multi-epoch observations of water masers with VLBI. The dynamical change of the envelope due to stellar pulsation is not so significant (10%) in the near-vicinity of stellar surface, a so-called ”radio atmosphere” and a ”molecular atmosphere” (Reid & Menten, 1997). In fact, the amplitude of the expansion and contraction motions seen in SiO masers in this region is small (10-20%, Diamond & Kemball 1999). On the other hand, in the outer region (1000 K) where water masers are excited, dust formation starts and shock waves are enhanced due to dust-induced radiative pressure (e.g., Höfner, Feuchtinger, & Dorfi et al. 1995). A shock wave is expected to produce rapid velocity changes (acceleration/deceleration) by up to 10 km s-1 in front and in back of it, these will be directly detected as radial-velocity drifts and proper motions deviating from a constant velocity motion. The present VLBI technology enables us to detect such acceleration/deceleration motions with an accuracy of 10 microarcseconds (as) in position and of 0.1 km s-1 in radial velocity. Such trials have recently started (e.g., Ishitsuka et al. 2001, hereafter I01). Water masers are also good tools to directly estimate the distances to evolved stars using knowledge of their 3-D velocity vectors (radial velocities and proper motions), a method which does not rely on the standard distance ladder methods (Marvel, 1997). Distance estimation with water maser data will be applicable to distance measurements for many evolved stars invisible at optical wavelengths after examining the reliability and comparing with other methods.
Here we present the 3-D motions and the radial-velocity drifts of water masers associated with the semiregular variable star RT Virginis (RT Vir), which have been measured from VLBA data. RT Vir is one of the brightest water maser sources (e.g., Bowers & Johnston 1994, hereafter BJ; Yates & Cohen 1994, hereafter YC; Richards et al. 1999a, hereafter RCBY; Yates et al. 2000, hereafter YRGB). The period of stellar pulsation of RT Vir has been estimated to be 155 d with some irregularity (e.g., Kholopov et al. 1985; Etoka et al. 2001). Imai et al. (1997) (hereafter Paper I) found another pulsation period of 375 d using data obtained by the American Association of Variable Star Observation (AAVSO). Radial-velocity drifts of the water masers, with time, have been found from VLBI observations (Paper I), however, the origin of the drifts and the true maser kinematics are not yet clear because of insufficient angular resolution and a small amount of proper motion data (c.f., RCBY; YRGB).
Section 2 describes the VLBI observations and data reduction. Section 3 summarizes the revealed 3-D kinematics of the water masers and the detection of acceleration of one maser feature in its proper motion. Section 4 discusses the dynamics of the circumstellar envelope of RT Vir, which exhibits acceleration. Measurements of the distance to RT Vir are also mentioned there.
2 Observations and Data Reduction
The monitoring observations of water masers around RT Vir with the VLBA have been made at five epochs during 1998 May–August, with a separation of 3 weeks between the successive two epochs. Table 1 summarizes the status of the observations. Each of the observations had a duration of 4 hrs including scans towards RT Vir and the calibrator 3C 273B for clock offset and complex-bandpass calibration. The received signals were recorded with one base-band channel (BBC) with a center velocity at 17.0 km s-1 and a bandwidth of 4 MHz in dual circular polarization mode. The correlated data were processed with 1024 velocity channels and a velocity spacing of 0.056 km s-1 in each channel at 22.24 GHz.
The procedures in data reduction using NRAO’s AIPS and maser position measurement we have applied were almost the same as those presented in section 2.2 of Imai et al. (2000) and section 3.1 of Imai, Deguchi, & Sasao (2002) (hereafter Paper III), respectively. In the present work, the complex bandpass characteristics were obtained from data on 3C 273B with an uncertainty of less than 1° in phase. For amplitude calibration, we applied a template spectrum of the water maser emission obtained from the auto-correlation data. The velocity channel at 17.1 km s-1 was selected as reference for fringe fitting and self-calibration (see table 1). The naturally weighted visibility data created a synthesized beam of 0.41 mas 0.94 mas with a position angle of 7°.6. The detection limit was typically 200 mJy beam-1 at a 5- noise level in maps without bright maser emission. The positional accuracy for a maser feature was limited typically to 50 as mainly because of the extended structure of the feature.
3 Results
3.1 Proper Motions of Water Maser Features
The water masers in RT Vir were spatially well resolved into individual maser features with the VLBA synthesized beam. Each maser feature is composed of a compact (1 AU) bright part and an extended structure. As a result, about 60 maser features have been detected at every observation. Table 1 shows the numbers of maser features detected at individual epochs. Previous observations with larger synthesized beams (Paper I; RCBY; YRGB) may not be able to distinguish some of individual maser features because of the crowded distribution of maser features in the beam.
We traced the position and radial velocity of each maser feature, which had been stable from one epoch to another within 1 km s-1 in radial velocity and 0.5 mas in position. We also checked the stability of spatial patterns of the maser feature (alignment of velocity components or spots, Paper III). A total of 60 maser features were detected at least twice and their relative proper motions and radial-velocity drifts were measured. Table 2 lists measured proper motions and radial-velocity drifts of maser features. The estimation of uncertainty in proper motion takes into account the apparent sizes of the maser features. Only 36 of the maser features were detected at least three times, indicating that individual maser features turn on and off on a time scale of typically 1–2 months. RCBY and YRGB reported maser proper motions of up to 3 mas in 70 days in the year 1996, the values were slightly larger than those measured in the present paper (typically 1–2 mas in 80 days in the year 1998).
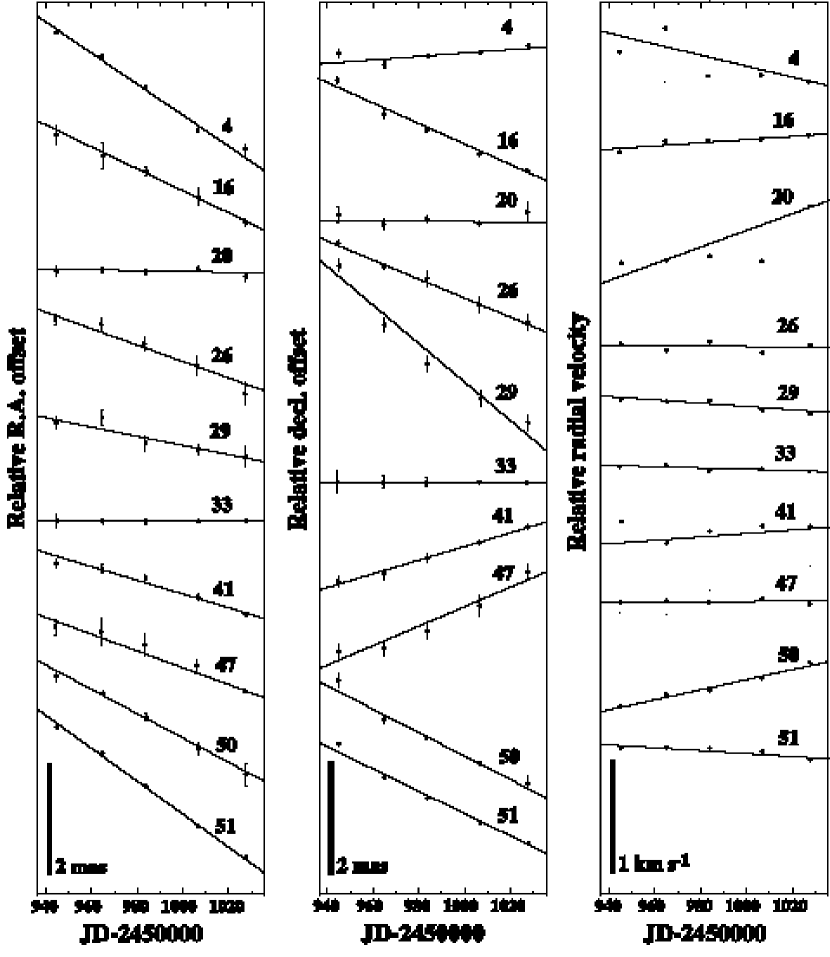
Figure 1 shows changes in positions and radial velocities of maser features detected five times. One can find jumps in positions and radial velocities within the above stability criteria in some maser features (e.g. RT Vir:I2002 20). These maser features were blended with nearby (closer than 0.5 mas) maser features, for which it was difficult to exactly trace their velocities and positions. On the other hand, we found not only proper motions that were well fit by a constant-velocity motion but also exhibited linear radial-velocity drifts in some features. We also found an acceleration motion for a feature in its proper motion, which is described in detail in section 3.3.
3.2 The 3-D Kinematics of the RT Vir flow
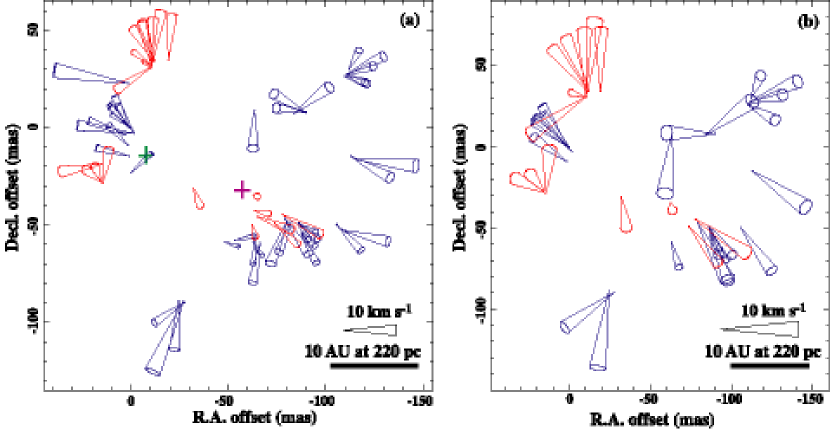
Figure 3 shows the angular distribution and the 3-D motions of maser features. The features exhibit an elongation in their spatial distribution and a radial-velocity gradient in the east–west direction, which have been visible in previous observations (Bowers, Claussen, & Johnston 1993; BJ; YC; Paper I; RCBY; YRGB). The 3-D maser kinematics clearly exhibits an expanding flow, not rotation. The kinematic flow looks clearer when including in the diagram the 60 maser features detected at least twice than when only including 36 features detected at least three times. Because of the crowded distribution of maser features and very short lifetimes of maser features, misidentification of feature motions should be taken into account especially for the features detected only twice. We made further analyses, however, using all of the proper motion data in the present paper.
3.2.1 Analysis based on the velocity variance-covariance matrix
We performed analysis based on diagonalization of the variance–covariance matrix (VVCM) of our obtained maser velocity vectors (Bloemhof 2000; I01). The velocity dispersions used in the VVCM analysis are the quantities directly determined by a proper motion measurement that lacks the absolute position reference. The VVCM diagonalization is done by obtaining eigenvectors and eigenvalues for the VVCM, which correspond to the kinematic axes of the flow and velocity dispersions along the axes, respectively. Thus, the VVCM analysis is an objective and model-independent method. The diagonalized VVCM was as follows,
| (1) |
where is a variance () or a covariance () of measured maser motions in the - and -axes (, , or ) in unit of km2s-2. To estimate uncertainties of the obtained values, we also performed a Monte Carlo simulation generating VVCMs with artificial errors around the values obtained in the measurement. The eigenvector corresponding to the largest eigenvalue (velocity dispersion) had an inclination of 24°.74°.6 with respect to the sky plane and a position angle of 35°.814°.9, which is roughly parallel to both of the directions of the elongation and the velocity gradient mentioned above. This implies the bipolarity of the RT Vir flow, but is not so significant, since the velocity dispersion is roughly equal in all directions; a ratio of the eigenvalue was 2.47: 1.67: 1 (c.f., the ratio of 6.1: 2.0: 1 in R Crt, I01).
3.2.2 Model fitting for the maser kinematics
We also made a least-squares model-fitting analysis assuming a spherically expanding flow model, details of which have already been described in Imai et al. (2000) (c.f. Gwinn, Moran, & Reid 1992). We used weights proportional to the square of the accuracy of a measured proper motion.
First, we adopted radial expansion motions of masers with independent speeds and estimated only a systemic bulk motion, or the motion of the star, and a location of the star as free parameters. Then, we also estimated a distance to RT Vir and the velocity field of the radial expansion. In the present paper, we assumed the speed of the radial expansion of a maser feature i, , as a function of the distance to a maser feature from the origin of the outflow, , which is expressed as
| (2) |
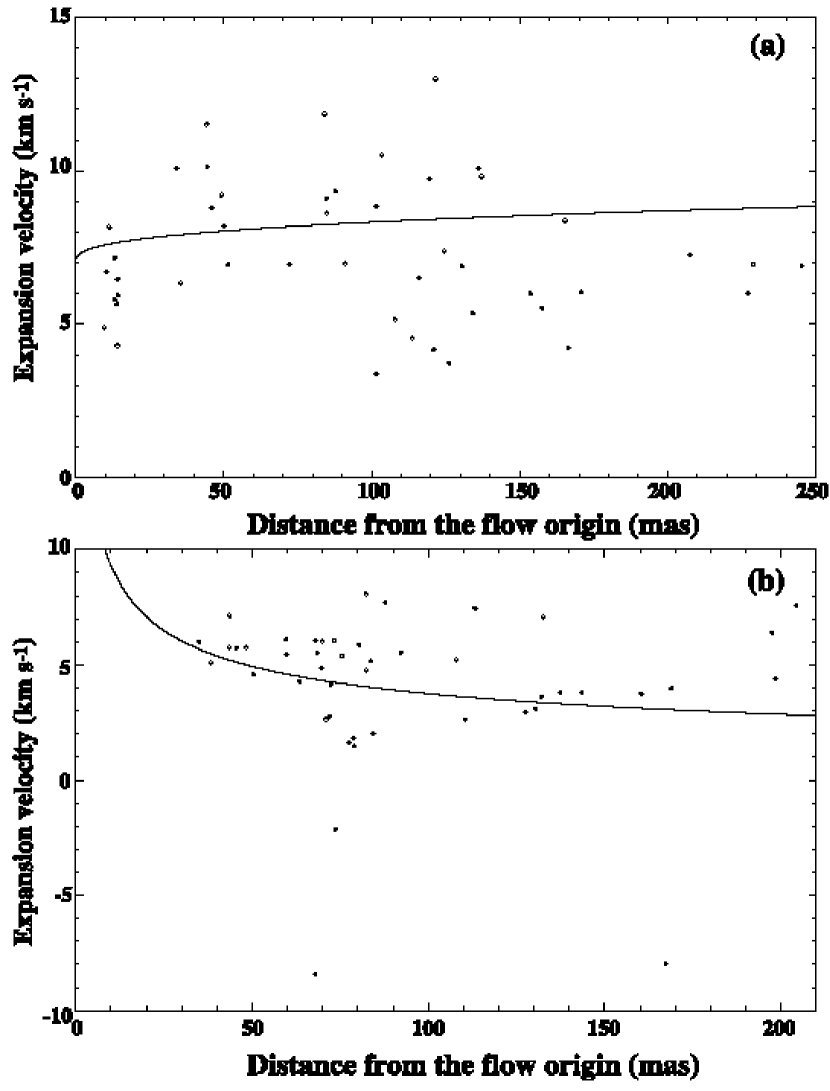
where is the intrinsic velocity at the stellar surface, the velocity at a unit distance , the power-law index indicating the apparent acceleration of the flow. We applied the fitting technique step-by-step, excluding maser features with unreliably large distances from the outflow origin (0″.3 or 66 AU at 220 pc). Table 3 shows the best solutions obtained in the analyses. Figure 3 shows the distribution of features with expanding velocities obtained using equation (10) of Imai et al. (2000) versus distances from the estimated position of the central star.
Through this procedure, we found that several maser features had negative expansion velocities or infall motions towards the star (see also figure 3). Although some of the features were detected at least at three epochs, it is still unclear whether they were tracing actual physical motions. When including these infalling maser features, the best-fit function indicates a slow (5 km s-1) expansion of the flow with marginal deceleration (figure 3b). These are inconsistent with the suggestion that the RT Vir flow has an expansion velocity 10 km s-1 in the water maser region and radial acceleration toward the outer OH maser region (RCBY). The estimated position of the star is roughly at the center of the whole maser distribution but slightly biased toward clusters of the blue-shifted maser features located at the south-west of the whole region. The estimated position of the expansion center or the star is located close to the center of the ”ring” found in the maser distribution. No maser feature is located within 30 mas ( 7 AU) from the star, indicating a ”quenching zone” of water maser emission (YC).
On the other hand, when excluding the maser features exhibiting infall, a higher expansion velocity 8 km s-1 was obtained. The estimated location of the star is very close to blue-shifted clusters of maser features. We could not find converging solutions in which the stellar position is close to the center of the ring mentioned above. Thus, the spatial distribution of the masers is expected to be significantly asymmetric (see also figure 3). This is consistent with the estimation by BJ. Maser features apparently spread out to 200 mas (45 AU) from the star (see also figure 3), which is larger by a factor of 2–3 than that previously estimated (Bowers, Claussen, & Johnston 1993; BJ; YC). The size of the maser-quenching zone is reduced to 10 mas (2 AU). The estimated systemic radial velocity of the star also has an offset of 3 km s-1 from the value adopted by above previous papers.
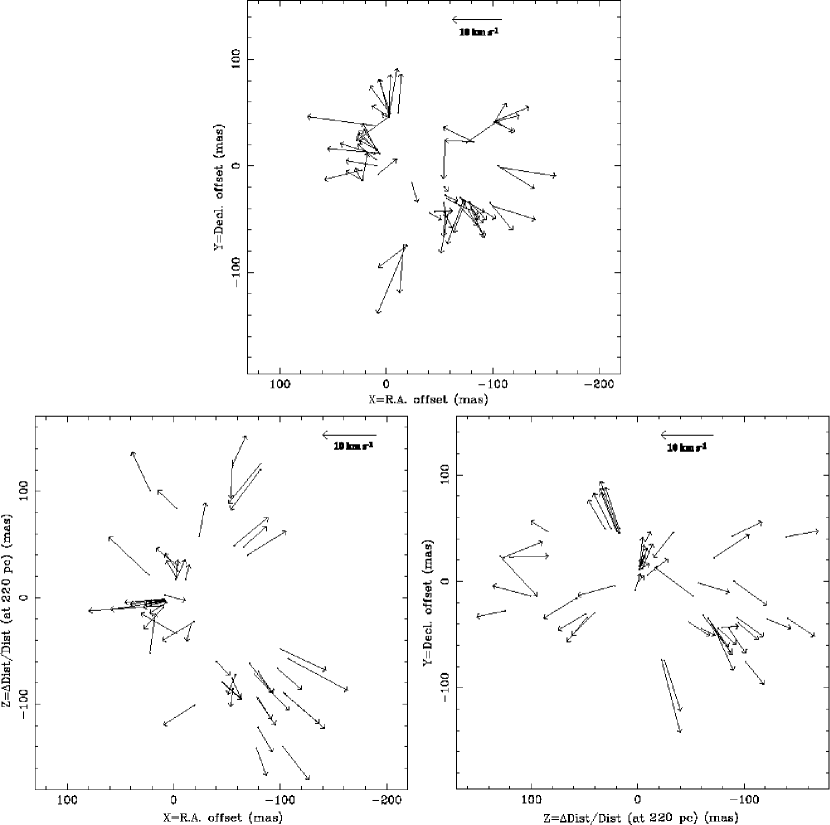
Figure 4 shows the estimated 3-D spatio-kinematics of the water masers projected in three directions. Most of the maser features exhibit radial expansion without rotation around the star at the diagram origin. Contrary to the asymmetric spatial distribution of maser features, asymmetry in the velocity field is not seen; maser features seem to have only a bias in the spatial distribution. Thus, the kinematics of the RT Vir flow is well expressed by a radially expanding flow (c.f., Paper I; RCBY; YRGB) and the radial-velocity gradient in the east-west direction should be due to the bipolarity of the flow but with weak collimation.
3.3 Acceleration motions found in water maser features
We have measured radial-velocity drifts of individual maser features by measuring a radial velocity at the brightness peak of each maser feature in the same manner as that in Paper III. Because we measured the velocities with accuracy better than a velocity channel spacing of 0.056 km s-1, the uncertainties of the velocity drift rates were calculated by assuming a measurement error to be equal to this value. The uncertainties were as small as 0.3 km s-1yr-1 in the best case. Table 2 gives the measured radial velocity drifts of maser features. Figure 1 presents time variations in radial velocities of individual maser features with longer lifetimes.
The changes in radial velocity are usually less than the velocity widths of maser features (0.5–2.0 km s-1, see table 2) and likely to be affected by temporal changes in spatial and velocity structures of maser features with time. Gwinn (1994) pointed out that the observed line width is likely affected by the subsonic bulk motions within the feature (0.5 km s-1) and the different hyperfine transitions of the H2O line (but negligible). Because the two effects will also affect the radial-velocity drift measurements, the velocity variations larger than 0.5 km s-1 can be taken into account as possible accelerations.
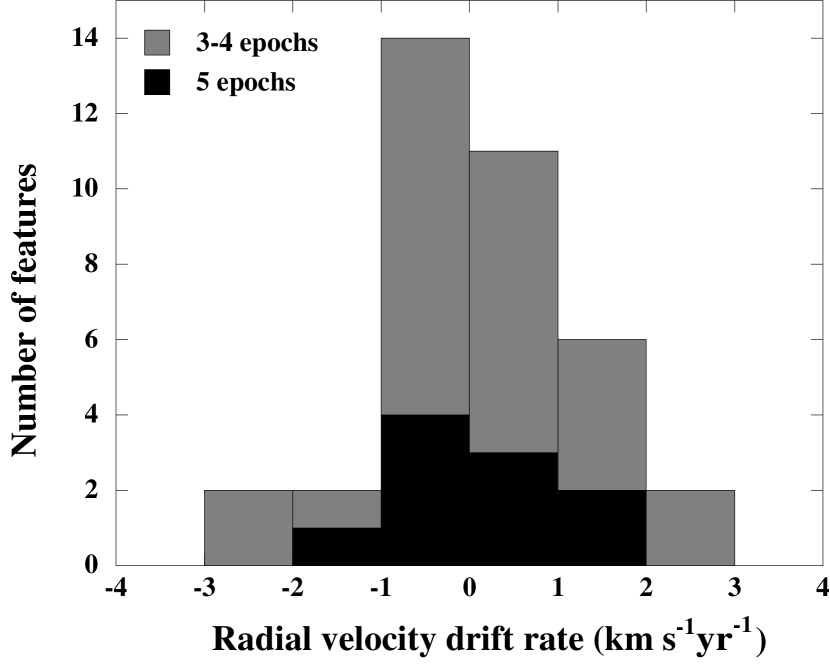
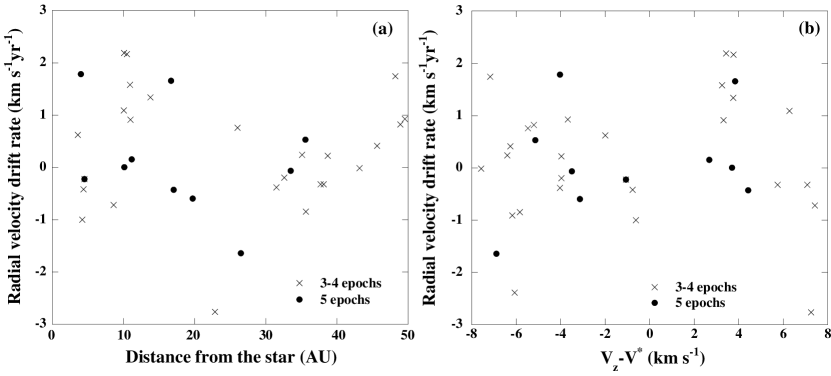
Nevertheless, some of the maser features changed their velocities with time at constant rates, or constant accelerations. Figure 6 shows the histogram of the measured radial-velocity rates. The drift rates of these features are equal to or smaller than 1 km s-1yr-1 and quite similar to those that have been commonly detected for 15 yrs with single-dish observations (Lekht et al., 1999). Maser features with larger drift rates (2 km s-1yr-1) exhibit jumps in velocities, which are likely due to blending of a few very close by maser features as mentioned in section 3.1. Such large velocity drifts were also found in some maser features detected in less than four epochs. Thus, radial-velocity drifts around 1 km s-1yr-1 come from single maser features and may indicate acceleration/deceleration of the features. Previous VLBI observations (Paper I; I01) have also detected such systematic radial-velocity drifts in a small number of maser features. We did not find, however, a correlation between radial-velocity and acceleration (see figure 6).
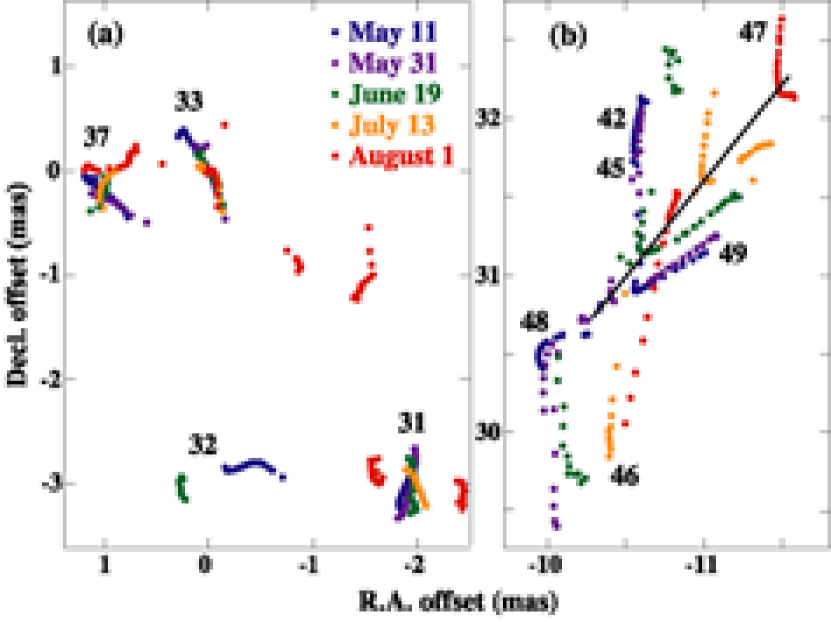
We have also looked for maser features exhibiting acceleration/deceleration motions in their proper motions. Similar to measurements of the radial-velocity drifts, we traced positions of brightest peaks of individual maser features. The method to define the feature position was described in Paper III. Note that flux-weighted positions (e.g., Marvel 1997) are often affected by extended and weak velocity components. Figure 7a shows the time variation in spatial structures of the position-reference feature (RT Vir 2002I: 33) and the adjacent features. We find that the reference feature has changed in spatial structure from one epoch to another. Most of the maser features had similar variation in their internal structures, which makes it more difficult to judge whether an apparent acceleration motion really reflects a true one or a physical motion of the maser cloud. Because VLBI observations lose the absolute position coordinate, we can not calibrate the change in spatial structure of the reference feature for the proper motion measurements. Assuming that this change is coming from the subsonic bulk motions within the feature mentioned above, an uncertainty of 0.5 km s-1 (0.5 mas yr-1) likely contaminates the measured relative proper motions of other maser features.
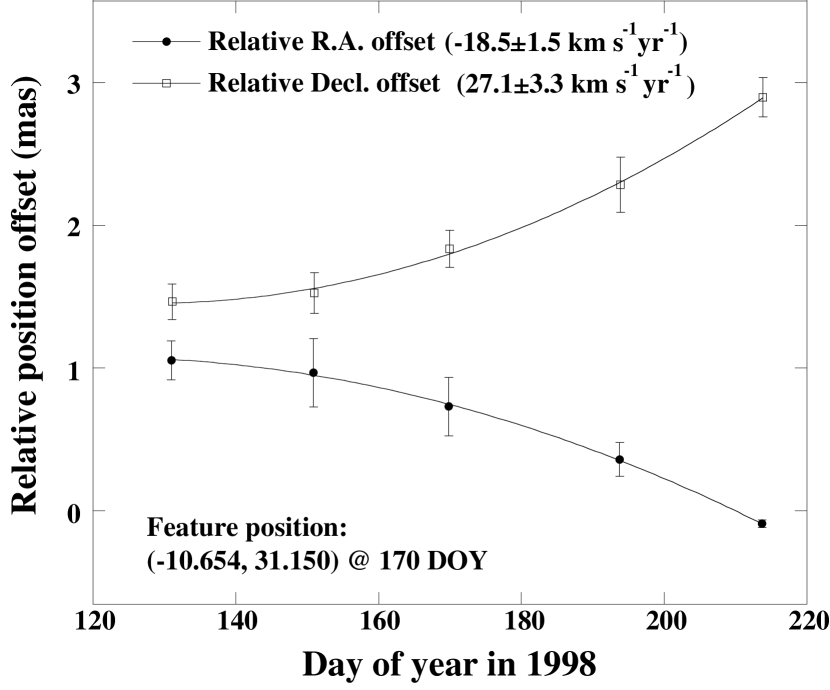
Nevertheless, we found a maser feature candidate that may exhibit a true acceleration motion, in which the feature moved by a distance much larger than the size of the feature itself. Figure 7b shows the time variation of the candidate, RT Vir 2002I: 47, and the adjacent features. Figure 8 shows the trajectory of the candidate and a model, which adopts a constant acceleration and is fitted well to the observed trajectory. The acceleration vector ([18.5, 27.1] in units of km s-1yr-1) has a position angle of (34°, which is roughly parallel to the mean proper motion vector ([2.2, 10.4] in unit of km s-1, subtracting the mean proper motion shown in table 3) with a position angle of 12° and the position vector ([2, 46] in unit of mas) with a position angle of 2°. The measured acceleration motion vector is a relative one with respect to that of the reference feature, or we are measuring it in the frame in which the reference feature has a constant velocity motion. Expecting spherically symmetric acceleration motions in the features RT Vir 2002I: 47 and 33 with respect to the central star, the relative acceleration vector would be closer to the proper motion vector of the feature RT Vir 2002I: 47. Adopting this acceleration, the feature increased in speed from 1 km s-1 to 16 km s-1.
Note that the apparent acceleration of the feature was seen only on the sky plane (33 km s-1yr-1), but not along the line-of-sight (0.1 km s-1yr-1). Other maser features also exhibited apparently rapid acceleration motions on the sky plane but much smaller ones along the line-of-sight as mentioned above (3 km s-1yr-1).
4 Discussion
4.1 Stellar position in the H2O maser distribution
The stellar position of RT Vir in the circmstellar envelope has been estimated in several manners based on the maser maps or position-velocity diagrams. All of the results suggest that the star is close to the center of the H2O maser distribution or the middle between the blue-shifted and red-shifted clusters of maser features (e.g., Bowers, Claussen, & Johnston 1993; YRGB). YC and Bains et al. (2002) found a ”quenching zone”, within which no maser emission is found. Reid & Menten (1990) found that a radio continuum source from the semiregular variable W Hya is located at the center of a ”ring” found in the H2O maser distribution.
On the other hand, the dynamical center of the expanding flow estimated in the present paper has a large offset (40 mas) over the uncertainty in the model fitting (see table 3). The stellar position can be examined by simultaneously making proper motion measurements such as those in the present paper and observations of the radio continuum source of RT Vir such as that made by Reid & Menten (1990). It is expected that the asymmetry of the 3-D distribution of maser features (see figure 4) derived a bias in the model fitting. Long-term observations, over several years, will reduce such distribution asymmetry.
4.2 Distance to RT Vir
The estimation of the distance to RT Vir has been made with several methods: a trigonometric parallax with the HIPPARCOS satellite (140 pc) and bolometric distance assuming a P-L relation (120–360 pc, e.q., BJ; YC; Yuasa & Unno 1999). In the present paper, we made the distance estimation on the basis of the 3-D kinematics of the RT Vir water masers using both, the statistical parallax and the model-fitting methods. As described in section 3.2.1, the feasibility of these methods was examined by the objective analysis using VVCM, which shows no rotation or other peculiar motion in the velocity field (see also figure 6). In the model-fitting method, the detail of which has already been described in section 3.2.2 and table 3, we obtained distance values of 22616 pc in the analysis using only maser features exhibiting expansion.
When including infalling features in the analysis, the distance value was 8512 pc. Then we obtained an expansion velocity 5 km s-1(see figure 3), which is smaller than the value obtained by RCBY (V10 km s-1). The results of RCBY suggested that the circumstellar envelope is accelerated gradually toward the outside, from 2-3 km s-1 in the SiO maser region closest to the star to 20–30 km s-1 in the OH maser region most distant from the star. It is expected that RCBY’s results reflected a ”steady” flow of RT Vir. Because, as expected in theoretical models (e.g. Höfner, Feuchtinger, & Dorfi et al. 1995), infall motions occur as a result of a time-variable phenomenon, or shock wave, the infalling features are needed to be excluded in the model assuming the steady flow. Thus, the above distance value is concluded to be underestimated.
On the other hand, the statistical-parallax method (Genzel et al., 1981) gave distance values of 23729 pc (23227 pc and 24329 pc for the – and the – data, respectively) and 21428 pc (21127 pc and 21628 pc for the – and – data, respectively) when using all 3-D motion data and only the data used in the former model fitting, respectively. The distance values obtained in the former model-fitting and the statistical parallax methods are quite consistent with each other, and the weighted-mean distance value of 22030 pc is adopted for RT Vir in this paper.
Note that the statistical parallax methods used only maser features with measured proper motions. Adopting a radial velocity dispersion of 66 maser features detected in the first epoch when the largest number of features were detected, a distance value of 27932 pc was obtained. Thus, the radial velocity dispersion tends to have the larger value, with respect to the proper motion dispersion, when including maser features without measured proper motions. This implies that maser features without measured proper motions have the different kinematics from that of maser features with the proper motions. The distance estimation in this paper was the first successful one for a water maser source around a low-mass Mira-type star next to those around supergiants exhibiting many long-lived water maser features (Marvel, 1997).
4.3 Asymmetry of the mass-loss process in semiregular variables
The morphology and the kinematics of circumstellar envelopes (or mass-losing flows) of evolved stars, which are traced by the water maser kinematics, sometimes exhibit clear bipolarity or significant asymmetry. Even if taking into account the limited physical conditions for maser excitation, such asymmetry is evident throughout the revealed 3-D maser kinematics. At the end of the AGB phase in stellar evolution, such asymmetry will be tightly related to formation of elongated planetary nebulae, some of which are created by stellar jets (e.g., Imai et al. 2002). The asymmetry, however, has been also found in semiregular variables (e.g., Bowers, Claussen, & Johnston 1993; BJ; YC; I01), which has been considered to be at the early-AGB phase. The present and previous works (e.g., Marvel 1997: I01; Yates et al. 2000) have proven that radial-velocity gradients seen in water maser distributions are due to the bipolarity, not the rotation of mass-losing flows. On the other hand, many Mira and semiregular variables, including RT Vir, do not clearly show the flow bipolarity yet, having major/minor axis ratios of 2. It is still difficult to discuss the relation among the asymmetry, mass-loss rate, radius, and expansion velocity of a mass-losing flow due mainly to the limited number of sample stars available for data of the 3-D maser kinematics and for accurate distances. In this paper, we speculate about the weak asymmetry of the RT Vir flow.
We re-estimated a mass-loss rate for RT Vir adopting the described spherically-expanding flow model. The density of material (hydrogen molecules) in the flow is determined from predictions by a maser excitation theory as 106 cm 109 cm-3 (e.g., Cooke & Elitzur 1985; Elitzur 1992). Adopting the radius of the flow in the water maser region, 44 AU, at 220 pc (distribution size of 200 mas), an expansion velocity, 8 km s-1, we obtained a mass-loss rate of 1.510-7 (/106 cm-3) yr-1, whose lower limit is roughly consistent with that estimated by BJ. Adopting the relation between a radius of the water maser distribution and a mass-loss rate found by Cooke & Elitzur (1985) and Lane et al. (1987), the mass-loss rate of RT Vir should be much larger than this value (c.f., 310-6 yr-1, BJ).
On the other hand, Mira-type stars with relatively large mass-loss rates and larger flow radii have symmetric kinematics (e.g., BJ). In OH/IR stars with larger mass-loss rates, 1612-MHz OH masers exhibit larger and symmetric distributions (e.g., Chapman & Cohen 1986). It is considered that the intrinsic bipolarity or asymmetry of a mass-losing flow is obscured by the growing envelope as the mass-loss rate increases. In this case, RT Vir will be in the transition during an increase in its mass-loss rate. We have to take into account, however, cases of supergiants, which have much higher mass-loss rates but most of which exhibit significant asymmetry.
Note that the expansion velocity and the radius of a mass-losing flow determined seem to be time dependent. Water masers around R Aql are one of the examples (BJ). The bipolarity of the maser distribution was significant after the maximum of the light curve and vice versa. A similar variation in the maser distribution has been confirmed for RT Vir, but when a stellar pulsation period of 375 d is adopted (Paper I). Adopting this tendency, water masers around RT Vir were observed around the light maximum, in which the maser distribution was larger than those observed with the VLA (Bowers, Claussen, & Johnston 1993; BJ) but smaller than those observed with the Japanese VLBI Network (J-Net, Paper I). If we could measure maser proper motions with the J-Net data, the bipolarity would be exhibited more clearly. The time dependence of the bipolarity should be examined with monitoring observations for longer than a few cycles of the pulsation period.
4.4 Origin of apparent acceleration motions
Long-term monitoring observations have showed that there are apparent radial-velocity drifts of water maser features that have occurred simultaneously and exhibited the same drift direction (acceleration/deceleration) among several maser features (Lekht et al., 1999). This implies a change of the velocity field in the mass-losing flow due to the stellar pulsation as suggested above. In the case of RT Vir, such acceleration/deceleration observed is likely excited by stellar pulsation with a period of 375 d (Imai et al., 1997) rather than 155 d (e.g., Kholopov et al. 1985; Etoka et al. 2001). Such systematic velocity drifts may be detectable only with monitoring observations spanning at least one year. It is because there are small changes in the drift rates on this time scale and because it is sometimes difficult to remove data exhibiting velocity jumps due to blended features having intensity variation with time. In fact, in short duration ( a few months) the velocity drifts have not exhibited the same drift direction among maser features in both the previous and the present VLBI observations (see figure 6, also Paper I; I01).
On the other hand, theoretical models adopting shock waves driven by stellar pulsation predict that a shock wave creates acceleration/deceleration of a mass-losing flow and generates rapid velocity changes during the passage of the shock (a few months) (e.g., Höfner, Feuchtinger, & Dorfi et al. 1995). The velocity changes are expected to be 10 km s-1 and 2 km s-1 at the inner (5 AU) and the outer (50 AU) region of water maser excitation, respectively. The acceleration motion observed in a feature’s proper motion, as mentioned in section 3.3, is quite consistent with the theoretical prediction.
It has been a long-term issue whether change in the location of a maser feature is tracing actual physical movement of the gas in a clump rather than some kind of non-kinematic effect, such as traveling excitation phenomena or chance realignment of coherency paths through the masing gas. Recent observations, however, have strongly suggested the former in hydroxyl and water masers; all of the observations have shown that individual maser features persist in both their spatial and radial-velocity patterns throughout their motion for distances much larger than their own sizes (e.g., Bloemhof, Moran, & Reid 1996; Torrelles et al. 2001a, b; Paper III). The maser feature (RT Vir I2002:47, see figure 7 and 8) exhibited a large acceleration on the sky, but simultaneously a large position drift of 2 mas, a stable radial velocity (variation less than 0.2 km s-1). This feature also exhibited a persistent V-shaped pattern formed by a cluster of maser spots, which have radial velocities successively changing by 0.056 km s-1 from one spot to another. These strongly support that this maser feature traces the movement of a gas clump throughout five observation epochs.
The larger acceleration on the sky plane (over 10 km s-1) than that in the line-of-sight (1 km s-1yr-1) is likely due to the beaming effect of maser radiation. Taking into account the hydrodynamical treatment of a maser clump, an apparent acceleration motion of a brightness peak in the maser clump is expressed as, , where and are the velocity field as a function of distance from the star, , and the location in the clump, respectively. Assuming a velocity drift of 30 km s-1yr-1, a mean velocity of 8 km s-1, a velocity gradient of 4 km s-1 mas-1 is expected at 220 pc. This velocity gradient is larger than that observed in the above maser feature on the sky plane (1 km s-1 mas-1) and that expected from a steady accelerating envelope in the region of the H2O masers estimated by Bains et al. (2002),
| (3) |
If such a large velocity gradient is generated along the line-of-sight, the velocity-coherent path is too short to produce strong maser amplification occurring in a velocity width of less than 1- 2 km s-1. Adopting a velocity-coherent path 10 times as long as the observed feature size (1 mas), an acceleration motion of less than 1–2 km s-1yr-1 is expected along the line-of-sight. Thus, only large acceleration along the sky plane is detectable.
The present paper is the first approach to directly detect the pulsation-driven shock waves, which should be identified in future works by finding simultaneously several maser features performing such acceleration motions and by elucidating the relation between the occurrence of the acceleration and the stellar light curve.
5 Summary
Our monitoring VLBA observations of water masers around RT Vir have revealed the 3-D kinematics of water masers in more detail and detected the acceleration motions of water maser features. Because of the good angular resolution (1 mas) and time separations (3 weeks in five epochs), we were able to measure 60 proper motions and radial-velocity drifts of maser features. Carefully dealing with maser features exhibiting infall towards the star, we obtained a spherically-expanding flow model from the 3-D maser kinematics. The estimated expansion velocity of 8 km s-1 is consistent with that previously suggested. The estimated outer radius of the maser distribution, 45 AU, was 2–3 times as large as those previously estimated, except for those estimated in the J-Net observations. The estimated velocity field of the flow is roughly spherically symmetric, while the maser spatial and velocity distribution looks weakly asymmetric. Adopting the above flow model and taking into account a statistical parallax, we estimated the distance to RT Vir as to be 22030 pc. We found radial-velocity drifts of maser features of 2 km s-1 and speculated that the drifts larger than 2 km s-1 are due to blending of a few maser features within a small region in space and velocity. We also found an acceleration motion in the proper motion of a maser feature with a rate of 33 km s-1yr-1 and indicating radial acceleration. Such acceleration motions seen both in the line-of-sight and on the sky plane are explained by a single common phenomenon: passages of pulsation-driven shock waves in the circumstellar envelope. The possible variation in the maser expansion size and distribution asymmetry with time as well as observed acceleration motions should be examined in future observations with time intervals longer than a few cycles of the stellar pulsation.
References
- Bains et al. (2002) Bains, I., Cohen, R. J., Louridas, A., Richards, A. M. S., Rosa-González, D., & Yates, J.A. 2002, MNRAS, submitted (astro-ph/0211473)
- Bloemhof (2000) Bloemhof, E. E. 2000, ApJ, 533, 893
- Bloemhof, Moran, & Reid (1996) Bloemhof, E. E., Moran, J. M., & Reid, M. J. 1996, ApJ, 467, L117
- Bowers, Claussen, & Johnston (1993) Bowers, P. F., Claussen, M. J., & Johnston, K. L. 1993, AJ, 105, 284
- Bowers & Johnston (1994) Bowers, P. F., & Johnston, K. L. 1994, ApJS, 92, 189 (BJ)
- Colomer et al. (1992) Colomer, F. et al. 1992, A&A, 254, L17
- Cooke & Elitzur (1985) Cooke, B., & Elitzur, M. 1985, ApJ, 295, 175
- Chapman & Cohen (1986) Chapman, J. M., & Cohen, R. J. 1986, MNRAS, 220, 513
- Diamond & Kemball (1999) Diamond, P.J., & Kemball, A. J. 1999, in: IAU symp. 191, eds. T. Le Bertre, A. Lebre, & C. Waelkens (San Francisco: Astron. Soc. Pacific), p. 195
- Elitzur (1992) Elitzur, M. 1992, in Astronomical Masers (Dordrecht: Kluwer)
- Elitzur (1992) –. 1992, ARA&A, 30, 75
- Etoka et al. (2001) Etoka, S., Blaszkiewicz, L., Szymczak, M., & Le Squeren, A. M. 2001, A&A, 378, 522
- Genzel et al. (1981) Genzel, R., Reid, M. J., Moran, J. M., & Downes, D. 1981, ApJ, 244, 844
- Gwinn (1994) Gwinn, C. R. 1994, ApJ, 429, 241
- Gwinn, Moran, & Reid (1992) Gwinn, C. R., Moran, J. M., & Reid, M. J. 1992, ApJ, 393, 149
- Höfner, Feuchtinger, & Dorfi et al. (1995) Höfner, S., Feuchtinger, M. U., & Dorfi, E. A. 1995, A&A, 297, 815
- Imai et al. (2002) Imai, H., Obara, K., Diamond, P. J., Omodaka, T., & Sasao, T. 2002, Nature, 417, 829
- Imai, Deguchi, & Sasao (2002) Imai, H., Deguchi, S., & Sasao, T. 2002, ApJ, 567, 971 (Paper III)
- Imai et al. (2000) Imai, H., Kameya, O., Sasao, T., Miyoshi, M., Deguchi, S., Horiuchi, S., & Asaki, Y. 2000, ApJ, 538, 751 (Paper II)
- Imai et al. (1997) Imai, H. et al. 1997, A&A, 317, L67
- Imai et al. (1997) Imai, H., Shibata, K. M., Sasao, T., Miyoshi, M., Omodaka, T., Morimoto, M., Iwata, T., Suzuyama, T., Mochizuki, N., Miyaji, T., & Makeuti, M. 1997b, A&A, 319, L1 (Paper I)
- Ishitsuka et al. (2001) Ishituska, J. K., Imai, H., Omodaka, T., Ueno, M., Kameya, O., Sasao, T., Morimoto, M., Miyaji, T. et al. 2001, PASJ53, 1231 (I01)
- Kholopov et al. (1985) Kholopov, P. N., Samus, N. N., Kazarovets, F. V., & Perova, N. B. 1985–1988, Genral Catalogue of Variable Stars, 4th ed. (Moscow: Nauka Publishing House)
- Lane et al. (1987) Lane, A. P., Johnston, K. J., Bowes, P. F., Spencer, J. H., & Diamond, P. J. 1987, ApJ, 323, 756
- Lekht et al. (1999) Lekht, E. E., Mendoza-Torres, J. E., Pashchenko, M. I., & Berulis, I. I. 1999, A&A, 343, 241
- Marvel (1997) Marvel, K. B. 1997, PASP, 109, 1286
- Reid & Menten (1997) Reid, M. J., & Menten, K. M. 1997, ApJ, 476, 327
- Reid & Menten (1990) Reid, M. J., & Menten, K. M. 1990, ApJ, 360, L51
- Reid & Moran (1981) Reid, M. J., Moran, J. M. 1981, ARA&A, 19, 231
- Richards et al. (1999) Richards, A. M. S., Cohen, R. J., Bains, I., & Yates, J. A. 1999a, in: Asymptotic Giant Branch Stars, IAU Symposium 191, eds. T. Le Bertre, A. Lebre, & C. Waelkens (San Francisco: Astron. Soc. Pacific), p. 315 (RCBY)
- Torrelles et al. (2001) Torrelles, J. M., Patel, N. A., Gómez, J. F., Ho, P. T. P., Rodoríguez, L. F., Anglada, G., Garay, G., Greenhill, L. J., et al. 2001a, Nature, 411, 277
- Torrelles et al. (2001) –. 2001b, ApJ, 560, 853
- Yates et al. (2000) Yates, J. A., Richards, A. M. S., Gledhill, T. M., & Bains, I. 2000, in: Asymmetrical Planetary Nebulae II: From Origins to Microstructures, APS Conf. Ser. 199, eds. J. H. Kastner, N. Soker, & S. Rappaport (San Francisco: Astron. Soc. Pacific), p. 79 (YRGB)
- Yates & Cohen (1994) Yates, J. A., & Cohen, R. J. 1994, MNRAS, 270, 958 (YC)
- Yuasa & Unno (1999) Yuasa, M., & Unno, W., & Magono S. 1999, PASJ, 51, 197
| Observation status | Position-reference maser feature (RT Vir: I2002 33) | ||||||
| LSR | Peak | Position relative to the map origin | |||||
| Maser | Doppler | intensity | |||||
| Date | features | velocity | at Epoch 1 | ||||
| Epoch | (1998) | UT span | detected | ( km s-1) | (Jy beam-1) | (mas) | (mas) |
| 1 | May 11 | 03:00–07:00 | 66 | 17.14 | 29.6 | 83.885 | 6.922 |
| 2 | May 31 | 01:30–05:30 | 62 | 17.16 | 73.1 | 0.000 | 0.069 |
| 3 | June 19 | 00:00–04:00 | 53 | 17.10 | 82.3 | 0.002 | 0.025 |
| 4 | July 12 | 22:30–02:30 | 50 | 17.10 | 84.2 | 0.015 | 0.059 |
| 5 | August 1 | 21:00–01:00 | 53 | 17.10 | 63.5 | 0.034 | 0.077 |
| Maser11footnotemark: 1 | Offset22footnotemark: 2,33footnotemark: 3 | Proper motion33footnotemark: 3 | Rad. motion44footnotemark: 4 | RV drift55footnotemark: 5 | Peak intensity at five epochs | |||||||||||
|---|---|---|---|---|---|---|---|---|---|---|---|---|---|---|---|---|
| feature | (mas) | (mas yr-1) | (km s-1) | (km s-1yr-1) | (Jy beam-1) | Infall66footnotemark: 6 | ||||||||||
| (RT Vir: | ||||||||||||||||
| I2002) | R.A. | decl. | 77footnotemark: 7 | 88footnotemark: 8 | Ep. 1 | Ep. 2 | Ep. 3 | Ep. 4 | Ep. 5 | |||||||
| 1 | 89.79 | 7.95 | 1.55 | 0.32 | 2.98 | 0.36 | 7.57 | 0.72 | 0.02 | 0.35 | 57.40 | … | 110.33 | … | 12.00 | Infall |
| 2 | 90.09 | 7.53 | 2.02 | 1.02 | 0.26 | 2.18 | 7.53 | 0.71 | 0.82 | 1.38 | … | … | … | 90.08 | 12.41 | Infall |
| 3 | 63.40 | 8.82 | 3.53 | 0.60 | 10.58 | 0.54 | 7.17 | 0.77 | 1.74 | 0.46 | 24.65 | … | 19.70 | 48.50 | … | Infall |
| 4 | 83.71 | 6.99 | 10.17 | 0.25 | 1.14 | 0.28 | 6.89 | 0.72 | 1.64 | 0.31 | 132.00 | 47.40 | 127.00 | 81.51 | 25.90 | |
| 5 | 112.87 | 14.68 | 10.95 | 0.86 | 7.58 | 0.59 | 6.39 | 0.63 | 0.24 | 0.33 | 4.09 | 6.99 | 4.56 | … | 2.54 | |
| 6 | 110.78 | 26.95 | 8.54 | 0.29 | 2.08 | 0.56 | 6.26 | 0.39 | 0.41 | 0.45 | 14.20 | 12.10 | 8.32 | 3.30 | … | Infall |
| 7 | 109.81 | 26.29 | 7.83 | 0.85 | 5.06 | 1.35 | 6.18 | 0.30 | 0.91 | 0.74 | 8.38 | 5.35 | 3.44 | … | … | Infall |
| 8 | 110.78 | 27.00 | 7.11 | 10.84 | 5.04 | 9.27 | 6.17 | 0.44 | 0.73 | 1.45 | 15.67 | 12.46 | … | … | … | Infall |
| 9 | 112.01 | 29.95 | 5.62 | 1.24 | 0.31 | 0.99 | 6.06 | 0.51 | 2.39 | 0.45 | 7.72 | 5.66 | 4.18 | 2.18 | … | Infall |
| 10 | 115.57 | 16.36 | 14.64 | 1.95 | 4.85 | 4.77 | 5.99 | 0.50 | 0.87 | 1.38 | … | … | … | 2.24 | 2.39 | |
| 11 | 110.97 | 27.49 | 10.35 | 0.97 | 0.54 | 1.59 | 5.84 | 0.18 | 0.84 | 0.74 | 5.48 | 6.22 | 2.78 | … | … | |
| 12 | 79.21 | 46.69 | 8.03 | 0.33 | 10.06 | 0.42 | 5.47 | 0.86 | 0.75 | 0.45 | 7.29 | 9.04 | 9.50 | 12.11 | … | |
| 13 | 82.47 | 48.46 | 1.54 | 3.24 | 9.20 | 1.63 | 5.30 | 0.53 | 0.82 | 1.45 | 2.91 | 1.98 | … | … | … | Infall |
| 14 | 80.38 | 47.83 | 0.73 | 2.20 | 11.49 | 1.22 | 5.22 | 0.63 | 1.59 | 1.45 | 4.31 | 4.14 | … | … | … | Infall |
| 15 | 85.89 | 49.26 | 5.63 | 0.25 | 6.55 | 1.05 | 5.20 | 0.65 | 0.82 | 0.45 | … | 7.86 | 8.41 | … | 4.98 | |
| 16 | 86.21 | 48.79 | 7.20 | 0.60 | 6.70 | 0.24 | 5.14 | 1.01 | 0.53 | 0.31 | 10.71 | 14.30 | 14.20 | 8.26 | 10.70 | |
| 17 | 87.32 | 50.13 | 6.47 | 0.87 | 4.92 | 0.79 | 4.57 | 0.44 | 0.02 | 1.38 | … | … | … | 3.66 | 2.42 | |
| 18 | 87.59 | 54.85 | 6.53 | 0.55 | 8.85 | 1.26 | 4.03 | 0.44 | 0.39 | 0.46 | 0.58 | 0.51 | … | 0.38 | … | |
| 19 | 108.43 | 52.72 | 12.10 | 1.42 | 5.74 | 1.44 | 4.03 | 0.71 | 0.86 | 0.66 | … | … | 0.74 | … | 2.45 | |
| 20 | 1.35 | 9.16 | 0.28 | 0.38 | 0.13 | 0.62 | 4.03 | 0.62 | 1.78 | 0.31 | 0.40 | 0.76 | 1.05 | 1.90 | 0.21 | |
| 21 | 105.53 | 49.51 | 8.25 | 1.82 | 8.48 | 1.83 | 3.97 | 0.53 | 0.20 | 0.74 | 0.59 | 0.73 | 0.68 | … | … | |
| 22 | 87.55 | 53.13 | 6.23 | 0.60 | 6.42 | 1.45 | 3.97 | 0.66 | 0.22 | 0.45 | 1.42 | 1.16 | 0.76 | 0.42 | … | |
| 23 | 27.73 | 89.82 | 1.73 | 0.71 | 7.42 | 1.22 | 3.68 | 0.31 | 0.93 | 0.45 | … | 0.38 | … | 0.38 | 0.22 | |
| 24 | 66.42 | 59.16 | 2.38 | 1.52 | 10.97 | 5.06 | 3.66 | 0.74 | 0.33 | 1.45 | 1.15 | 0.72 | … | … | … | |
| 25 | 27.22 | 88.85 | 1.85 | 2.48 | 16.60 | 3.62 | 3.58 | 0.37 | 1.15 | 1.45 | 0.42 | 0.48 | … | … | … | |
| 26 | 62.84 | 58.57 | 5.38 | 0.76 | 6.22 | 0.58 | 3.50 | 0.26 | 0.06 | 0.31 | 1.23 | 1.14 | 0.94 | 0.64 | 0.41 | |
| 27 | 63.71 | 58.24 | 3.48 | 2.71 | 7.90 | 5.51 | 3.32 | 0.47 | 3.37 | 1.45 | 0.51 | 0.51 | … | … | … | |
| 28 | 53.53 | 57.89 | 7.33 | 2.21 | 2.98 | 2.52 | 3.19 | 0.47 | 2.06 | 1.38 | … | … | … | 0.35 | 0.27 | Infall |
| 29 | 24.46 | 88.86 | 3.01 | 0.69 | 12.58 | 0.70 | 3.14 | 0.45 | 0.59 | 0.31 | 0.42 | 0.50 | 0.52 | 0.54 | 0.35 | |
| 30 | 48.42 | 58.95 | 6.23 | 2.09 | 4.43 | 1.56 | 2.66 | 0.23 | 1.12 | 1.38 | … | … | … | 0.27 | 0.15 | |
| 31 | 1.90 | 3.14 | 0.70 | 0.61 | 1.52 | 1.88 | 2.00 | 0.95 | 0.62 | 0.69 | … | 8.59 | 6.38 | 3.74 | … | |
| 32 | 0.37 | 2.81 | 6.03 | 1.07 | 2.30 | 1.09 | 1.52 | 0.76 | 4.02 | 0.74 | 14.30 | … | 6.82 | … | … | |
| 33 | 0.00 | 0.00 | 0.00 | 0.27 | 0.00 | 0.43 | 1.06 | 1.14 | 0.23 | 0.31 | 29.58 | 73.11 | 82.28 | 84.17 | 63.47 | |
| 34 | 1.26 | 22.67 | 9.60 | 2.81 | 1.37 | 4.22 | 0.99 | 0.47 | 0.25 | 1.53 | … | 5.37 | 5.57 | … | … | |
| 35 | 0.10 | 23.27 | 7.50 | 3.39 | 0.15 | 5.93 | 0.99 | 0.50 | 1.79 | 1.53 | … | 4.59 | 5.63 | … | … | Infall |
| 36 | 0.81 | 14.73 | 2.22 | 1.36 | 2.18 | 1.56 | 0.96 | 0.42 | 1.73 | 0.74 | 4.08 | … | 3.11 | … | … | |
| 37 | 1.04 | 0.18 | 0.30 | 0.55 | 0.65 | 0.70 | 0.76 | 0.79 | 0.42 | 0.45 | 30.95 | 24.80 | 14.66 | 16.32 | … | |
| 38 | 2.91 | 3.67 | 2.82 | 1.92 | 1.18 | 3.07 | 0.62 | 0.29 | 2.03 | 1.53 | … | 2.19 | 2.86 | … | … | |
| 39 | 0.09 | 0.19 | 0.29 | 0.25 | 1.33 | 0.25 | 0.62 | 0.29 | 0.00 | 0.69 | … | 14.80 | … | 9.72 | … | |
| 40 | 1.05 | 0.25 | 1.22 | 0.21 | 2.07 | 0.23 | 0.62 | 0.67 | 1.00 | 0.45 | … | 20.60 | … | 11.00 | 7.36 | |
| 41 | 19.18 | 34.53 | 4.49 | 0.29 | 4.48 | 0.37 | 2.68 | 0.45 | 0.15 | 0.31 | 0.51 | 0.43 | 0.67 | 1.69 | 1.34 | |
| 42 | 10.56 | 31.90 | 2.04 | 0.36 | 4.01 | 1.16 | 3.07 | 0.50 | 0.09 | 0.74 | 19.30 | … | 1.70 | … | … | |
| 43 | 11.84 | 34.22 | 0.07 | 0.27 | 2.21 | 0.49 | 3.26 | 0.34 | 1.58 | 0.45 | 5.05 | 4.35 | 3.33 | 2.73 | … | |
| 44 | 12.01 | 34.57 | 1.59 | 1.03 | 3.40 | 0.91 | 3.32 | 0.51 | 0.91 | 0.66 | … | … | 2.22 | 3.47 | 2.28 | |
| 45 | 10.56 | 31.79 | 0.55 | 0.39 | 1.17 | 3.31 | 3.38 | 0.50 | 0.49 | 1.45 | 34.77 | 12.06 | … | … | … | Infall |
| 46 | 10.22 | 30.73 | 4.22 | 0.73 | 5.12 | 2.01 | 3.43 | 0.16 | 2.19 | 0.45 | … | 12.40 | 2.14 | 3.86 | 4.51 | |
| 47 | 10.33 | 30.78 | 5.49 | 0.53 | 6.37 | 0.76 | 3.70 | 0.93 | 0.00 | 0.31 | 50.30 | 36.97 | 22.61 | 11.83 | 7.44 | |
| 48 | 9.97 | 30.55 | 2.66 | 0.20 | 2.49 | 0.82 | 3.76 | 0.41 | 1.34 | 0.45 | 47.30 | 6.58 | 5.26 | … | … | Infall |
| 49 | 10.56 | 30.91 | 2.51 | 0.96 | 7.79 | 2.66 | 3.77 | 0.60 | 2.17 | 0.74 | 46.85 | 23.60 | 5.39 | … | … | Infall |
| 50 | 73.88 | 48.96 | 7.97 | 0.66 | 7.66 | 0.48 | 3.84 | 0.60 | 1.65 | 0.31 | 2.04 | 3.74 | 2.73 | 4.38 | 2.16 | |
| 51 | 77.68 | 44.51 | 10.79 | 0.07 | 7.30 | 0.08 | 4.43 | 0.76 | 0.43 | 0.31 | 5.05 | 6.45 | 8.27 | 20.40 | 27.00 | |
| 52 | 64.93 | 45.77 | 9.97 | 1.46 | 6.10 | 1.74 | 5.33 | 0.44 | 0.97 | 1.26 | … | … | 2.32 | 4.24 | … | Infall |
| 53 | 63.63 | 42.68 | 6.23 | 1.88 | 4.24 | 1.86 | 5.47 | 0.76 | 2.28 | 1.26 | … | … | 2.79 | 7.21 | … | |
| 54 | 62.61 | 34.55 | 4.60 | 0.36 | 4.01 | 0.33 | 5.75 | 1.00 | 0.33 | 0.45 | 131.05 | 40.61 | 11.10 | 6.68 | … | Infall |
| 55 | 62.22 | 49.67 | 4.31 | 2.84 | 5.94 | 2.01 | 5.76 | 0.45 | 1.17 | 1.45 | 9.66 | 3.13 | … | … | … | |
| 56 | 32.04 | 30.98 | 5.02 | 0.42 | 6.84 | 0.44 | 6.28 | 0.46 | 1.09 | 0.31 | 0.61 | 0.56 | … | 0.86 | 0.77 | Infall |
| 57 | 15.22 | 28.06 | 2.65 | 1.09 | 0.89 | 0.50 | 7.09 | 0.58 | 0.33 | 0.45 | 1.06 | 0.97 | 0.71 | 0.43 | … | Infall |
| 58 | 15.02 | 18.85 | 3.39 | 0.81 | 5.02 | 2.28 | 7.13 | 0.95 | 2.20 | 1.45 | 2.31 | 0.88 | … | … | … | |
| 59 | 14.20 | 28.45 | 0.62 | 1.39 | 1.31 | 1.45 | 7.26 | 0.60 | 2.77 | 0.74 | 0.64 | 0.67 | 0.64 | … | … | Infall |
| 60 | 14.30 | 28.29 | 4.81 | 1.18 | 2.13 | 1.53 | 7.42 | 0.74 | 0.72 | 0.66 | … | … | 0.58 | 0.60 | 0.33 | Infall |
Water maser features detected toward RT Vir.
The feature is designated as RT Vir:I2002 N, where N is
the ordinal source number given in this column (I2002
stands for sources found by Imai et al. and listed in 2002).
22footnotemark: 2 Parameters at the first epoch while the feature was
being detected.
33footnotemark: 3 Relative value with respect to the location of the
position-reference maser feature: RT Vir:I2002 34.
44footnotemark: 4 Relative radial velocity with respect to the assumed
systemic velocity of 18.2 km s-1.
55footnotemark: 5 Secular drift rate of a radial velocity.
66footnotemark: 6 Infall: exhibiting a negative expansion velocity in the
model fitting adopting only expanding features.
77footnotemark: 7 Mean full velocity width of maser feature at half intensity.
88footnotemark: 8 Uncertainty obtained when assuming a measurement error
of a radial velocity, which equals to the channel spacing (0.056 km s-1).
| Including infalling features | Only expanding features | |||||||||||
| Parameter | Step 111footnotemark: 1 | Step 222footnotemark: 2 | Step 111footnotemark: 1 | Step 222footnotemark: 2 | ||||||||
| Features finally used | 46 | 48 | ||||||||||
| Offsets | ||||||||||||
| Velocity: | ||||||||||||
| 33footnotemark: 3 ( km s-1) | 1.9 | 0.7 | 2.6 | 0.3 | 3.2 | 1.4 | 3.5 | 0.6 | ||||
| 33footnotemark: 3 ( km s-1) | 0.7 | 0.5 | 0.4 | 0.4 | 4.3 | 1.0 | 3.8 | 0.7 | ||||
| 44footnotemark: 4 ( km s-1) | 055footnotemark: 5 | 0.7 | 0.3 | 055footnotemark: 5 | 2.5 | 0.5 | ||||||
| Position: | ||||||||||||
| (mas) | 39 | 6 | 57 | 3 | 11 | 9 | 8 | 5 | ||||
| (mas) | 13 | 5 | 31 | 2 | 14 | 6 | 15 | 6 | ||||
| Velocity field | ||||||||||||
| Radial outflow: | ||||||||||||
| ( km s-1) | …66footnotemark: 6 | 0.1 | 0.4 | …66footnotemark: 6 | 6.6 | 0.6 | ||||||
| ( km s-1arcsec-α) | …66footnotemark: 6 | 1.5 | 0.1 | …66footnotemark: 6 | 2.0 | 1.5 | ||||||
| …66footnotemark: 6 | 0.40 | 0.03 | …66footnotemark: 6 | 0.51 | 0.39 | |||||||
| Distance (pc) | 27077footnotemark: 7 | 87 | 12 | 27077footnotemark: 7 | 226 | 16 | ||||||
| RMS residual | 3.02 | 6.84 | 2.33 | 4.33 | ||||||||
Assuming independent expansion velocities of maser
features.
22footnotemark: 2 Asumming a common expansion velocity field
expressed by equation (12) of Imai et al. (2000).
33footnotemark: 3 Relative value with respect to the position-reference
maser feature.
44footnotemark: 4 Relative value with respect to 18.2 km s-1.
55footnotemark: 5 Step 1 assumes the systemic radial velocity:
0.0 km s-1.
66footnotemark: 6 The solution determines a radial outflow velocity
(i) independently for each feature with a proper motion.
77footnotemark: 7 Distance is completely covariant with the
and (i) and cannot be determined: 270 pc.